Multi-Element Abundance Measurements from Medium-Resolution
Spectra.
III. Metallicity Distributions of Milky Way Dwarf
Satellite Galaxies
Abstract
We present metallicity distribution functions (MDFs) for the central regions of eight dwarf satellite galaxies of the Milky Way: Fornax, Leo I and II, Sculptor, Sextans, Draco, Canes Venatici I, and Ursa Minor. We use the published catalog of abundance measurements from the previous paper in this series. The measurements are based on spectral synthesis of iron absorption lines. For each MDF, we determine maximum likelihood fits for Leaky Box, Pre-Enriched, and Extra Gas (wherein the gas supply available for star formation increases before it decreases to zero) analytic models of chemical evolution. Although the models are too simplistic to describe any MDF in detail, a Leaky Box starting from zero metallicity gas fits none of the galaxies except Canes Venatici I well. The MDFs of some galaxies, particularly the more luminous ones, strongly prefer the Extra Gas Model to the other models. Only for Canes Venatici I does the Pre-Enriched Model fit significantly better than the Extra Gas Model. The best-fit effective yields of the less luminous half of our galaxy sample do not exceed , indicating that gas outflow is important in the chemical evolution of the less luminous galaxies. We surmise that the ratio of the importance of gas infall to gas outflow increases with galaxy luminosity. Strong correlations of average [Fe/H] and metallicity spread with luminosity support this hypothesis.
Subject headings:
galaxies: dwarf — galaxies: abundances — galaxies: evolution — Local Group1. Introduction
The star formation history of a galaxy shapes the metallicity distribution of its stars. Therefore, simply counting the number of stars in different bins of metallicity in a galaxy is a way to quantify the gas dynamics during the history of star formation in the galaxy. How much gas was accreted by gravitational attraction? How much gas left the galaxy from supernova winds (e.g., Dekel & Silk, 1986; Governato et al., 2010) or tidal or ram pressure stripping (Lin & Faber, 1983; Marcolini et al., 2003) from interaction with the Milky Way (MW)?
The most basic approach to answering these questions is to fit an analytic model of chemical evolution to the observed metallicity distribution function (MDF). For example, one could assume that the galaxy is a “closed box” (Talbot & Arnett, 1971). In other words, the galaxy begins its life with a fixed amount of gas. It loses gas only to the formation of stars, and it does not acquire new gas. Van den Bergh (1962) and Schmidt (1963) famously applied this model to the metallicity distribution of G dwarfs in the solar neighborhood to find that the MW disk is not a closed box. Instead, it experiences more complicated gas dynamics. Pagel (1997) described some more complex analytic models, including some that incorporate the accretion of external gas during the lifetime of star formation.
Our aim is to examine the metallicity distributions of dwarf spheroidal satellite galaxies (dSphs) of the MW in order to reveal how gas infall and outflow affected their star formation histories. We use the [Fe/H] measurements for individual stars in eight MW dSphs from Paper II (Kirby et al., 2010b). The measurements are based on spectral synthesis of iron lines from medium resolution spectra. Kirby, Guhathakurta, & Sneden (2008a) described the measurements in detail. We modified the procedure for determining [Fe/H] in Papers I and II (Kirby et al., 2009, 2010b).
Several previous spectroscopic studies have examined MW dSph metallicity distributions in the context of star formation history. Most of them rely on a calibration between the summed equivalent widths of the Ca infrared triplet and [Fe/H] (e.g., Rutledge et al., 1997). Tolstoy et al. (2001) first published a significant sample of Ca triplet metallicities for the Sculptor and Fornax dSphs. From the widths of the metallicity distributions and the age spreads apparent from their broadband colors combined with spectroscopic metallicities, they concluded that both dSphs experienced extended star formation, unlike globular clusters. Since then, the Dwarf Abundances and Radial Velocities Team (DART) have measured MDFs for Carina and Sextans in addition to Fornax and Sculptor (Tolstoy et al., 2004; Helmi et al., 2006; Battaglia et al., 2006, 2008b, 2010). Koch et al. (2006) also conducted their own Ca triplet survey of Carina. Kirby et al. (2008a) showed the first spectral synthesis abundance measurements in dwarfs from observations with a multi-object spectrograph. They found extremely metal-poor stars in the ultra-faint dSph sample of Simon & Geha (2007). Shetrone et al. (2009) also applied spectral synthesis to medium-resolution spectra. They obtained [Fe/H] measurements for 27 red giants in Leo II. In Paper I (Kirby et al., 2009), we presented the MDF for the Sculptor dwarf galaxy based on the spectral synthesis of iron lines for 388 red giants.
In this paper, we extend our analysis of Sculptor to seven additional MW dSphs: Fornax, Leo I and II, Sextans, Draco, Canes Venatici I, and Ursa Minor. The sample of 2961 stars in eight galaxies permits a comparative look at star formation histories, particularly as the properties of the MDFs change with dSph luminosity. Furthermore, we examine how the distributions of [Fe/H] change as a function of distance from the center of each dSph.
We describe three analytic chemical evolution models in Sec. 2. They are Pristine, Pre-Enriched, and Extra Gas Models. In Sec. 3, we analyze the MDF of each dSph in detail. We discuss how each chemical evolution model may or may not apply to different dSphs. The results of previously published numerical models (Lanfranchi & Matteucci, 2003, 2004) are compared to the observed MDFs in Sec. 4. Section 5 is devoted to radial gradients and their relevance to the dwarf galaxies’ star formation histories. We quantify trends of the MDF properties with luminosity in Sec. 6 and the trends of the most likely chemical evolution model parameters with dSph properties in Sec. 7. Finally, in Sec. 8, we summarize our conclusions, point out shortcomings in the chemical evolution models and our conclusions from them, and suggest how our work may be improved in the future.
2. Analytic Chemical Evolution Models
The theory of galactic chemical evolution has progressed significantly since Tinsley (1980) codified the field. Lanfranchi & Matteucci (2004) applied sophisticated multi-element models to the then scant spectroscopic stellar abundance measurements in MW satellite galaxies. Marcolini et al. (2006, 2008) created three-dimensional, hydrodynamic models of isolated dwarf galaxies, but the sample size of observations was inadequate to test their models. Only recently, Revaz et al. (2009) modeled the abundance distributions of several MW satellites. They obtained a reasonable agreement between their predictions and the large samples of the Dwarf Abundances and Radial Velocities Team’s abundance measurements in Fornax and Sculptor.
In Paper I of this series, we fit two different chemical evolution models to the MDF of the Sculptor dwarf galaxy: a Simple Model and an Extra Gas Model. The Simple Model represented a leaky box. Although the gas was allowed to leave the galaxy, the galaxy never acquired new gas. Gas outflows do not affect the functional form of the MDF as long as the nucleosynthetic yield is assumed to be the effective yield and not the true metal yield of the stars. In the Simple Model, the initial gas of the galaxy was also allowed to be be pre-enriched with a metallicity of .
We distinguish between the Simple Model with pristine initial gas () and pre-enriched initial gas ( is finite). Pagel (1997) gave the functional form of the MDF of the Pre-Enriched Model:
| (1) |
where is in units of the solar metal fraction (). For the Pristine Model, one term vanishes:
| (2) |
In both the Pristine and Pre-Enriched Models, the peak of the MDF increases with . However, a metal-rich dwarf galaxy did not necessarily host supernovae with higher yields than a more metal-poor galaxy, even if the Pristine Model is a good description for both galaxies. Because represents the effective yield, it encapsulates both the supernova yield and gas outflow. Larger supernova yield increases , and more intense gas outflow decreases . Therefore, an equally valid interpretation of the hypothetical MDFs is that the metal-rich (large ) galaxy retained gas more effectively than the metal-poor galaxy.
The Extra Gas Model is the Best Accretion Model of Lynden-Bell (1975, also see ). Unlike the Pristine and Pre-Enriched Models, it allows the galaxy to access an additional supply of gas available for forming stars during or between other episodes of star formation. For simplicity, we assume that the gas is metal-free, and we assume that the rate of gas infusion decays over time. Furthermore, we assume a relation between the gas mass and the stellar mass that permits an analytic solution to the differential metallicity distribution. Lynden-Bell generated such a relation for which the gas mass reached a maximum and for which the stellar mass rose asymptotically to its final value. These qualitative characteristics matched the simulations of Larson (1974a). In this model, the gas mass in units of the initial gas mass is related quadratically to the stellar mass in the same units:
| (3) |
where is a parameter greater than 1. In the special case where all of the gas is converted into stars and is the true yield, equals the final stellar mass in units of the initial mass of gas at the onset of star formation. When , Eq. 3 reduces to , which describes a closed box, wherein the gas mass is depleted only by star formation. Therefore, the Extra Gas Model reduces to the Pristine Model when . Otherwise, an increase in represents an increase in the amount of gas the galaxy gains. The following two equations describe the differential metallicity distribution:
| (4) | |||||
| (5) | |||||
Equation 4 is transcendental, and it must be solved for numerically. The solution to may then be put into Equation 5.
Lynden-Bell (1975) named his model the Best Accretion Model because he assumed that new gas became available for star formation by the accretion or infall of gas onto the galaxy. We have chosen the more general name Extra Gas Model. The model is too simplistic to distinguish between different mechanisms of cold gas infusion. For example, the galaxy could contain hot gas. If that gas cools between episodes of star formation, then it becomes available to form stars. However, the Extra Gas Model does require the newly available gas supply to be metal-free, or at least much more metal-poor than the bulk stellar metallicity at any given time.
Allowing for extra gas complicates the interpretation of the peak of the MDF. Both a larger supernova yield and smaller increase in the supply of pristine gas would increase the peak of the MDF. However, gas outflow would still decrease the peak of the MDF. Thankfully, under the assumption of instantaneous mixing, the parameter uniquely quantifies the amount of extra gas, leaving to be degenerate only between the supernova yield and gas outflow.
The Pristine, Pre-Enriched, and Extra Gas models all assume the instantaneous recycling approximation (IRA) and the instantaneous mixing approximation (IMA). The IRA poorly reproduces the distribution of secondary nuclides, which are produced on longer timescales than primary nuclides. Unfortunately, iron is a secondary nuclide, but it is the most precisely measured of any element in stellar spectroscopy because it has a large number of absorption lines in the visible spectrum. The IMA may not be appropriate for dSphs. Marcolini et al. (2008) showed that inhomogeneous pollution from Type Ia SNe affects the modeled MDF of a Draco-like dSph within two core radii. However, analytic forms of the differential metallicity distributions require the assumption of both the IRA and the IMA.
3. Metallicity Distributions
We fit the Pristine, Pre-Enriched, and Extra Gas Models to the MDF of each of the eight dSphs in the catalog from Paper II. The model parameters—one for the Pristine Model and two for each of the Pre-Enriched and Extra Gas Models—were determined by maximum likelihood. Each analytic metallicity distribution was treated as a probability distribution () which is normalized as . The functional forms of the probability distributions were identical to Eqs. 1, 2, and 5. The parameters were determined by maximizing the likelihood function .
| (6) | |||||
The index represents each star in the observed MDF. For computational simplicity, the most likely parameters were actually determined by minimizing the negative, logarithmic likelihood function .
| (7) | |||||
We initially estimated the model parameters that maximized likelihood using the Powell optimization method. Then we used a Metropolis-Hastings Markov Chain Monte Carlo algorithm to refine the fit and to estimate measurement uncertainties. The proposal distributions were normally distributed with for the effective yield parameters and for the and parameters. We conducted trials of the one-parameter Pristine Model after burn-in trials. We conducted trials of the two-parameter Pre-Enriched and Extra Gas Models after burn-in trials. The fiducial best-fitting parameters were taken to be the median values of all of the trials. Finally, we computed the two-sided 68.3% confidence interval. The upper error bar was the value that included 68.3% of the trials above the median. The lower error bar was the value that included 68.3% of the trials below the median.
The relative goodness of fit of one model over another may be quantified by the ratios of the maximum likelihoods. Once the parameters for one model are determined by maximizing , then the model that better describes the data will have a larger maximum likelihood, . In the following sections, we quantify the relative goodness of fit between two models as the logarithm of the ratio of their maximum likelihoods: .
The Pristine Model consists of only one free parameter, the effective yield. Both the Pre-Enriched and Extra Gas Models depend on two free parameters. In fact, the Pristine Model is a special case of both models ( for the Pre-Enriched Model and for the Extra Gas Model). Therefore, the Pristine Model will never be more likely than the Pre-Enriched or the Extra Gas Models. (Sculptor is an exception because we used the upper limit for in the calculation of for the Pre-Enriched Model.) However, the ratio may be close to zero, indicating that the extra free parameter does not add significantly to the description of the MDF.
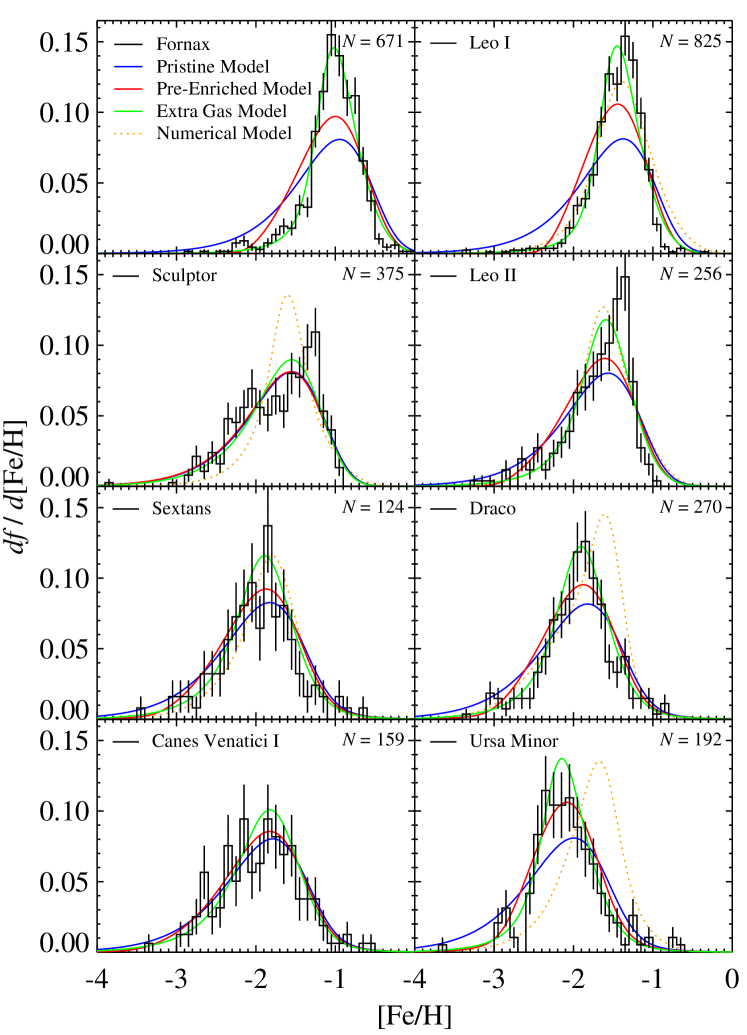
Figure 1 shows the observed metallicity distributions of each dSph with Poisson error bars. The histograms include measurements with estimated uncertainties on [Fe/H] less than 0.5 dex. Stars with larger uncertainties are excluded from the figures for clarity but not from the maximum likelihood fits. This restriction excludes fewer than 10 stars from the plots of the four most luminous dSphs. The lower stellar density in the four least luminous dSphs necessitated targeting fainter stars. Therefore, the fraction of stars excluded from the plots is between 9% and 12% in Sextans, Draco, Canes Venatici I, and Ursa Minor.
In order to approximate the widening caused by measurement error, the most likely analytic metallicity distributions have been smoothed. The smoothing kernel was a sum of Gaussians, where is the number of stars that passed the uncertainty cut. The width () of the Gaussian corresponded to the estimated uncertainty on the measurement of [Fe/H]. The smoothing kernel was normalized to preserve the area under the MDF. The kernel was constant with [Fe/H] because we have not observed a significant correlation between our estimates of and [Fe/H] except at the very lowest metallicities ().
Our conclusions are valid for the subset of the stellar populations observed. Most dSphs have radial metallicity gradients (see Sec. 5) such that the outermost stars are more metal-poor than the innermost stars. Our spectroscopic observations were centered on the dSphs in order to maximize the number of member stars. Consequently, our samples are more metal-rich and probably younger than the dSphs’ entire stellar populations. This effect is especially pertinent because some dSphs have been known to lose their outermost, oldest stars via tidal stripping by the MW (e.g., Carina, Majewski et al., 2000b). Consequently, our results are not applicable to the entire star formation histories of the dSphs, such as Leo I (Sohn et al., 2007), that may have shed significant fractions of their older, more metal-poor stars.
3.1. Fornax
Fornax is the most luminous of the dSphs that we consider, and it the most luminous intact dSph that orbits the MW. Sagittarius is more luminous, but the MW has tidally disrupted it (Ibata et al., 1994), and it may have been too luminous (Niederste-Ostholt et al., 2010) and too disky (Peñarrubia et al., 2010) to belong to the same class of galaxies as the surviving dwarf spheroidals. In agreement with the metallicity-luminosity relation for MW dwarf satellites (Mateo, 1998; Kirby et al., 2008b), Fornax also shows the highest peak [Fe/H] of all of the MDFs in Fig. 1. It has a median [Fe/H] of .
The Pristine and Pre-Enriched Models of chemical evolution poorly match the observed MDF. They do not allow a narrow peak, nor do they allow a sharp change in slope on the metal-poor end of the peak. Instead, the Extra Gas Model matches the observed MDF much better. The logarithm of the ratios of the maximum likelihood for the Extra Gas Model to the maximum likelihoods for the Pristine and Pre-Enriched models are and . The most likely parameter is , indicating a large departure from the Pristine Model. The fraction of stars formed from gas that fell into the system is , or in this case. The Extra Gas Model does very well at matching the symmetric peak, but the narrowness of the peak demands a large , which in turn causes an underestimate of the frequency of low-metallicity stars and an overestimate of the frequency of high-metallicity stars. If we have overestimated the measurement uncertainties on [Fe/H], then the model’s intrinsic, unconvolved peak could be wider, and could be smaller. That solution would fit the metal-poor tail and the steep metal-rich slope better.
The reasonable fit of the Extra Gas Model suggests the following extended star formation history for Fornax. Fornax began as a dark matter subhalo with a gas mass of of its final stellar mass. Pristine, zero-metallicity gas fell in gradually. The first stars in Fornax formed from the initial gas. The most massive of these stars exploded very quickly and enriched the interstellar medium (ISM) rapidly. The less massive, long-lived stars from early in Fornax’s history still populate the metal-poor tail today. As more gas fell in, star formation continued from the enriched gas. Because the timescale for Type II SN metal enrichment is short, most of the stars in Fornax formed after several generations of massive stars already enriched the ISM. As a result, most Fornax stars occupy the relatively metal-rich peak. This picture is qualitatively consistent with the conclusions of Orban et al. (2008). From color-magnitude diagrams, they deduced that 27% of Fornax stars are older than 10 Gyr, and 33% are younger than 5 Gyr. The old stars enriched the ISM for the majority population—intermediate-age and younger.
Battaglia et al. (2006) also observed a spectroscopic (Ca triplet-based) MDF of Fornax. Their sample extended beyond the tidal radius at 1.2 deg (Irwin & Hatzidimitriou, 1995). Our sample, which has a higher spatial density, extends to 16.3 arcmin. Battaglia et al.’s MDF within 24 arcmin shows the same qualitative shape as our MDF. The peak of their MDF is dex lower than the peak we measure, but they showed that Fornax’s [Fe/H] decreases beyond the radial extent of our data. Therefore, we expect that their more extended sample would be more metal-poor. In fact, they argued for the importance of gas outflows and infall for the star formation history of Fornax based not on the MDF but on the radial metallicity gradient and non-equilibrium kinematics.
3.2. Leo I
Leo I is the second most luminous intact dSph that orbits the MW. Accordingly, its peak [Fe/H] is lower than that of Fornax, with a median [Fe/H] of and an intrinsic dispersion of 0.36 dex. In a Ca triplet study, Gullieuszik et al. (2009) found that the mean metallicity is with a dispersion of 0.2 dex. The shape of the MDF resembles that of Fornax. The MDF has a narrow peak and a long metal-poor tail. The most likely extra gas parameter is . The presumed increase in gas supply was about as intense for Leo I as for Fornax. Again, the Pristine and Pre-Enriched Models are not good descriptions of the MDF: and . In terms of the star formation history proposed for Fornax, it seems that Leo I encountered about the same history, with a gradual increase in the gas supply that formed a small fraction of very metal-poor stars.
Leo I has the largest distance (254 kpc, Bellazzini et al., 2004) among the “classical” dSphs. If ram pressure stripping of gas plays a role in the star formation history of dwarf galaxies (e.g., Lin & Faber, 1983; Marcolini et al., 2003), then Leo I may have experienced less gas stripping than Sculptor or Fornax. Its highly elliptical orbit (Sohn et al., 2007; Mateo et al., 2008) allows Leo I to spend most of its time far from the MW center, allowing little time for strong tidal interactions. (When it does pass through the disk, however, it passes at high velocity.) In its lifetime, Leo I experienced a close perigalacticon just once (Mateo et al., 2008) or a few times (Sohn et al., 2007). The possibly less intense interaction with the MW could have preserved enough gas in Leo I for it to appear more like Fornax than Sculptor. The star formation histories deduced by Orban et al. (2008) support that idea. Their measured mean ages are 6–8 Gyr for Leo I and Fornax stars. However, Smecker-Hane et al. (2009) interpreted their Hubble Space Telescope Advanced Camera for Surveys (HST/ACS) imaging as evidence that the dominant population of Leo I is older than 10 Gyr. Our MDF gives only a qualitative suggestion that Leo I has experienced an extended star formation history, like Fornax, but the MDF alone is insufficient to quantify the mean stellar age.
The close perigalactic passes probably caused Leo I to lose stars in addition to gas. The stars most susceptible to tidal stripping are the outermost ones, which tend to be older and more metal-poor (see Sec. 5). Therefore, the observed MDF represents only the stars that Leo I still retains but not the complete star formation history of the galaxy.
Bosler et al. (2007) also measured the MDF for Leo I. They used their own calibration between the Ca triplet equivalent width and metallicity. They preferred to calibrate to [Ca/H], but they also derived MDFs in terms of [Fe/H]. The average [Ca/H] of their MDF . The average [Fe/H] of our MDF is . Bosler et al.’s sample reached a radial extent of at least 20 arcmin. The maximum extent of our sample is 14.4 arcmin, and it becomes sparsely sampled beyond 8 arcmin. The shape of Bosler et al.’s MDF is slightly asymmetric, with a metal-poor tail. Our MDF is highly asymmetric. The sparser sampling of their MDF (102 stars) compared to ours (866 stars) and the different measurement techniques may explain the different appearances.
3.3. Sculptor
We have already shown and analyzed the MDF for Sculptor (Paper I). We now place the MDF for Sculptor in the context of the MDFs for the other seven dSphs. Sculptor is the third most luminous intact dSph that orbits the MW. Its MDF might be expected to appear similar to Fornax and Leo I. However, Sculptor’s MDF is unlike any of the other seven dwarfs. None of the three models adequately describe the MDF.
First, the Pristine Model is too narrow to reproduce the broad [Fe/H] distribution, including a possible secondary peak at . Second, the Pre-Enriched Model might have been able to attain a better-fitting shape with a high enough . However, star S1020549 at , confirmed with high-resolution spectroscopy by Frebel et al. (2010a), demands a low initial enrichment. The upper limit on the initial enrichment that we derive is . Third, the most likely Extra Gas Model, with , is nearly identical to the Pristine model. Increasing would only narrow the MDF further.
A more proper nucleosynthetic treatment of iron would also better reproduce the MDF. Our analytic models assume instantaneous recycling, meaning that they do not incorporate a delay time between the births of stars and the return of enriched material into the ISM. In Paper IV (Kirby et al., 2010a), we show that a numerical model that relaxes the instantaneous recycling approximation results in a model MDF that better fits Sculptor’s observed MDF. However, even the more sophisticated model does not reproduce the apparent bimodality in the observed MDF (two peaks at and ).
The kinematic distribution of Sculptor’s stars may provide some insight on the bimodal MDF. Tolstoy et al. (2004) found that a two-component model best describes Sculptor. The stars separate into a centrally concentrated, metal-rich (), kinematically cold ( km/s) component and an extended, metal-poor (), kinematically warm ( km/s) component. A two-component model would do a much better job of representing our observed MDF of Sculptor. Combining any two of the three chemical evolution models with different peaks in [Fe/H] would generate a broad [Fe/H] distribution. However, we reserve a two-component analysis for a study that includes kinematic data.
The shape of the Sculptor MDF is very different from Fornax. Dekel & Silk (1986) suggested that galactic outflows play a large role in dSph formation. If Sculptor is less massive than Fornax, then winds from supernovae could have rapidly depleted Sculptor of the enriched gas necessary to create the more metal-rich stars. Therefore, the smooth shape of Sculptor’s MDF compared to the peaked shape of Fornax’s MDF may indicate that galactic outflows were more important than an increase in the gas supply in Sculptor’s history, whereas the reverse was true for Fornax.
3.4. Leo II
Leo II, Sextans, and Carina are the next most luminous dSphs that orbit the MW. Their luminosities are nearly indistinguishable within the error bars given by Irwin & Hatzidimitriou (1995). Leo II continues the trend established by Fornax and Leo I. It has a slightly lower median [Fe/H] () than that of Leo I. In accordance with its lower luminosity, its extra gas parameter is also lower than that of Leo I. The Pristine and Pre-Enriched models are still not good fits, but they are better representations of the MDF than for Fornax and Leo I, where the Extra Gas Model departs more severely from the Pristine Model ().
None of the models can reproduce the steep slope on the metal-rich side of the peak of Leo II. One possible solution to the abrupt drop in the frequency of metal-rich stars is a terminal wind. For example, a Closed Box Model that is truncated at some metallicity ( in this case) might produce an MDF similar to that of Leo II. Winnick (2003), among others, considered such a model in her description of the MDFs of Sculptor, Draco, and Ursa Minor.
Orban et al. (2008) reported similar mass-weighted average stellar ages for Fornax (7.4 Gyr), Leo I (6.4 Gyr), and Leo II (8.8 Gyr). They listed the mean stellar ages for Sculptor, Sextans, Ursa Minor, and Draco as larger than 10 Gyr, and Martin et al. (2008b) gave a mean age larger than 10 Gyr for Canes Venatici I. It is not surprising, then, that Fornax, Leo I, and Leo II—the younger dSphs—have similar MDFs. Furthermore, their younger mean ages may have allowed them extra time to accrete gas while they were forming stars. The increased supply of gas would have caused their peaks to be narrower than can be explained by a Leaky Box Model and would explain why the Extra Gas Model fits the best of the three chemical evolution models that we consider.
Finally, the distance to Leo II is nearly as great as Leo I. Siegel et al. (2010) gave a distance of 219 kpc. Although the orbit of Leo II is unknown, it could spend much of its time far outside of the range of disruptive gravitational interaction with the MW. It could have been spared gas stripping, which other dSphs like Sculptor or Sextans may have encountered. However, if Leo II does spend most of its time in a low density region of the Local Group, then it would likely not encounter the gas reservoir required to explain our interpretation of the MDF as indicative of an increase in the gas reservoir.
Bosler et al. (2007) observed the MDF of Leo II in addition to Leo I. They measured a mean [Ca/H] of , whereas we measure a mean [Fe/H] of . The radial extent of their survey was nearly the same as our survey. The shape of the Ca triplet MDF is at least qualitatively similar to our MDF. Both show an abrupt fall-off in the frequency of metal-rich stars. Bosler et al. interpreted the absence of metal-rich stars as evidence for rapid gas loss. Indeed, the effective metallicity yield that we measure () is too low to be explained by completely retained SN ejecta. The galaxy must have lost some gas, but the shape of the MDF also mandates that it accreted low-metallicity gas.
3.5. Sextans
Despite its similar luminosity to Leo II, Sextans displays a differently shaped MDF. It is more symmetric, with a shallower slope on the metal-rich side of the peak. Most strikingly, the median [Fe/H] for Sextans () is significantly lower than the median [Fe/H] for Leo II (). As a result, the most likely yield for the Extra Gas Model is much lower in Sextans () than in Leo II () despite Sextans’s similar extra gas parameter, . However, the Extra Gas Model may not be the best description of the MDF. Quantitatively, neither the Pre-Enriched nor the Extra Gas Model is significantly preferred: .
Sextans has a very large tidal radius ( arcmin, Irwin & Hatzidimitriou, 1995), which means that a complete MDF requires extensive radial sampling. Battaglia et al. (2010) observed the Ca triplet-based MDF of Sextans to very large distance from the dSph center. Their sample extended to whereas our sample extends to only 21.4 arcmin. Their more complete MDF is more metal-poor than ours because they detected a radial gradient of . Our sample is too centrally concentrated to detect a gradient. Battaglia et al. also found that the shape of the MDF changes as a function of radius. Sextans appears to have two metallicity populations: a metal-rich population within and a metal-poor population beyond . Therefore, our results should be interpreted as applicable only to the innermost population, which presumably formed more recently than the outer population.
3.6. Draco
Draco, Canes Venatici I, and Ursa Minor form the next group of dSphs with indistinguishable luminosities. The MDFs of these three dSphs and Sextans are broadly related. Their mean [Fe/H] values all lie between and , and their MDFs seem to be more symmetric than the more luminous dSphs.
The MDF of Draco is similar to that of Sextans. Most of the shape parameters (mean, median, dispersion) for the two MDFs are nearly identical. In particular, the observed MDF is more peaked than the Pristine Model, and it has a metal-poor tail. Formally, the Extra Gas Model is a better fit to Draco than the other models ( and ). On the other hand, the Pre-Enriched Model fits Sextans slightly better than the Extra Gas Model. However, Draco is better sampled than Sextans, with more than twice as many stars with measurements of [Fe/H]. As a result, the most likely chemical evolution parameters for Draco are more secure than for Sextans.
Winnick (2003) also observed and modeled the MDFs for Draco, Sculptor, and Ursa Minor. Her analytic models included abrupt or continuous gas loss with initially pristine or pre-enriched gas. These single-component models did not fit any of the three MDFs very well, but a two-component model for Draco did work well. The two components were two Leaky Box Models with pre-enrichment. The models reproduced the Draco MDF shape very well. However, the shape of Winnick’s Draco MDF was different from ours. Her MDF had two peaks. The different shape results from different measurement techniques and different radial sampling (a maximum of arcmin for Winnick’s and 60 arcmin for our sample). Nonetheless, the two-component experiment demonstrates that an accurate description of some MDFs (especially Sculptor) may require multi-component models.
3.7. Canes Venatici I
The MDF of Canes Venatici I resembles a normal distribution more than any of the other seven dwarfs. Although it has a slight metal-poor tail, it is nearly symmetric. Canes Venatici I shows the least preference for the Extra Gas Model of all the dSphs in Fig. 1 except for Sculptor. The most likely extra gas parameter is , and the preference of the Extra Gas Model over the Pristine Model is slight ().
Overall, the MDF of Canes Venatici I fits a Leaky Box Model best of all the dSphs shown here. It is the only dSph in our sample that fits the Pre-Enriched Model significantly better than the Extra Gas Model (). The dSph’s large distance (210 kpc, Kuehn et al., 2008) would make it less susceptible to gas accretion from the MW than the other dSphs in its luminosity class, Draco and Ursa Minor. Continuous gas outflow—from SN winds, for example—would not drastically affect the shape of the MDF. It would instead decrease the effective yield and cause a low peak [Fe/H], which is observed.
3.8. Ursa Minor
The luminosity of Ursa Minor is within a factor of two of Sextans. Orban et al. (2008) derived identical star formation histories for both dSphs: no stars younger than 12 Gyr. Ursa Minor, with the slightly lower luminosity, has a correspondingly lower median [Fe/H]: compared to . The most likely Extra Gas Model indicates intense gas inflow over the lifetime of star formation, despite the lack of an obvious G dwarf problem. The parameter for the Extra Gas Model is for Ursa Minor compared to for Sextans.
None of the models accurately reproduce the sudden absence of metal-poor stars at . Helmi et al. (2006) invoked the Pre-Enriched Model as a possible explanation for the apparent dearth of metal-poor stars in Fornax, Sculptor, Carina, and Sextans. Since then, extremely metal-poor stars have been discovered in dSphs (Kirby et al., 2008b, 2009; Geha et al., 2009; Cohen & Huang, 2009, 2010; Frebel et al., 2010a, b; Simon et al., 2010a, b; Norris et al., 2010a, b; Starkenburg et al., 2010; Tafelmeyer et al., 2010). These discoveries do not preclude pre-enrichment in all dSphs. In fact, the most likely initial metallicity for the Pre-Enriched Model for Ursa Minor is . However, Cohen & Huang (2010) have discovered two stars with in Ursa Minor using high-resolution spectra. Our sample includes seven such stars, including one with .
On closer inspection, Ursa Minor is an outlier from its luminosity class. Whereas all of the other dSphs show at least a hint of a metal-poor tail, Ursa Minor shows a metal-rich tail. Ursa Minor’s large negative radial velocity ( km s-1) rules out significant contamination from metal-rich Galactic stars. The Pristine Model can explain neither the absence of a metal-poor tail nor the existence of a metal-rich tail. The most likely Pre-Enriched Model is too symmetric. The model with the sharpest peak is the Extra Gas Model with a very large and a very low yield. The most likely parameters are and , the most extreme of all eight dSphs.
4. Numerical Chemical Evolution Models
We compare the observed MDFs of six galaxies (Leo I, Sculptor, Leo II, Sextans, Draco, and Ursa Minor) to predictions of detailed numerical models of chemical evolution in addition to the analytic models. Figure 1 includes the MDFs from the numerical models as dotted lines. The model MDFs have been convolved with the same function as the analytic models to approximate observational uncertainty (Sec. 3). In the adopted numerical models (Lanfranchi & Matteucci, 2003, 2004), the evolution of each galaxy is mainly controlled by the assumptions regarding the star formation (SF) history, SF efficiency, and galactic wind. All models adopt an infall of pristine gas, low star formation rate (SFR), and high galactic wind efficiency. The low SFR and the high efficiency of the wind give rise to a peak in the MDFs at low [Fe/H] (approximately between to ) whereas the long infall timescale of pristine gas allows the models to form a low number of metal-poor stars, similar to the observed frequency.
In contrast to the analytic models, the numerical models were not adjusted to fit the present data. The predictions are the same as in previous papers, in which the models were adjusted to better match different observational data. The numerical models for Ursa Minor and Draco (Lanfranchi & Matteucci, 2007) were adjusted to approximate the observed MDFs based on photometric metallicities (Bellazzini et al., 2002), whereas the models for Leo I and II (Lanfranchi & Matteucci, 2010) were calibrated to match the [Fe/H] distribution inferred from Ca triplet lines (Koch et al., 2007a, b; Bosler et al., 2007; Gullieuszik et al., 2009). The predictions for Sextans and Sculptor are true predictions; they have not been calibrated to match any observational data because they were published before data were available (Lanfranchi & Matteucci, 2004). We can use the comparisons to infer what modifications should be made in the models, especially those regarding SF and wind efficiencies.
The differences in shape between the predicted and observed MDFs may be described in terms of how the modeled SF history could be changed to achieve a better fit. Higher SFRs seem to be necessary in the case of Leo I and Leo II because these two models exhibit MDF peaks dex lower than observed. The model of Leo I is characterized by two long episodes of SF at 14 Gyr and 9 Gyr ago, lasting 5 Gyr and 7 Gyr respectively, with a low efficiency () and by the occurrence of a very intense galactic wind with a rate 9 times higher than the SFR (). On the other hand, the Leo II model adopts lower SF and wind efficiencies ( and ) and just one long episode of SF at 14 Gyr ago, lasting 7 Gyr. Modifying the duration and epoch of the SF episodes would not change the predictions substantially, whereas the wind efficiency influences the position of the peak in the MDFs and, most significantly, the relative number of metal-rich stars. Because the shapes of the predicted MDFs are similar to the observations, SF efficiency is the only parameter that requires adjustment. Increasing might lead to a better fit in both cases.
For Ursa Minor and Draco, the predicted MDFs are 0.3–0.5 dex more metal-rich than the observed MDFs. These two galaxies are characterized by short, older periods of SF (4 Gyr and 3 Gyr, respectively) compared to the other dSphs and by the lowest SF efficiencies ( and , respectively) among the six models analyzed. It seems that these values need to be further decreased to match the observations, especially for Ursa Minor. This galaxy also exhibits a more extended high metallicity tail, which could be reproduced by a lower galactic wind efficiency. To prevent the subsequent increase in the peak [Fe/H], the SFR should also be decreased. In contrast to Ursa Minor, the prediction for Draco fits the number of metal-poor stars well but overestimates the peak of the MDF and the number of high metallicity stars. The discrepancies are probably consequences of low wind efficiency. A higher wind efficiency would decrease the SFR after the onset of the wind, lowering the number of metal-rich stars born. Such a model would better match the data by creating an MDF with a peak at lower [Fe/H] and with fewer metal-rich stars.
The predicted MDF of Sextans reproduces the observed data well. The model adopts a long episode of SF (longer than 4 Gyr) with low rates and an intense galactic wind ( and ), giving rise to a main stellar population with low [Fe/H] ( dex). There seems to be an underprediction of the frequency of metal-poor stars, probably due to the extended infall of gas and to the prolonged SF.
For Sculptor, as in the case of analytic models, the prediction does not fit the observed MDF. The observations show a distribution much broader than the predictions. As discussed in Sec. 3.3, the cause of the broad MDF could be two different stellar population with different metallicities and spatial extents. Lanfranchi & Matteucci’s model cannot separate the two different populations because it uses only one zone. Instead, the different populations may be the result of different SFRs in the central and in the outer regions, perhaps due to different gas densities. The result would be different chemical enrichment and different mean metallicities in each region. We explore this idea more generally in the next section.
5. Radial Metallicity Distributions
Galaxies often show radial metallicity gradients (e.g., Mehlert et al., 2003). We discuss three processes that may be responsible for gradients. (1) The star formation rate in a galaxy depends on the gas density (Schmidt, 1959; Kennicutt, 1983), and the gas density increases toward the bottom of the gravitational potential well in the center of the galaxy. Therefore, the center of the galaxy may experience the highest star formation intensity and consequently may show the highest mean metallicity. (2) MW satellite galaxies may lose gas through tidal or ram pressure stripping (Lin & Faber, 1983) from the MW. The gas that lies far from the center is more loosely bound to the dSph than gas that lies at the center. Therefore, gas leaves the dSph from the outside in. For dSphs affected by gas loss, later episodes of star formation occur closer to the center of the galaxy. Because later episodes of star formation occur from more metal-rich gas, gas loss creates a stellar metallicity gradient, with the center of the dSph being more metal-rich. This scenario requires star formation to occur during the process of gas loss. (3) The angular momentum of accreted, low-metallicity gas will not allow the gas to reach the center of the galaxy. If stars form from this gas, they will be metal-poor and mostly confined to large radius. Therefore, gas accretion can also generate radial metallicity gradients.
| dSph | Distance | |||||
|---|---|---|---|---|---|---|
| (kpc) | (arcmin) | (pc) | (dex deg-1) | (dex kpc-1) | (dex) | |
| Fornax | 139 | 13.7 | 550 | |||
| Leo I | 254 | 3.3 | 240 | |||
| Sculptor | 85 | 5.8 | 140 | |||
| Leo II | 219 | 2.9 | 180 | |||
| Sextans | 95 | 16.6 | 460 | |||
| Draco | 92 | 9.0 | 240 | |||
| Canes Venatici I | 210 | 8.9aaHalf-light radius instead of core radius. | 540aaHalf-light radius instead of core radius. | |||
| Ursa Minor | 69 | 15.8 | 320 |
References. — Distances adopted from Rizzi et al. (2007) for Fornax, Bellazzini et al. (2004) for Leo I, Pietrzyński et al. (2008) for Sculptor, Siegel et al. (2010) for Leo II, Lee et al. (2003) for Sextans, Bellazzini et al. (2002) for Draco, Kuehn et al. (2008) for Canes Venatici I, and Mighell & Burke (1999) for Ursa Minor. Core radii adopted from Irwin & Hatzidimitriou (1995) except for Canes Venatici I, for which we adopt the half-light radius derived by Martin et al. (2008a).
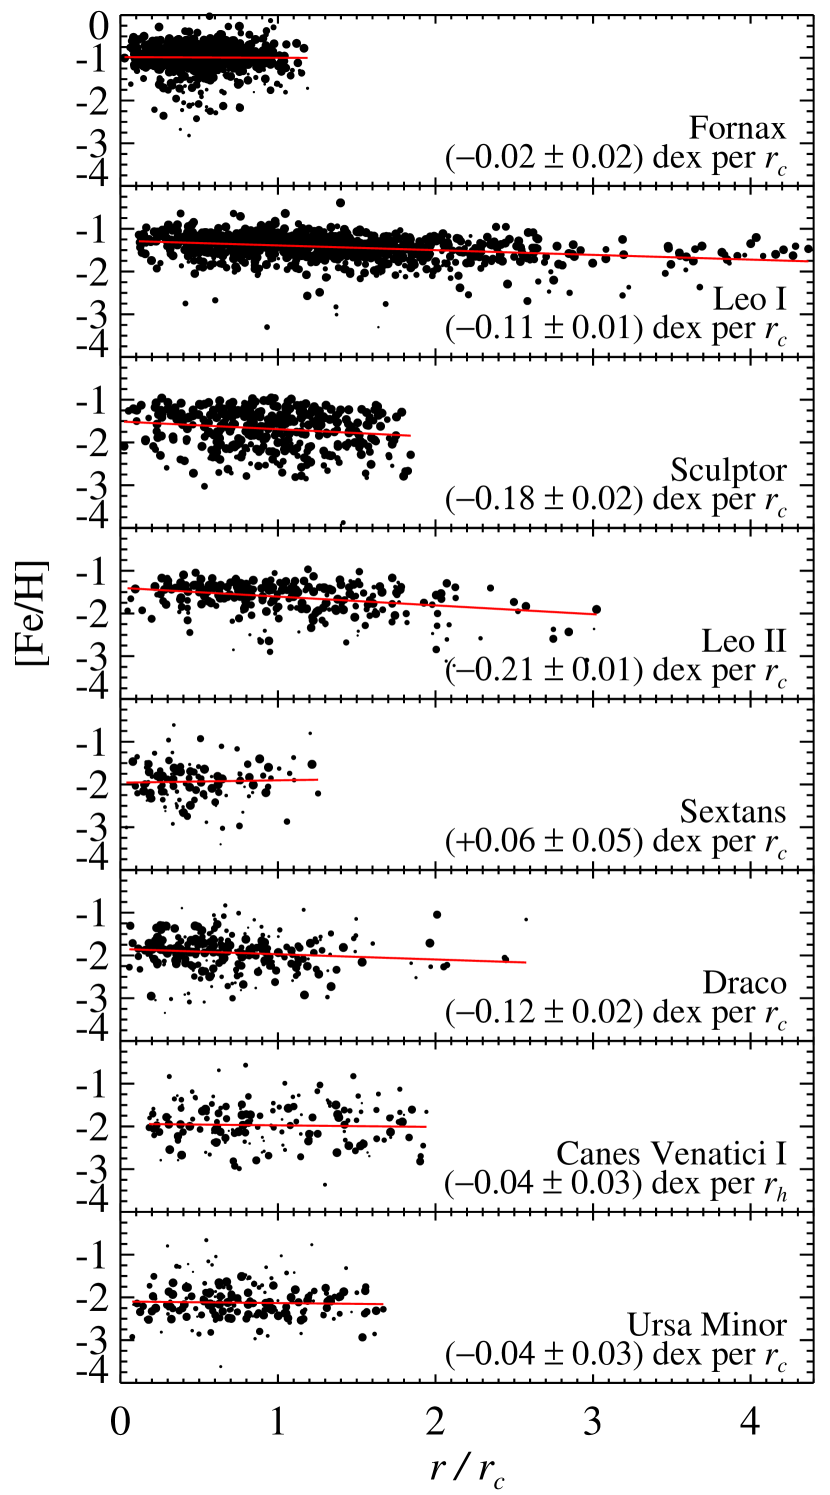
Figure 2 shows the radial distributions of [Fe/H]. The -axis gives the distance from the dSph center in units of the core radius from a King profile fit (Irwin & Hatzidimitriou, 1995) or half-light radius for Canes Venatici I (Martin et al., 2008b). The lines are the least squares linear fits. Table 5 gives the slopes of these lines in terms of angular distance from the dSph center in degrees, projected distance from the dSph in kpc, and projected distance in core radii. Four dSphs, Leo I, Sculptor, Leo II, and Draco, show significantly negative slopes. The slopes of the other four dSphs are consistent with zero or nearly consistent with zero.
The eight dSphs in our sample are insulated against Galactic contamination by their Galactic latitudes (), radial velocities (), or both. Based on the velocity distribution of stars excluded by radial velocity, we estimate that fewer than 5% of the stars are Galactic contaminants even in the worst cases (Sextans and Draco). However, some Galactic halo stars may still contaminate our samples. Schörck et al. (2009) show that the local Galactic halo MDF is broad with a peak at and a secondary peak at . We would not necessarily measure the correct metallicity for these stars because we assume the same distance modulus for all stars in a given dSph sample. Halo stars could lie in front of or behind the dSphs. The distance modulus affects the metallicity measurements through the photometric determination of surface gravity and partially photometric determination of effective temperature. We estimate that the intrinsic breadth of the halo MDF coupled with the increased measurement errors would cause halo stars to appear uniformly distributed in the range . Fornax and Leo I contain many stars at higher metallicities. Halo contamination would cause us to infer a more negative metallicity gradient for those two dSphs because the ratio of dSph to halo stars decreases with radius. However, the radial velocity distributions of stars in the Fornax and Leo I slitmasks suggest contamination at the level of 1% or less. Contamination in the other dSphs would tend to flatten the measured gradients and reduce their significance because the contaminating population has roughly the same [Fe/H] distribution as the average distribution for the entire dSph. However, we reiterate that the contamination is small.
We might have expected that Fornax has a strong radial gradient due to its longer star formation history (Orban et al., 2008), with successive generations becoming more and more centrally concentrated as the gas was depleted from the outskirts. However, the slope of the best-fit line is consistent with zero. Battaglia et al. (2006) did find a radial metallicity gradient in Fornax. Their sample extended beyond the tidal radius whereas our sample reaches to only about the core radius. Within the radial bounds of our sample, Battaglia et al.’s measurements do not show evidence for a radial gradient, either. Therefore, our sample is too limited in angular extent to draw definitive conclusions on the presence of a radial metallicity gradient.
Sextans, Canes Venatici I, and Ursa Minor also show insignificant slopes of [Fe/H] with radius within our centrally restricted samples. The lack of gradients possibly indicates short star formation durations. Gradients in [Fe/H] may occur because gas leaves the shallower potential in the dwarf galaxy’s outskirts more easily than it leaves the center. Therefore, late star formation—from gas that had more time to be enriched—occurs only in the dSph’s center. However, if the star formation occurs over a period shorter than the gas redistribution timescale, then the dSph will show no [Fe/H] gradient. Our measurements of flat [Fe/H] radial distributions are consistent with a short star formation duration. Note, however, that Marcolini et al. (2008) predicted that metallicity gradients are strongest when stars have been forming for 1 Gyr. After 1 Gyr, metals dispersed by SN winds enrich the outer parts of the galaxy as much as the inner parts. Therefore, our interpretation of the shallow slopes is valid only if star formation in these dSphs spanned a period significantly shorter than 1 Gyr. Both photometry and detailed abundances (see Paper IV) indicate that the SF durations were indeed that brief.
Winnick (2003) has already arrived at some of these conclusions with her Ca triplet MDFs of Sculptor, Draco, and Ursa Minor. She detected radial metallicity gradients in Sculptor and Draco, but not in Ursa Minor. She also found that the Leaky Box Model of chemical evolution was a poor fit to the MDF of Ursa Minor, and she surmised that star formation in Ursa Minor was particularly quick and efficient.
6. Metallicity Trends with Luminosity
So far, we have hinted at the possible role of total dwarf galaxy luminosity in determining its chemical evolution and metallicity distribution. In this section, we explicitly quantify trends of the MDF properties with luminosity. These properties include the mean metallicity, the intrinsic width of the MDF, and the slopes of the radial gradients.
| dSph | aaNumber of member stars, confirmed by radial velocity, with measured [Fe/H]. | bbMean [Fe/H] weighted by the inverse square of estimated measurement uncertainties. | ccThe number in parentheses is the intrinsic [Fe/H] spread corrected for measurement uncertainties. | Median | m.a.d.ddMedian absolute deviation. | IQReeInterquartile range. | Skewness | KurtosisffActually the excess kurtosis, or 3 less than the raw kurtosis. This quantifies the degree to which the distribution is more sharply peaked than a Gaussian. | |
|---|---|---|---|---|---|---|---|---|---|
| Fornax | 675 | ||||||||
| Leo I | 827 | ||||||||
| Sculptor | 376 | ||||||||
| Leo II | 258 | ||||||||
| Sextans | 141 | ||||||||
| Draco | 298 | ||||||||
| Canes Venatici I | 174 | ||||||||
| Ursa Minor | 212 | ||||||||
| Leo T | 18 | ||||||||
| Hercules | 21 | ||||||||
| Ursa Major I | 28 | ||||||||
| Leo IV | 12 | ||||||||
| Canes Venatici II | 15 | ||||||||
| Ursa Major II | 9 | ||||||||
| Coma Berenices | 18 |
Table 6 gives a summary of the MDFs for 15 dSphs: the 8 dSphs discussed in this article and the 7 additional dSphs discussed by Kirby et al. (2008b, Leo T, Hercules, Ursa Major I and II, Leo IV, Canes Venatici II, and Coma Berenices). The MDFs of these 7 dSphs have been updated following the changes described in Papers I and II. The table shows the number of stars we analyze, luminosity, and different descriptions of the average [Fe/H] and width of the [Fe/H] distribution. The mean [Fe/H] is weighted by the inverse square of the errors. The MDF width is given both in terms of the standard deviation uncorrected for measurement error as well as the width reduced by the amount of inflation caused by the estimated measurement uncertainties. We estimate the intrinsic spread by solving the following equation:
| (8) |
The value of for each dwarf is given in parentheses in the column labeled in Table 6. The last five columns show different shape parameters. The median identifies the peak of the MDF better than the mean. The median absolute deviation (m.a.d.) and interquartile range (IQR) are different measures of the width of the MDF. Skewness quantifies the asymmetry of the MDF, with negative values indicating a metal-poor tail. Kurtosis quantifies by how much the MDF is peaked. Positive kurtosis indicates that the distribution is more sharply peaked than a Gaussian.
6.1. Luminosity-Metallicity Relation
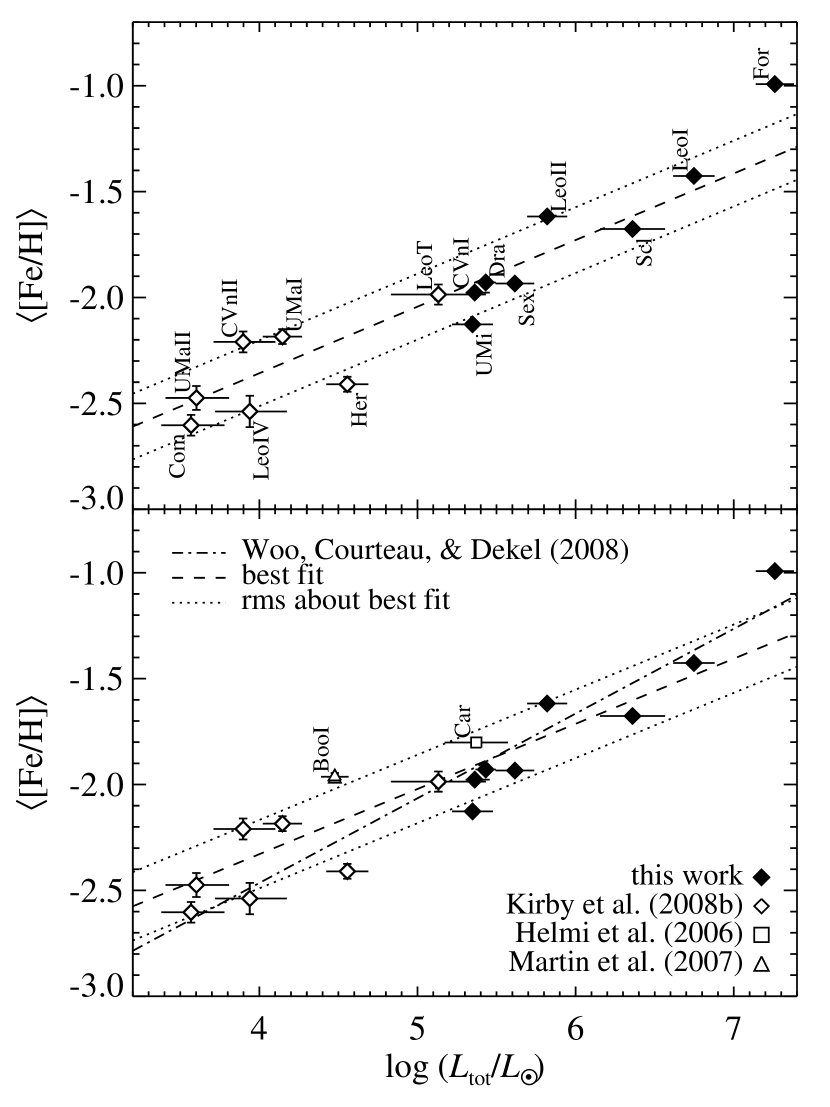
The average metallicity of more luminous dwarf galaxies is larger than for fainter dwarf galaxies. The relation between gas phase oxygen abundances and galaxy luminosity is particularly well-studied (e.g., Skillman et al., 1989; Vaduvescu et al., 2007). Others have studied the more basic relation—the fundamental line—for dwarf galaxies (Prada & Burkert, 2002; Woo et al., 2008). Kirby et al. (2008b) determined the luminosity-metallicity relation (LZR) based on medium resolution spectral synthesis of stars in eight faint dSphs combined with Ca triplet metallicity measurements for more luminous dSphs. Since then, our technique for measuring metallicities has been revised (Papers I and II), and we have calculated synthesis-based metallicities for the more luminous dSphs. The top panel of Fig. 3 shows the LZR for dwarf galaxies with metallicity measurements based only on spectral synthesis.
The following equation describes the orthogonal regression fit accounting for errors in both luminosity and [Fe/H] (Akritas & Bershady, 1996), where the errors are the standard deviations of the slope and intercept:
| (9) |
The linear Pearson correlation coefficient for the data is 0.95, indicating a highly significant correlation.
By including [Fe/H] measurements for other dwarfs, we may refine the fit at the cost of losing the homogeneity of the abundance analysis. We add Ca triplet-based measurements for Carina (Helmi et al., 2006) and Boötes I (Martin et al., 2007). The bottom panel of Fig. 3 shows the result. This LZR now includes all MW dwarfs less luminous than Sagittarius except the least luminous objects (Willman 1, Willman et al. 2005; Segue 1, Belokurov et al. 2007; Segue 2, Belokurov et al. 2009; Boötes II, Walsh et al. 2007; Leo V, Belokurov et al. 2008; Pisces I, Watkins et al. 2009; and Pisces II and Segue 3, Belokurov et al. 2010) because they have only a few RGB stars, and their average metallicities are not well-determined. For the most part, even their luminosities are uncertain by factors of two or more (Martin et al., 2008a). As expected, the addition of two galaxies to the existing 15 hardly changes the LZR:
| (10) |
The linear Pearson correlation coefficient for the data is 0.93.
A straight line may be an overly simplistic model to the luminosity-metallicity relation. The dwarfs with seem to lie along a steeper line than the less luminous dwarfs. In order to better show that difference, the dot-dashed line in Fig. 3 is the best-fit relation of Woo, Courteau, & Dekel (2008). They studied scaling relations among 41 luminous Local Group dwarf galaxies. They found the following relation between metal-fraction and stellar mass for dwarf ellipticals:
| (11) |
Assuming, as Woo et al. did, that and (Anders & Grevesse, 1989) and that (the average value for their 18 dEs), we replace Eq. 11 with
| (12) |
This is the dot-dashed line in Fig. 3. It is an excellent fit to the luminous half of those 17 dwarfs. This is not surprising because many of those dwarfs were included in Woo et al.’s sample. However, the fit is not good to the dwarfs with .
Despite the possible deviation from the LZR at low luminosities and low metallicities, the LZR is continuous—if not linear—from ultra-faint dSphs to massive elliptical galaxies. Tremonti et al. (2004) demonstrated the tight correlation between gas phase metallicity and stellar mass over a wide range of masses. They deduced that low mass galaxies preferentially lose metals to galactic winds (Larson, 1974b). Their conclusion is also consistent with the stellar metallicity-stellar mass relation, such as derived from spectrophotometric indices (e.g., Mendel et al., 2009). The continuity of the relation from massive ellipticals to galaxies with the luminosity of Coma Berenices () may indicate that the main variable that dictates the amount of metals galaxies lose is galaxy mass.
6.2. Intrinsic [Fe/H] Spreads

We expect the mean metallicity of a dSph to vary with luminosity because the presence of many stars implies a history of many SNe to enrich the gas. The more complex enrichment histories of the more luminous dSphs motivate us to examine how the width of the MDF varies with luminosity.
Figure 4 shows the trend of with dwarf galaxy luminosity. Intrinsic [Fe/H] spreads are larger in less luminous dwarfs. The least-squares fit is
| (13) |
The linear Pearson correlation coefficient for the data is . The coefficient is negative because is anticorrelated with luminosity. Norris et al. (2010a) also quantified the luminosity-metallicity spread-luminosity relation. They suggested that an increase in at low luminosity indicates inhomogeneous and stochastic chemical enrichment in the lowest mass galaxies.
However, [Fe/H] is a logarithmic quantity. In order to better visualize the physical metallicity spreads, we recast the top panel of Fig. 4 in terms of the linear metal fraction: . The bottom panel of Figure 4 shows the logarithm of versus metallicity. The least-squares linear fit is
| (14) |
The linear Pearson correlation coefficient for the data is , which indicates that the luminosity- spread relation is much more significant than the luminosity-[Fe/H] spread relation.
Note that is not the same as . It is possible to approximate as . Instead, we translated all values of logarithmic [Fe/H] into linear and recalculated in analogy to Eq. 8. We estimated through standard error propagation: .
The linear representation of metallicity spread shows that the physical (linear) ranges of metallicity are somewhat similar in many dwarfs. Nine of the 15 dwarf galaxies cluster around . More interestingly, the four most luminous dwarfs, Fornax, Leo I, Sculptor, and Leo II, have .
These trends might be explained by the differences in star formation duration across dwarfs. In chemical evolution models, the width of the MDF depends, at least in part, on the effective yield . As an example, the width of the MDF in the Pristine Model (Eq. 2) is . For the four most luminous dSphs, the best-fit yields are for all three chemical evolution models. For the next four dSphs in order of luminosity, the best-fit yields are for all three models. The effective yield encompasses gas outflow as well as SN iron yields. (See Table 3 for a list of the best-fit yields.) Therefore, the luminosity-metallicity spread relation may indicate that the more luminous dSphs more effectively retained their gas than 1the less luminous dwarf galaxies. As a result, the more luminous dSphs could have maintained star formation for a longer duration. The color-magnitude diagrams of Fornax, Leo I, and Leo II show that they did indeed experience star formation more recently than 10 Gyr (e.g., Mighell & Rich, 1996; Buonanno et al., 1999; Smecker-Hane et al., 2009), unlike the other dSphs. Our results from the [/Fe] distributions (Paper IV) also support star formation durations longer than 1 Gyr for the four more luminous dSphs and shorter than 1 Gyr for the four less luminous dSphs.
6.3. Radial Gradients
The radial gradients of the eight dSphs do not separate neatly into more and less luminous categories. We might reasonably guess that the more luminous galaxies, which experienced more prolonged star formation, would show steeper radial gradients. However, the most luminous dSph in our sample, Fornax, does not show a radial gradient within the bounds of our data. Furthermore, Sculptor and Leo II show very strong radial gradients even though they are near the middle of the luminosity range of our sample of dSphs. The explanation may relate to Sculptor’s kinematic complexity (Tolstoy et al., 2004; Battaglia et al., 2008a; Walker et al., 2007, 2009). Future studies may also reveal multiple kinematic populations in Leo II to accompany its strong radial gradient.
Spolaor et al. (2009) measured the radial gradients of more luminous () galaxies in the Fornax and Virgo clusters. The most luminous galaxy in our sample is the Fornax dSph (). Spolaor et al. found that the magnitude of radial gradients decreases with decreasing luminosity until , where the radial gradient vanishes. The trend with velocity dispersion is stronger than with luminosity. The gradients disappear by , much larger than the velocity dispersion of any galaxy in our sample. Therefore, it is notable that half of the galaxies in our sample (Leo I and II, Sculptor, and Draco) display radial gradients. We conclude that the radial gradients of MW dSphs do not obey the tight relation seen for more luminous galaxies. Instead, we speculate that the particular star formation histories influenced by particular interactions with the MW determine the presence or absence of radial metallicity gradients.
At odds with Spolaor et al., Koleva et al. (2009a) found no trend between radial metallicity gradients and galaxy mass for galaxies in the Fornax cluster and nearby groups. Koleva et al. (2009b) suggested possible reasons for the discrepancy, but they did not find any explanations satisfactory. If Koleva et al.’s result holds, then it would not be surprising that our sample also does not show a trend between gradients and luminosity. Regardless, our samples are too centrally concentrated to probe the full extent of the radial gradients for most of the dSphs. Other samples (e.g., Battaglia et al., 2006, 2010; Walker et al., 2009) have better addressed this issue.
7. Chemical Evolution Trends with Galaxy Properties
| Pristine Model | Pre-Enriched Model | Extra Gas Model | |||||||
|---|---|---|---|---|---|---|---|---|---|
| dSph | () | () | () | ||||||
| Fornax | |||||||||
| Leo I | |||||||||
| Sculptor | |||||||||
| Leo II | |||||||||
| Sextans | |||||||||
| Draco | |||||||||
| Can. Ven. I | |||||||||
| Ursa Minor | |||||||||

The chemical evolution model fits more directly relate to the star formation histories of the dSphs than the bulk metallicity properties. However, the derived quantities ( for the Pristine Model, and for the Pre-Enriched Model, and and for the Extra Gas Model) are not direct observables. In calculating them, we have assumed that the models are good descriptions of the MDFs. Although we have estimated the relative goodness of fit between the Simple and Extra Gas Models, we have not estimated the absolute goodness of fit. Thus, the results of this section should be viewed as more directly relevant to the star formation histories whereas the results of the previous section should be viewed as more directly observable and therefore more confident.
Table 3 presents the most likely chemical evolution model parameters for each dSph along with the ratios of the maximum likelihoods. The two-sided uncertainties represent the 68.3% confidence interval (see Sec. 3). Single error bars are given for the yields because the upper error bars are equal to the lower error bars in all cases. Many of the Monte Carlo trials for the Pre-Enriched Model of Sculptor reached to very low values of . The formal value for the lower error bar is 14 dex. Therefore, we treat the calculated value of as an upper limit.
Fig. 5 shows the most likely parameters from Table 3 plotted against the luminosity, line-of-sight velocity dispersion, projected half-light radius, and Galactocentric distance. The most obvious observation is that the yield monotonically increases with dSph luminosity for the six most luminous dSphs. That increase is a reflection of the increasing average metallicity and increasing metallicity spread. For the remaining model parameters, the dSphs may be separated into two broad categories: more luminous, infall-dominated (Fornax, Leo I, and Leo II) and less luminous, outflow-dominated (Sextans, Ursa Minor, Draco, and Canes Venatici I).
The more luminous, infall-dominated dSphs are more consistent with the Extra Gas Model than the Pristine Model or the Pre-Enriched Model. Even so, the most likely initial metallicities for the Pre-Enriched Model are unreasonably large. It would be strange for Fornax and Leo I to have been born with a much more metal-rich ISM than other dSphs. There is no evidence that they formed their first stars long enough after the less luminous dSphs for the intergalactic medium to have become so enriched. The most likely Extra Gas Models have , indicating that gas infall significantly affected star formation over the lifetime of the galaxy.
The less luminous, outflow-dominated dSphs show similar, low effective yields () compared to the more luminous dSphs, regardless of the chemical evolution model considered. It is possible that the average SN yields of the least luminous dwarf galaxies are anomalous because the IMF was stochastically sampled in tiny stellar systems (e.g., Koch et al., 2008). A more likely explanation for the low values of is that gas outflow reduced the effective yield below the value achieved by SN ejecta. The low masses of the less luminous dSphs rendered them unable to retain their gas. Gas flowed out of the galaxy from internal mechanisms, such as SN winds, and external mechanisms, such as ram pressure stripping. The outflows prevented the MDFs from achieving a high and caused the MDFs to be more symmetric than the more luminous dSphs.
However, a curious dynamical property of dSphs may undermine this star formation hypothesis. The dwarf galaxies of the Local Group less luminous than Fornax seem to inhabit dark matter halos of similar mass (Mateo, 1998; Peñarrubia et al., 2008; Strigari et al., 2008; Walker et al., 2009). Although their stellar masses span nearly five orders of magnitude, their dominant dark matter masses are the same. As a result, gas outflow from the center of, for example, Canes Venatici I should be no stronger than from Fornax. However, the masses are poorly constrained beyond the half-light radius. It is possible that dSph mass profiles diverge at large radii, allowing blown-out gas to return to the more luminous galaxies with possibly larger total mass. However, dynamical tracers beyond 300 pc are sparse, especially for the less luminous dSphs. Consequently, innovations in measuring the total mass of dSphs (such as Wolf et al.’s 2010 anisotropy-independent mass estimates or Amorisco & Evans’s 2010 phase space models) will be necessary to better constrain the return fraction of blown-out gas.
We have refrained from classifying Sculptor into one of these two broad categories because none of the star formation models is a good fit to its MDF. It is possible that the hierarchical assembly of two dSphs has brought together a superposition of distinct stellar populations. Tolstoy et al. (2004) recognized this possibility in their finding of two distinct kinematic and metallicity components in Sculptor. Hierarchical assembly almost certainly plays some role in the early formation of dSphs (e.g., Diemand, Kuhlen, & Madau, 2007). However, this process does not dominate the shapes of the MDFs for all dSphs. For example, Fornax and Leo I do not show evidence of distinct metallicity peaks. If Fornax or Leo I accreted so many “sub-dwarfs” that the metallicity peaks are no longer distinct, then we would not expect the average metallicities of Fornax and Leo I to be so high and the MDF widths to be as narrow as they are. Instead, we conclude that Sculptor is unique among these eight dSphs in showing the most obvious sign of the superposition of two separate stellar populations.
With one exception, the only parameter to show a trend with any galaxy property is the yield, which is correlated with luminosity. The other parameters, and , do not show obvious trends with luminosity, and no parameter shows a trend with velocity dispersion, half-light radius, or Galactocentric distance. The exception is that the dSphs with higher seem to require larger values of , or more extra gas. It would seem that the greater gravitational potentials of the galaxies with higher attracted more external gas to power star formation. However, we caution against this interpretation because the mass profiles of dSphs are complex, and does not completely represent the ability of a dSph to attract additional gas. Instead, we regard the trend of with as tenuous at best. As an example, for Leo I and Sculptor are identical, yet they have highly discrepant values of .
The chemical evolution models we have considered are overly simplistic. In reality, the dSphs probably have complex star formation histories. A steady star formation rate with instantaneous mixing and instantaneous recycling does not completely describe the MDF of any dSph. Even our Extra Gas Model assumes a contrived functional form of the gas increase (Eq. 3). Some process, such as interaction with the MW, must cause gas to fall into the galaxy and trigger the star formation rate to increase one or many times over the dSph’s lifetime. We anticipate that more realistic semi-analytic and hydrodynamical models will provide much better comparisons to the observed MDFs than the very simple analytic models we have considered.
8. Conclusions
We have analyzed the metallicity distributions for eight dwarf satellite galaxies of the Milky Way. We fit analytic chemical evolution models to the MDF of each galaxy. A Leaky Box Model starting from zero-metallicity gas does not faithfully describe any of the galaxies because it encounters the same “G dwarf problem” that once complicated the interpretation of the Milky Way’s metallicity distribution (van den Bergh, 1962; Schmidt, 1963). A model with a fairly arbitrary prescription for an increase in gas supply better describes the shape of the MDFs by allowing for a narrower peak and a longer metal-poor tail than the Leaky Box Model. Permitting a non-zero initial metallicity (pre-enrichment) allows the shape of the Leaky Box Model to better fit the observed MDFs, but in no case except Canes Venatici I does the Pre-Enriched Model fit obviously better than the Extra Gas Model. In several cases, the Extra Gas Model fits much better than the Pre-Enriched Model.
The shapes of the MDFs follow several trends with luminosity. The strongest trend is the luminosity-metallicity relation. Final dwarf galaxy luminosity can predict a dwarf galaxy’s mean [Fe/H] to within 0.16 dex ( confidence interval). The luminosity also determines the width of the MDF. However, the luminosity-metallicity spread relation is not as smooth as the luminosity-metallicity relation. Instead, luminosity separates the metallicity spreads into high or low, with the four most luminous dSphs having large spreads and dSphs with the luminosity of Sextans or smaller having small spreads.
We surmise that dSph luminosity is a good indicator of the ability to retain and accrete gas, despite the finding of a common central density for all dSphs (Mateo, 1998; Peñarrubia et al., 2008; Strigari et al., 2008). For the more luminous dSphs, an increase in the gas reservoir during the star formation lifetime shapes the MDF and keeps the effective yield and therefore the mean metallicity and metallicity spread high. The less luminous dSphs are less able to retain gas that leaves via supernova winds or interaction with the Milky Way. Finally, all of the chemical evolution models we consider are much too narrow to explain the MDF for Sculptor. The previous evidence for multiple kinematic populations in Sculptor (Tolstoy et al., 2004; Battaglia et al., 2008a) suggests that Sculptor experienced at least two distinct, major episodes of star formation. We have not considered kinematics in our analysis, but we recognize the value radial velocities add to abundance data. We plan to explore the relationship between velocity dispersion, [Fe/H], and [/Fe] in the future.
Stellar mass, not luminosity, is likely the independent variable, a concept that Woo et al. (2008) explored in detail. The conversion from luminosity to stellar mass involves the ages and metallicities of the component populations. Rather than complicate the observational data, we have chosen to present the dSph metallicity relations against luminosity because it is a direct observable. Most of the dSphs in our sample are ancient and metal-poor. As a result, the relation between their luminosities and stellar masses is one-to-one. Three dSphs—Fornax and Leo I and II—have younger populations, which result in higher luminosities at a given stellar mass. Nonetheless, the relation between luminosity and stellar mass is roughly monotonic for the dSphs in our sample, according to the stellar masses derived by Woo et al. (2008) or Orban et al. (2008). Therefore, we conclude that luminosity is a good proxy for the more fundamental parameter, stellar mass, for these eight dSphs.
The radial gradients of [Fe/H] do not obey a relation with total dSph luminosity. The slopes of the gradients for four dSphs are consistent with zero, and four more are significantly negative. The slopes for Sculptor and Leo II are at least as steep as dex per core radius. Negative slopes are to be expected for most galaxies. Consequently, we have no satisfying explanation for the lack of a pattern for which dSphs happen to show radial gradients, even though we have characterized the star formation of the four less luminous dSphs as dominated by gas outflow. Samples more radially extended than ours might show metallicity gradients in all dSphs.
Although we have assigned quantitative parameters for analytic chemical evolution models to each galaxy, we do not believe that any of the chemical evolution models are excellent fits to any dSph. In particular, the assumptions of instantaneous mixing and recycling are inappropriate for small galaxies with star formation lifetimes longer than the timescale for Type Ia supernova explosions. We expect that models that incorporate inhomogeneous pockets of star formation (such as the models of Marcolini et al., 2006, 2008; Revaz et al., 2009) and time-delayed iron enhancement from Type Ia SNe (such as the models of Lanfranchi & Matteucci, 2004; Marcolini et al., 2006, 2008; Revaz et al., 2009) will much better describe the dSph MDFs. Interested modelers wishing to compare their predictions to our observed MDFs may find the complete catalog of [Fe/H] measurements in Paper II.
References
- Akritas & Bershady (1996) Akritas, M. G., & Bershady, M. A. 1996, ApJ, 470, 706
- Amorisco & Evans (2010) Amorisco, N. C., & Evans, N. W. 2010, MNRAS, in press, arXiv:1009.1813
- Anders & Grevesse (1989) Anders, E., & Grevesse, N. 1989, Geochim. Cosmochim. Acta, 53, 197
- Battaglia et al. (2008a) Battaglia, G., Helmi, A., Tolstoy, E., Irwin, M., Hill, V., & Jablonka, P. 2008a, ApJ, 681, L13
- Battaglia et al. (2008b) Battaglia, G., Irwin, M., Tolstoy, E., Hill, V., Helmi, A., Letarte, B., & Jablonka, P. 2008b, MNRAS, 383, 183
- Battaglia et al. (2010) Battaglia, G., Tolstoy, E., Helmi, A., Irwin, M., Parisi, P., Hill, V., & Jablonka, P. 2010, MNRAS, in press, arXiv:1009.4857
- Battaglia et al. (2006) Battaglia, G., et al. 2006, A&A, 459, 423
- Bellazzini et al. (2002) Bellazzini, M., Ferraro, F. R., Origlia, L., Pancino, E., Monaco, L., & Oliva, E. 2002, AJ, 124, 3222
- Bellazzini et al. (2004) Bellazzini, M., Gennari, N., Ferraro, F. R., & Sollima, A. 2004, MNRAS, 354, 708
- Belokurov et al. (2007) Belokurov, V., et al. 2007, ApJ, 654, 897
- Belokurov et al. (2008) ———. 2008, ApJ, 686, L83
- Belokurov et al. (2009) ———. 2009, MNRAS, 397, 1748
- Belokurov et al. (2010) ———. 2010, ApJ, 712, L103
- Bosler et al. (2007) Bosler, T. L., Smecker-Hane, T. A., & Stetson, P. B. 2007, MNRAS, 378, 318
- Buonanno et al. (1999) Buonanno, R., Corsi, C. E., Castellani, M., Marconi, G., Fusi Pecci, F., & Zinn, R. 1999, AJ, 118, 1671
- Cohen & Huang (2009) Cohen, J. G., & Huang, W. 2009, ApJ, 701, 1053
- Cohen & Huang (2010) ———. 2010, ApJ, 719, 931
- Dekel & Silk (1986) Dekel, A., & Silk, J. 1986, ApJ, 303, 39
- Diemand et al. (2007) Diemand, J., Kuhlen, M., & Madau, P. 2007, ApJ, 667, 859
- Frebel et al. (2010a) Frebel, A., Kirby, E. N., & Simon, J. D. 2010a, Nature, 464, 72
- Frebel et al. (2010b) Frebel, A., Simon, J. D., Geha, M., & Willman, B. 2010b, ApJ, 708, 560
- Geha et al. (2009) Geha, M., Willman, B., Simon, J. D., Strigari, L. E., Kirby, E. N., Law, D. R., & Strader, J. 2009, ApJ, 692, 1464
- Governato et al. (2010) Governato, F., et al. 2010, Nature, 463, 203
- Gullieuszik et al. (2009) Gullieuszik, M., Held, E. V., Saviane, I., & Rizzi, L. 2009, A&A, 500, 735
- Helmi et al. (2006) Helmi, A., et al. 2006, ApJ, 651, L121
- Ibata et al. (1994) Ibata, R. A., Gilmore, G., & Irwin, M. J. 1994, Nature, 370, 194
- Irwin & Hatzidimitriou (1995) Irwin, M., & Hatzidimitriou, D. 1995, MNRAS, 277, 1354
- Kennicutt (1983) Kennicutt, R. C., Jr. 1983, ApJ, 272, 54
- Kirby et al. (2010a) Kirby, E. N., Cohen, J. G., Smith, G. H., Majewski, S. R., Sohn, S. T., & Guhathakurta, P. 2010a, ApJ, in press, arXiv:1011.5221 (Paper IV)
- Kirby et al. (2009) Kirby, E. N., Guhathakurta, P., Bolte, M., Sneden, C., & Geha, M. C. 2009, ApJ, 705, 328 (Paper I)
- Kirby et al. (2008a) Kirby, E. N., Guhathakurta, P., & Sneden, C. 2008a, ApJ, 682, 1217
- Kirby et al. (2008b) Kirby, E. N., Simon, J. D., Geha, M., Guhathakurta, P., & Frebel, A. 2008b, ApJ, 685, L43
- Kirby et al. (2010b) Kirby, E. N., et al. 2010b, ApJS, 191, 352 (Paper II)
- Koch et al. (2008) Koch, A., Grebel, E. K., Gilmore, G. F., Wyse, R. F. G., Kleyna, J. T., Harbeck, D. R., Wilkinson, M. I., & Wyn Evans, N. 2008, AJ, 135, 1580
- Koch et al. (2007a) Koch, A., Grebel, E. K., Kleyna, J. T., Wilkinson, M. I., Harbeck, D. R., Gilmore, G. F., Wyse, R. F. G., & Evans, N. W. 2007a, AJ, 133, 270
- Koch et al. (2006) Koch, A., Grebel, E. K., Wyse, R. F. G., Kleyna, J. T., Wilkinson, M. I., Harbeck, D. R., Gilmore, G. F., & Evans, N. W. 2006, AJ, 131, 895
- Koch et al. (2007b) Koch, A., Wilkinson, M. I., Kleyna, J. T., Gilmore, G. F., Grebel, E. K., Mackey, A. D., Evans, N. W., & Wyse, R. F. G. 2007b, ApJ, 657, 241
- Koleva et al. (2009a) Koleva, M., de Rijcke, S., Prugniel, P., Zeilinger, W. W., & Michielsen, D. 2009a, MNRAS, 396, 2133
- Koleva et al. (2009b) Koleva, M., Prugniel, P., De Rijcke, S., Zeilinger, W. W., & Michielsen, D. 2009b, Astronomische Nachrichten, 330, 960
- Kuehn et al. (2008) Kuehn, C., et al. 2008, ApJ, 674, L81
- Lanfranchi & Matteucci (2003) Lanfranchi, G. A., & Matteucci, F. 2003, MNRAS, 345, 71
- Lanfranchi & Matteucci (2004) ———. 2004, MNRAS, 351, 1338
- Lanfranchi & Matteucci (2007) ———. 2007, A&A, 468, 927
- Lanfranchi & Matteucci (2010) ———. 2010, A&A, 512, A85
- Larson (1974a) Larson, R. B. 1974a, MNRAS, 166, 585
- Larson (1974b) Larson, R. B. 1974b, MNRAS, 169, 229
- Lee et al. (2003) Lee, M. G., et al. 2003, AJ, 126, 2840
- Lin & Faber (1983) Lin, D. N. C., & Faber, S. M. 1983, ApJ, 266, L21
- Lynden-Bell (1975) Lynden-Bell, D. 1975, Vistas in Astronomy, 19, 299
- Majewski et al. (2000b) Majewski, S. R., Ostheimer, J. C., Patterson, R. J., Kunkel, W. E., Johnston, K. V., & Geisler, D. 2000b, AJ, 119, 760
- Marcolini et al. (2003) Marcolini, A., Brighenti, F., & D’Ercole, A. 2003, MNRAS, 345, 1329
- Marcolini et al. (2008) Marcolini, A., D’Ercole, A., Battaglia, G., & Gibson, B. K. 2008, MNRAS, 386, 2173
- Marcolini et al. (2006) Marcolini, A., D’Ercole, A., Brighenti, F., & Recchi, S. 2006, MNRAS, 371, 643
- Martin et al. (2008a) Martin, N. F., de Jong, J. T. A., & Rix, H.-W. 2008a, ApJ, 684, 1075
- Martin et al. (2007) Martin, N. F., Ibata, R. A., Chapman, S. C., Irwin, M., & Lewis, G. F. 2007, MNRAS, 380, 281
- Martin et al. (2008b) Martin, N. F., et al. 2008b, ApJ, 672, L13
- Mateo (1998) Mateo, M. L. 1998, ARA&A, 36, 435
- Mateo et al. (2008) Mateo, M., Olszewski, E. W., & Walker, M. G. 2008, ApJ, 675, 201
- Mehlert et al. (2003) Mehlert, D., Thomas, D., Saglia, R. P., Bender, R., & Wegner, G. 2003, A&A, 407, 423
- Mendel et al. (2009) Mendel, J. T., Proctor, R. N., Rasmussen, J., Brough, S., & Forbes, D. A. 2009, MNRAS, 396, 2103
- Mighell & Burke (1999) Mighell, K. J., & Burke, C. J. 1999, AJ, 118, 366
- Mighell & Rich (1996) Mighell, K. J., & Rich, R. M. 1996, AJ, 111, 777
- Niederste-Ostholt et al. (2010) Niederste-Ostholt, M., Belokurov, V., Evans, N. W., & Peñarrubia, J. 2010, ApJ, 712, 516
- Norris et al. (2010a) Norris, J. E., Wyse, R. F. G., Gilmore, G., Yong, D., Frebel, A., Wilkinson, M. I., Belokurov, V., & Zucker, D. B. 2010a, ApJ, 723, 1632
- Norris et al. (2010b) Norris, J. E., Yong, D., Gilmore, G., & Wyse, R. F. G. 2010b, ApJ, 711, 350
- Orban et al. (2008) Orban, C., Gnedin, O. Y., Weisz, D. R., Skillman, E. D., Dolphin, A. E., & Holtzman, J. A. 2008, ApJ, 686, 1030
- Pagel (1997) Pagel, B. E. J. 1997, Nucleosynthesis and Chemical Evolution of Galaxies (Cambridge UP)
- Peñarrubia et al. (2010) Peñarrubia, J., Belokurov, V., Evans, N. W., Martínez-Delgado, D., Gilmore, G., Irwin, M., Niederste-Ostholt, M., & Zucker, D. B. 2010, MNRAS, 408, L26
- Peñarrubia et al. (2008) Peñarrubia, J., McConnachie, A. W., & Navarro, J. F. 2008, ApJ, 672, 904
- Pietrzyński et al. (2008) Pietrzyński, G., et al. 2008, AJ, 135, 1993
- Prada & Burkert (2002) Prada, F., & Burkert, A. 2002, ApJ, 564, L73
- Revaz et al. (2009) Revaz, Y., et al. 2009, A&A, 501, 189
- Rizzi et al. (2007) Rizzi, L., Held, E. V., Saviane, I., Tully, R. B., & Gullieuszik, M. 2007, MNRAS, 380, 1255
- Rutledge et al. (1997) Rutledge, G. A., Hesser, J. E., & Stetson, P. B. 1997, PASP, 109, 907
- Schmidt (1959) Schmidt, M. 1959, ApJ, 129, 243
- Schmidt (1963) Schmidt, M. 1963, ApJ, 137, 758
- Schörck et al. (2009) Schörck, T., et al. 2009, A&A, 507, 817
- Shetrone et al. (2009) Shetrone, M. D., Siegel, M. H., Cook, D. O., & Bosler, T. 2009, AJ, 137, 62
- Siegel et al. (2010) Siegel, M. H., Majewski, S. R., Sohn, S. T., Shetrone, M. D., Munoz, R. R., & Patterson, R. J. 2010, ApJ, submitted
- Simon et al. (2010a) Simon, J. D., Frebel, A., McWilliam, A., Kirby, E. N., & Thompson, I. B. 2010a, ApJ, 716, 446
- Simon et al. (2010b) Simon, J. D., et al. 2010b, ApJ, submitted, arXiv:1007.4198
- Simon & Geha (2007) Simon, J. D., & Geha, M. 2007, ApJ, 670, 313
- Skillman et al. (1989) Skillman, E. D., Kennicutt, R. C., & Hodge, P. W. 1989, ApJ, 347, 875
- Smecker-Hane et al. (2009) Smecker-Hane, T. A., Marsteller, B., Cole, A., Bullock, J., & Gallagher, J. S. 2009, BAAS, 41, 235
- Sohn et al. (2007) Sohn, S. T., et al. 2007, ApJ, 663, 960
- Spolaor et al. (2009) Spolaor, M., Proctor, R. N., Forbes, D. A., & Couch, W. J. 2009, ApJ, 691, L138
- Starkenburg et al. (2010) Starkenburg, E., et al. 2010, A&A, 513, A34
- Strigari et al. (2008) Strigari, L. E., Bullock, J. S., Kaplinghat, M., Simon, J. D., Geha, M., Willman, B., & Walker, M. G. 2008, Nature, 454, 1096
- Tafelmeyer et al. (2010) Tafelmeyer, M., et al. 2010, A&A, 524, 58
- Talbot & Arnett (1971) Talbot, R. J., Jr., & Arnett, W. D. 1971, ApJ, 170, 409
- Tinsley (1980) Tinsley, B. M. 1980, Fundamentals of Cosmic Physics, 5, 287
- Tolstoy et al. (2001) Tolstoy, E., Irwin, M. J., Cole, A. A., Pasquini, L., Gilmozzi, R., & Gallagher, J. S. 2001, MNRAS, 327, 918
- Tolstoy et al. (2004) Tolstoy, E., et al. 2004, ApJ, 617, L119
- Tremonti et al. (2004) Tremonti, C. A., et al. 2004, ApJ, 613, 898
- Vaduvescu et al. (2007) Vaduvescu, O., McCall, M. L., & Richer, M. G. 2007, AJ, 134, 604
- van den Bergh (1962) van den Bergh, S. 1962, AJ, 67, 486
- Walker et al. (2009) Walker, M. G., Mateo, M., & Olszewski, E. W. 2009, AJ, 137, 3100
- Walker et al. (2007) Walker, M. G., Mateo, M., Olszewski, E. W., Gnedin, O. Y., Wang, X., Sen, B., & Woodroofe, M. 2007, ApJ, 667, L53
- Walsh et al. (2007) Walsh, S. M., Jerjen, H., & Willman, B. 2007, ApJ, 662, L83
- Watkins et al. (2009) Watkins, L. L., et al. 2009, MNRAS, 398, 1757
- Willman et al. (2005) Willman, B., et al. 2005, AJ, 129, 2692
- Winnick (2003) Winnick, R. A. 2003, Ph.D. Thesis, Yale Univ.
- Wolf et al. (2010) Wolf, J., Martinez, G. D., Bullock, J. S., Kaplinghat, M., Geha, M., Muñoz, R. R., Simon, J. D., & Avedo, F. F. 2010, MNRAS, 406, 1220
- Woo et al. (2008) Woo, J., Courteau, S., & Dekel, A. 2008, MNRAS, 390, 1453