80282
S. Criscuoli
Properties of G-band Bright Points
derived from IBIS observations
Abstract
We have investigated properties of photospheric Bright Points (BPs) observed in an Active Region during its decay phase and in a quiet Sun region. We have analyzed two sets of photospheric observations taken with IBIS (Interferometric Bidimensioal Spectrometer) at the NSO Dunn Solar Telescope. The first set consists of spectral data acquired in the Fe I 709.0 nm and Ca I 854.2 nm lines and simultaneous broad-band and of G-band observations. The second set consists of spectro-polarimetric observations in the Fe I 630.15 nm - 630.25 nm doublet and simultaneous white light and G-band observations.
The relation between BP filling factor and RMS image contrast indicates that, on average, BPs cover up to 3% of the solar surface outside Active Regions. The relation between area and intensity values of the features identified on both data sets suggests that they are composed of aggregations of magnetic flux elements. The horizontal velocity values are as high as 2 km/s, thus supporting the scenario of BPs motion contributing to the coronal heating.
keywords:
Sun: high-resolution observations – Sun: atmosphere – Sun: magnetic fields1 Introduction
Bright Points (BPs) are small scale features (diameter less than 300 km) corresponding to areas of kilogauss fields. They are numerous in active regions and near sunspots, but are ubiquitous in the solar photosphere. The BPs result from processes involving the interaction of magnetic fields with convective unstable hot plasma. Their motion can excite Magneto Hydro Dynamic (MHD) waves and trigger the occurrence of nano-flares. Both these processes could contribute significantly to the heating of the upper solar atmosphere.
The aim of this study is to investigate the velocity distributions of photospheric BPs, the relation between their filling factor and Root Mean Square (RMS) image contrast, and the evolution of different BP characteristics. We present results obtained by analyzing two high spectral, spatial and temporal resolution data sets imaging AR10912 and a quiet Sun region.
2 Observations
The data analyzed in this study were acquired with the IBIS (Cavallini, 2006) at DST/NSO on 2006, October 2nd and November 21st. Data sets consist of two time sequences of spectral data, spanning about 70 min the first and 41 min the second, respectively. The simultaneous G-band observations cover approximately the same FOV of the spectral data, but with 4 times smaller pixel scale. The Field of View (FOV) images AR10912 at its decay phase and the quiet Sun, respectively; both regions were observed close to disk centre.
The first sequence consists of 120 spectral scans of the Fe I 709.0 nm line; each scan contains 10241024 pixel images obtained at 29 spectral points in the line, with an exposure time of 80 ms and 20 s cadence. This set is complemented with spectral scans at the Ca I 854.2 nm of the same FOV at 39 spectral points in the line.
The second sequence consists of 50 spectro-polarimetric scans of the Fe I 630.15 nm - 630.25 nm doublet; each scan contains 256256 pixel images obtained at 45 spectral points in the lines, with the 6 modulation states IV, IQ, IU; the data were stored with 80 ms exposition and 89 s cadence.
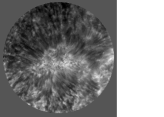
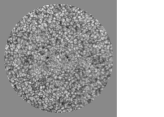
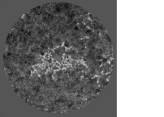
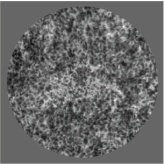
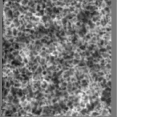
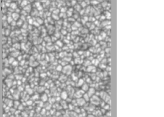
Figure 1 shows examples of the observations analyzed in this study. The calibration of data included dark and flat-field correction, Multi Frame Blind Deconvolution restoring (Van Noort et al., 2006) of broadband images, and reconstruction of spectral images by re-scaling, rotating, shifting and de-stretching these images to their restored and de-stretched broadband counterparts.
3 Method
Small scale BPs were identified on the G-band images by applying the Multi Level Thresholding 4 (MLT4) algorithm (Bovelet & Wiehr, 2007) and a modified version of it (2-step MLT4). Both algorithms produce a binary image displaying the BPs identified on the segmented image. To analyze the evolution of the identified features with time, we then applied the Two-level Structure Tracking (TST) algorithm (Del Moro, 2004) on the binary images. The 2-step MLT4 singled out 5345 and 3120 BPs from all the segmented images of the quiet Sun and AR dataset, respectively. The large number of identified features allows us to perform a statistical study of the evolution of various BPs properties, and to derive time-averaged values for the analyzed quantities.
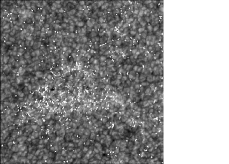
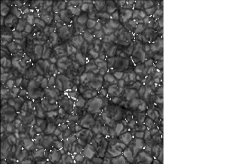
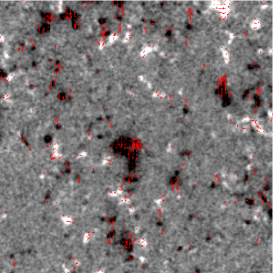
To derive an estimate of the longitudinal magnetic flux density, we applied the center-of-gravity method (Rees & Semel, 1979) to the left- and right-hand circularly polarized signals of the Fe I 630.25 nm line sequence . We also applied the Differential Affine Velocity estimator (DAVE henceforth) algorithm (Schuck, 2008) on the magnetic maps computed from the Fe I 630.25 nm data set to derive maps of the horizontal velocity fields for the BPs singled out with the image processing. Examples of the obtained segmented features, flux density and horizontal velocity maps are shown in Figs. 2 and 3.
4 Results and Conclusions
Figure 2 shows the results obtained by applying the BP identification algorithms on the G-band filtergrams co-temporally and co-spatially stored with the spectral data in Fig. 1 (bottom panel). The BPs identified by the 2-step MLT4 algorithm are overlaid in white on the segmented G-band image.
We found that the 2-step MLT4 algorithm allows us to identify about 50% more BPs than those singled out with the MLT4 on the same image. We also found that the number of identified BPS increases with the increase of the RMS contrast. Note that, because of stray-light effects and resolution loss due to seeing effects on the data analyzed, the RMS values we measured are 47% and 70% in quiet Sun and AR dataset, respectively, lower than the values obtained from numerical simulations (Tritscheler & Uitenbroek, 2006; Wedemeyer-Boöhm & Rouppe van der Voort, 2009). From the relation Number of features-RMS contrast deduced from the data analyzed, we extrapolated the number of BPs that would be measured at the RMS contrast values obtained from numerical simulations. In quiet Sun regions we found filling factor values of 2.3% and 2.6% from MLT and 2-step MLT data, respectively; while in AR region we found 4% and 11.6%, respectively. Note that the filling factor value we found for quiet Sun agrees with the one reported by Sanchez Almeida et al. (2010) from the analyses of G-band observations taken at better spatial resolution than our observations.
We also analyzed the BP lifetime and the relation between intensity and area for the identified features. The results derived from the two data sets for these quantities show a dependence from the spatial sampling and seeing conditions of the data sets analyzed. We nevertheless found that, on average, the lifetime of features identified in the quiet Sun is 1.5 min, which is in agreement with previous studies (Utz et al., 2010; de Wijn et al., 2009). In addition, the relation between intensity and area derived from the features identified on both data sets suggests that the features analyzed are composed by aggregations of unresolved magnetic elements, as obtained with simulations by Criscuoli & Rast (2009) (see also Viticchié et al. (2010) and the discussion therein).
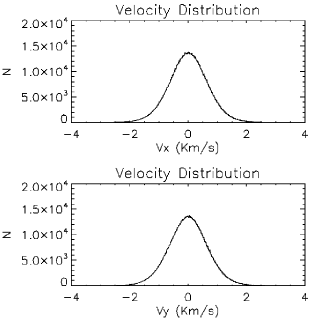
The horizontal velocity values derived with DAVE on quiet Sun follow a Gaussian distribution, as illustrated in Fig. 4. The velocity values found are as high as 2 km/s, in agreement with those reported by Utz et al. (2010) from the analysis of HINODE/SOT G-band observations. Note that this value supports the scenario in which BPs motion could impact the coronal heating.
Acknowledgements.
The calibration pipeline of IBIS data has been kindly provided by Alexandra Tritschler. This study has been partially supported by the INAF, ASI, and MAE, within the PRIN-INAF-2007, ASI-ESS and MAE-2007 grants, respectively.References
- Bovelet & Wiehr (2007) Bovelet, B. & Wiehr, E. 2007, Sol. Phys., 243, 121
- Cavallini (2006) Cavallini, F. 2006, Sol. Phys., 236, 415
- Criscuoli & Rast (2009) Criscuoli, S. & Rast, M.P. 2009, A&A, 495, 621
- Del Moro (2004) Del Moro, D. 2004, A&A, 428, 1007
- de Wijn et al. (2009) de Wijn, A. G., Stenflo, J. O., Solanki, S. K., Tsuneta, S. 2009, SSRv, 144, 275
- Rees & Semel (1979) Rees, D.E. & Semel, M.D. 1979, A&A, 74, 1
- Sanchez Almeida et al. (2010) Sanchez Almeida, J., Bonet, J., Viticchié, B., Del Moro, D. 2010, ApJ, 715, L26
- Schuck (2008) Schuck, P. W. 2008, ApJ, 683, 1134
- Tritscheler & Uitenbroek (2006) Tritscheler, A. & Uitenbroek, H. 2006, ApJ, 648, 741
- Utz et al. (2010) Utz, D., Hanslmeier, A., Muller, R., Veronig, A., Rybák, J., Muthsam, H. 2010b, A&A, 511, 39
- Viticchié et al. (2010) Viticchié, B., Del Moro, D., Criscuoli, S., Berrilli, F. 2010, arXiv:1009.0721
- Van Noort et al. (2006) Van Noort, M., Rouppe van der Voort, L., Lofdahl, M., 2006, ASPC, 354, 55V
- Wedemeyer-Boöhm & Rouppe van der Voort (2009) Wedemeyer-Böhm, S. and Rouppe van der Voort, L. 2009, A&A, 503, 225