Shifted loops and coercivity from field imprinted high energy barriers in ferritin and ferrihydrite nanoparticles
Abstract
We show that the coercive field in ferritin and ferrihydrite depends on the maximum magnetic field in a hysteresis loop and that coercivity and loop shifts depend both on the maximum and cooling fields. In the case of ferritin we show that the time dependence of the magnetization also depends on the maximum and previous cooling fields. This behavior is associated to changes in the intra-particle energy barriers imprinted by these fields. Accordingly, the dependence of the coercive and loop shift fields with the maximum field in ferritin and ferrihydrite can be described within the frame of a uniform-rotation model considering a dependence of the energy barrier with the maximum and the cooling fields.
pacs:
75.30.Cr, 75.50.Ee, 75.60.Ej, 75.50.TtI Introduction
The magnetic properties of ferritin have been extensively studied in the last decade due to their puzzling features such as the existence of a maximum in the magnetization derivative at zero field,Friedman et al. (1997); Tejada et al. (1997) a nonmonotonic field dependence of the magnetic viscosity,Friedman et al. (1997); Tejada et al. (1997); Mamiya et al. (2002) and a decrease of the antiferromagnetic susceptibility with temperature below the Néel temperature when considered at low fields.Makhlouf et al. (1997); Silva et al. (2009) Many of these studies were performed to enlighten the possible existence of quantum tunnelling in ferritin in the kelvin range. Less attention has been paid to the magnetic hysteresis, although it was termed “anomalous” in an early report due to the large coercivity ( Oe at 5 K), irreversibility up to relatively high fields ( kOe) and loop displacement found after field cooling.Makhlouf et al. (1997) Ferritin consists of a hollow spherical shell composed of 24 protein subunits surrounding a ferrihydrite-like core. The diameter of the cavity is of the order of 7-8 nm and the average size of the core of horse spleen ferritin is 5 nm.Mann (1996) The ferritin magnetic core orders antiferromagnetically and has both compensated and uncompensated spins, resulting in a net magnetic moment of about a hundred of Bohr magnetons per particle.Silva et al. (2005)
Ferritin belongs to a group of nanoparticles where loop displacements are found but where strictly speaking there is neither a ferromagnetic (FM) material coupled to an antiferromagnetic (AF) one nor a cooling across a Néel transition temperature. The cooling is normally performed across the blocking temperature of the nanoparticles, i. e., across the temperature below which the magnetic moment of the “average” nanoparticle is not able to fluctuate across the anisotropy barrier within the characteristic time of the measurement, which in ferritin and for dc measurements is about 20 K. In these systems, the origin of the loop shift is not clearly established. In AF nanoparticles the loop shift has been often interpreted as an exchange bias between the AF core and the uncompensated spins of the spin-glass surface. In the case of FM and ferrimagnetic nanoparticles the loop shift is thought to arise due to exchange between the spin-glass spins and the FM core.Nogués et al. (2005); Iglesias et al. (2008) Other studies attribute the loop shift to the existence of a minor hysteresis loop.Bendata et al. (2005) In fact, as highlighted in Ref.Nogués et al. (2005); Iglesias et al. (2008), many of these systems show high field irreversibility and non-saturating hysteresis loops, raising the question of the influence of the minor loops on the exchange field and, eventually, the question of the existence of a real exchange bias.
Here we report a study on the coercive field and loop shifts in ferritin at low temperature, obtained in magnetization cycles recorded for different maximum fields up to 30 Oe, and after cooling under the influence of fields with different intensities. This study is also extended to ferrihydrite nanoparticles, which are similar to the ferritin magnetic cores, and complemented by the measurement of the time dependence of the magnetization near zero field.
II Background
Within the framework of the uniform rotation models developed by Stoner-Wohlfarth and Néel-Brown,Néel (1949); Brown Jr. (1963) reversal of magnetization over an energy barrier separating two minima is a coherent process, which can occur at K when the barrier is lowered down to zero by applying a magnetic field in the opposite direction of the particles magnetization,Stoner and Wohlfarth (1948) or it can occur by thermal activation when the thermal energy becomes comparable to and thus the characteristic reversal time becomes comparable to the characteristic measurement time ,Néel (1949). These quantities are related by the Arrhenius law
| (1) |
where is the inverse of an attempt frequency, supposed constant for simplicity in many situations. The energy barrier is field-dependent and it can be written as
| (2) |
with for systems with uniaxial anisotropy and easy axes parallel to the applied field, where is the energy barrier at zero field and is the switching field at zero temperature. In ferromagnetic materials and , while in general
| (3) |
where is the particle volume, is the anisotropy constant, is the saturation magnetization and an exponent equal to 1/2 in the case of antiferromagnetic ferrihydrite nanoparticles.Silva et al. (2008) In the framework of the Néel model and for a random distribution of anisotropy axes, García-Otero et al. (1998). In general, simulations and experimental results show that depends on the anisotropy, distribution of particle sizes and on interparticle interactions.Pfeiffer (1990); Nunes et al. (2001)
According to Eq. (2), magnetization reversal occurs at the coercive field , when the energy barrier becomes small enough to be overcome at the given and measuring time
| (4) |
where we have just re-written Eq. (2). The dependence of on temperature, nanoparticle volume and characteristic measurement time can then be obtained by using Eq. (1) for in the previous equation, as shown in Ref.Bean and Livingston (1959); Kneller and Luborsky (1963). In particular, for the volume dependence of at constant temperature one has
| (5) |
where is the blocking volume, i.e., the volume above which cannot be crossed within in a system with anisotropy and at a temperature . A more refined expression for can be obtained by considering the temperature dependence of and .He and Chen (2007)
III Experimental
Horse spleen ferritin samples used in these experiments were obtained from Sigma Chemical Company and prepared in powder samples by evaporation of the solvent at room temperature.
The synthesis of the ferrihydrite nanoparticles in the organic-inorganic matrix (termed di-ureasil) has been described elsewhere.Silva et al. (2003) The particles are precipitated by thermal treatment at 80 ∘C, after the incorporation of iron nitrate in the matrix. The sample here studied has an iron concentration of 2.1 % in weight and the particles have a diameter distribution that can be described by a lognormal function
| (6) |
with nm and standard deviation of the natural logarithm of the diameter .Silva et al. (2006)
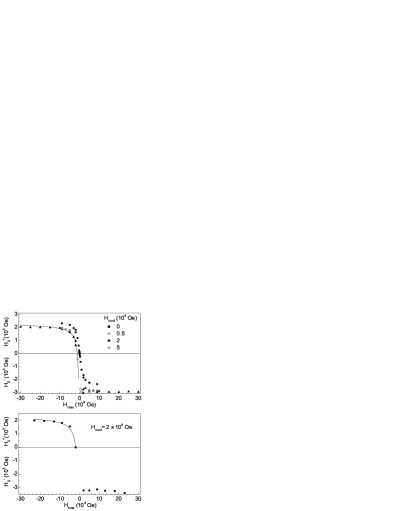
For ferritin, magnetization was measured as a function of field up to different maximum fields (in the 0.5 to Oe range) and after cooling from 100 K down to low temperature (3.2 and 4.2 K) in zero-field cooling (ZFC) and field-cooling (FC) procedures using different cooling fields . These measurements were performed in a PPMS system (Quantum Design) with a vibrating sample magnetometer (VSM) option, and in a Bitter magnet with a VSM (HFML facility, Nijmegen). In the latter, the modulus of the magnetization was measured and magnetization curves were reconstructed by using the proper signal. Near zero this procedure is not perfect (since noise is always additive) and a small kink around zero field appears (see Fig. 1).
At the characteristic time of measurement, irreversibility phenomena vanish for K and magnetization curves taken at 3.2 K after cooling with Oe from temperatures between 50 and 300 K are similar. The magnetization curves are also independent on the cooling rate (cooling from 100 K) in the 0.5 to 5 K/min range. In addition, magnetization was measured as a function of time during about 1000 s [] after cooling from 100 K down to 4.5 K in ZFC and FC with Oe procedures. For each cooling procedure and at low temperature (4.5 K), we have followed two different measurement protocols: i) applied different , removed the field down to a value near zero (50 Oe) and measured and ii) applied different , then reversed the field to , removed it down to Oe and measured .
For the ferrihydrite nanoparticles grown in the organic-inorganic hybrid matrix, magnetization was measured as a function of field up to different maximum fields (in the to Oe range) and after cooling from 100 K down to 3.2 K in FC procedure using Oe, in a Bitter magnet with an extraction magnetometer (GHMFL facility, Grenoble).
IV Results and discussion
IV.1 Effect of and in the magnetization loops
The magnetization loops of ferritin obtained at low temperature are analogous to those previously reported,Makhlouf et al. (1997); Friedman et al. (1997); Kilcoyne and Cywinski (1995) with non-saturation, high-field irreversibility and a maximum in the magnetization derivative at zero field. The ZFC cycles are symmetric and increasingly broader as increases [Fig. 1(a)]. When the sample is cooled in the presence of a field the magnetization curves are shifted in the axis [Fig. 1(b)], being also increasingly broader as increases up to fields of the order of 10 104 Oe. Another interesting observation is that the differences in decreasing-field branches of the loops obtained after a FC procedure for different are less significant than those obtained after a ZFC procedure, while in increasing-field branches, the differences are more significant after FC than after ZFC procedure. Similar results are found for ferrihydrite nanoparticles.
The horizontal shift of the hysteresis loops in the cooling field direction is similar to that previously found in ferritin,Makhlouf et al. (1997), ferrihydritePunnoose et al. (2004) and other magnetic nanoparticles.Iglesias et al. (2008) In the case of AF NiO nanoparticles, this loop shift was associated to surface anisotropy and multisublattice states, with the latter being associated to a variety of reversal paths.Berkowitz et al. (1999) Surface anisotropy arises due to the breaking of the crystal-field symmetry at the boundary of the nanoparticle. Two models have been considered: one where the easy axis is transverse to the boundary and another where the local easy axis depends on the site “defect” (Néel surface anisotropy model).Kachkachi and Mahboub (2004) The loop shift in AF nanoparticles is also interpreted in terms of an exchange bias between antiferromagnetic and uncompensated moments, although no transition temperature is crossed but rather a blocking temperature.

The effect of and on the field values at which magnetization crosses zero in the decreasing and increasing field branches of the hysteresis loop (termed and , respectively) can be observed in Fig. 2. For , has a smaller variation with compared to that of , while for , and have symmetric variations.
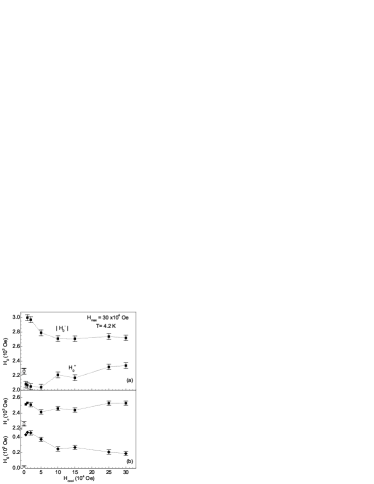
¿From Fig. 2, it is also clear that the effect of on is more important than the effect of . In Fig. 3, we show the dependence of , , the coercive field and the loop shift on the cooling field for the highest maximum applied field Oe. With increasing , increases approaching the ZFC value for H Oe, whereas values slightly decrease and are always higher in modulus than the value for ZFC. Interestingly, the larger departures of and from the ZFC value occur for lower . As a result, is almost independent on , being higher than the ZFC value, while the loop shift has a small decrease with .
IV.2 Effect of and in
To have a better insight on the changes occurring near and induced by the application of different and , we have performed measurements of near zero field, after ZFC and FC under Oe as described in Sec. III. With these measurements, we aim at demonstrating that the changes in the hysteresis loops are related to changes in the energy barriers to magnetization reversal induced by and .
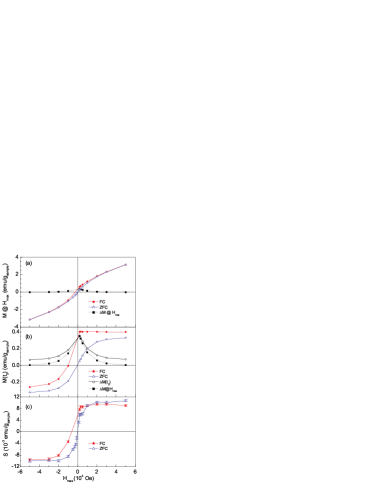
Before discussing the results of the magnetic relaxation measurements presented in Fig. 4(c), we will start by analyzing the magnetic state of the samples attained after the protocols previous to the relaxation measurements. First, we plot in Fig. 4(a) the values of magnetization obtained at () after ZFC and FC procedures. As it can be observed, the magnetization values obtained after a FC are always higher than those attained after a ZFC process. Second, the magnetization values obtained right after the field is decreased down to 50 Oe (-50 Oe) [] after FC and ZFC procedures are plotted in Fig. 4(b). Comparison with results in the previous panel shows that the difference between the ZFC and FC values of (full squares) is always smaller than the differences between the ZFC and FC values of (open circles). In fact, at the highest applied Oe, FC and ZFC values of are identical, while the corresponding values for become substantially different. The differences after FC and ZFC procedures that appear in after decreasing the field down to 50 Oe are an indication of the different energy barriers that each particle magnetic moment has been able to cross. The higher values measured after FC hint at the appearance of energy barriers imprinted after FC that are higher than after the ZFC process. Moreover, the fact that values become the same after measuring at the highest Oe [see Fig. 4(a)] indicates that the differences in appearing after both procedures cannot be attributed to an increase of the net magnetic moment of the individual particles induced at after the FC process. Finally, it is also interesting to note the constancy of observed for positive after FC [filled circles in Fig. 4(b)], which shows that the fraction of magnetic moments that reverse after reduction of the field is almost independent of the maximum applied field and reinforces the two points commented previously. In contrast, when is applied in a direction opposite to [points with negative abscissas in panels (a) and (b) of Fig. 4], there is a progressive increase of with increasing for both ZFC and FC procedures while values are essentially the same in the two cases. Again, this shows that the changes in cannot be attributed to an increase of the uncompensated moment of the particles but rather to the fact that, when arriving near zero field, different fractions of magnetic moments are able to cross the energy barriers at depending on and , an indication that the effective energy barriers felt by the particles near zero field are modified by . In a simple picture, a negative has the effect of erasing the barriers imprinted by the positive , with the system being closer to the ZFC configuration as the intensity of increases.
In what follows, we will analyze the results of the relaxation measurements following the two above mentioned protocols. As previously found in ferritinFriedman et al. (1997); Mamiya et al. (2002), displays a quasi-linear dependence on at intermediate times within the studied range (up to 1000 s) and can be fitted to the following expression:
| (7) |
where is related to the initial magnetization and is the so-called coefficient of magnetic viscosity. Eq. (7) is particularly useful in situations where is not known.S. Pierre et al. (2001) This equation can be derived from a general expression for the time dependence of the magnetization of an ensemble of nanoparticles with distribution of energy barriers , after field removal
| (8) |
where is the initial magnetization of a particle with energy barrier . It can also be shown that is proportional to and, therefore, is an appropriate quantity to observe changes in the energy barriers.S. Pierre et al. (2001); Jonsson et al. (1997) However, the direction of this change is not directly given by since, in principle, is a non monotonous function. A distribution of energy barriers results directly from a distribution of volumes, according to the relation , where is the volume distribution. Other sources of a distribution of energy barriers are a distribution of shapes, the existence of nanoparticles with the same size but with different degrees of crystallinity, different oxygen and water content.
This equation assumes that the magnetization decay of a nanoparticle ensemble is due to the switching of the nanoparticles magnetic moments as a consequence of energy barrier crossing when, for a given and , the Arrhenius relaxation time is of the order of the measurement time .
The dependence of the viscosity coefficient as obtained from fits of the linear part of the relaxation curves to Eq. 7 is reported in Fig. 4(c). We observe that for positive and for the FC case, remains essentially constant with increasing . This means that imprints energy barriers for reversal into the FC direction that are not substantially changed by a positive applied . However, in the ZFC case, the relaxation rate increases with , showing that changes the energy barriers in this case. For negative (applied contrary to the direction), however, the energy barriers are shifted. In summary, the general behavior of is similar to that of , reinforcing the interpretation of the effects of and in terms of energy barriers. Since in ferritin Luis et al. (1999); Mamiya et al. (2006) and in the ferrihydrite nanoparticles here studied Silva et al. (2008) interparticle interactions are negligible, the proposed changes in the energy barriers are most probably associated to intra-particle phenomena, as discussed below.
IV.3 Effect of on the energy barriers
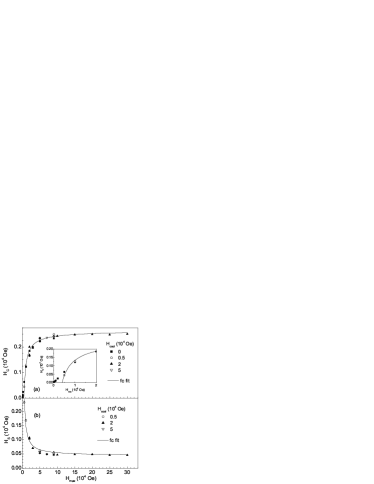
In Fig. 5, we present the dependence of and with for hysteresis loops measured after ZFC (squares) and after cooling in different different . The first point to notice is that, in the FC case, the loop shift first rapidly decreases for low but, for fields higher than Oe, it saturates to a value around 500 Oe even for extraordinarily high values of Oe. This behavior is somewhat unexpected since, for the usually observed loop shifts due to minor loops, the shift tends to zero for sufficiently high fields.
Secondly, the constancy of obtained at high fields in the FC case is an indication of the existence of high energy barriers imprinted by that cannot be surmounted even by applying a of Oe field in the direction opposite to . Both observations (together with the variation already presented in Fig. 2) indicate an initial evolution of the minor loops due to crossing of smallest energy barriers. After this first stage, the variations are smoothed by the higher energy barriers imprinted by . According to the behavior of , and , it is clear that increases the energy barriers in the field direction () and decreases barriers in the opposite direction (). Since the highest barriers are not overcome, the symmetric situation cannot be recovered and thus is always different from zero.
A quantitative description of these phenomena can be given within the framework of the uniform rotation model in terms of the influence of on the energy barriers near zero field . First, let us notice that the dependence of on is similar to the dependence of on usually found in nanoparticle systems (see Eq. 5).García-Otero et al. (1998) Taking into account this resemblance, and with the aim to propose an expression for which properly describes the measured data, we will assume that influences the zero field energy barriers in a way similar to the particle volume (Eq. 3)
| (9) |
where is a power law exponent that controls the way approaches its limiting value for high , such that a higher is associated to a faster approach to saturation. This power law dependence condensates different possible mechanisms for the influence of on intrinsic energy barriers: either a change in the exponent in Eq. (3) or an irreversible increase of the anisotropy constant . The first possibility seems to be ruled out since, as reported in the previous section, does not seem to affect the net magnetic moment of the particles. Therefore, the influence of can be thought mostly as an effect on associated to an increase of the local (intra-particles) energy barriers. Since these are macroscopically average measurements, it is difficult to access the “microscopic” origin for this effect on . Anyway, this can be understood considering that the system has multiple configurations with associated energies such that and selects or imprints a set of these configurations restricting the relaxation of the moments.
Based on Eq. (4) the relation between and can be expressed as
| (10) |
where , is redefined as for infinite and is defined as the field at which is zero. The relation between and is that expressed in Eq. (9) since is a particular case of an . When comparing to experimental data, care must be taken and the FC and ZFC cases must be distinguished. In the FC case, can be negative and is the field at which crosses zero (Fig. 2). In the ZFC case, is defined as the field at which the behavior of at high extrapolates to zero, since in practice the experimental values are not zero at .
Eq. (10) can successfully describe the data shown in Fig. 2, with Oe, Oe and for the FC data. In the case of ferrihydrite Oe, Oe, . Considering , in ferritin and in ferrihydrite, i. e. approximately a linear and quadratic relation between and . The differences here found for are associated to the fact that in ferrihydrite a smaller is enough to approach to saturation. Again, the “microscopic” origin for this mechanism is not clear.
For ZFC data, both and are well described by Eq. (10) for , while for FC is approximately constant. Accordingly, the generalization to the dependence of the coercive field for ZFC and FC procedure ( and , respectively) and of is straightforward
| (11) |
and
| (12) |
where is constant.
As expected from the agreement between the data and Eq. (10), Eq. (IV.3) can also be successfully used to describe the and data in the Oe range, as shown in Fig. 5(a), with Oe and Oe for the ZFC data, and with the previous parameters and Oe for the FC data. For low fields ( Oe) the fit deviates from the experimental data, while the fit considering only the high field data extrapolates to . At , the experimental is still about 18% of its saturation value, approaching zero for . The differences between the and data are probably of the order of data error and, thus, the differences between ZFC and FC fitted parameters are also within the error bars.
The value of at Oe and 3.2 and 4.2 K is of the order of that previously found for ferritin at 5 K ( Oe).Makhlouf et al. (1997) The slightly higher value that was found (2200 Oe) is probably due to the lower temperature. Other factors affecting that may contribute to this difference are the field sweeping rate and characteristic time of measurement.
As in the case of , the dependence of with can be in fact described by Eq. (12), with the parameters obtained for and a constant Oe, which gives an extrapolated Oe.
V Conclusions
Coercivity and loop shifts in nanoparticles are dynamical phenomena, which depend on temperature, characteristic time of measurement and number of cycles, for instance. In ferritin, we have shown that coercivity and loop shifts depend also on the cooling field and on the maximum field used, for fields higher than those normally used. The dependence of coercivity and loop shifts with the maximum field can be described in terms of changes in the anisotropy energy barrier near zero field induced by the maximum field, and quantitatively described by a modified Néel-Brown model here proposed. Qualitatively, field cooling imprints energy barriers, such that the energy barriers near zero in the descending and ascending branches of the magnetization cycle are higher and lower than in the ZFC case, respectively. This difference is attenuated (but not erased) by increasing the maximum field in the opposite direction of the cooling field. Accordingly, the loop shift decreases with the maximum field but it is not zero up to the highest field used ( Oe), showing that the barriers imprinted by field cooling cannot be overcome by these high fields.
The experimental observations and subsequent analysis presented in this article have evidenced the imprinting of high energy barriers through an effective anisotropy induced by the applied protocols. This gives rise to the high irreversibility and minor loop effects similar to those observed in spin-glasses and diluted antiferromagnets, where this phenomenology is ascribed to dilution and the antiferromagnetic character of the interactions and not to frustration.Levy et al. (1982); Rodríguez et al. (1985)
Acknowledgements.
The authors acknowledge V. de Zea Bermudez for the synthesis of the organic-inorganic hybrid containing ferrihydrite nanoparticles and R. Boursier for his help with the high field setup in Grenoble. Part of this work has been supported by EuroMagNET II under the EU contract No. 228043. We acknowledge IFIMUP for the possibility of performing the magnetization time dependence measurements. The financial support from FCT (Grant No. PTDC/FIS/105416/2008) is gratefully recognized. The Aveiro-Zaragoza collaboration has been supported by the Integrated Spanish-Portuguese Action under the Grant No. PT2009-0131. The work in Zaragoza has been supported by the research Grants No. MAT2007-61621 and CONSOLIDER CSD2007-00010 from the Ministry of Education. Ò. I. and A. L. acknowledge funding of the Spanish MICINN through Grant No. MAT2009-08667 and No. CSD2006-00012, and Catalan DIUE through project No. 2009SGR856. N. J. O. S. acknowledges CSIC for a I3P contract and FCT for Ciencia 2008 program, A. U. acknowledges the financial support provided by contract from the EC NoE ‘MAGMANET’ and R. B. acknowledges ICMA-CSIC for a JAE-predoc grant.References
- Friedman et al. (1997) J. R. Friedman, U. Voskoboynik, and M. P. Sarachik, Phys. Rev. B. 56, 10793 (1997).
- Tejada et al. (1997) J. Tejada, X. X. Zhang, E. del Barco, J. M. Hernández, and E. M. Chudnovsky, Phys. Rev. Lett. 79, 1754 (1997).
- Mamiya et al. (2002) H. Mamiya, I. Nakatani, and T. Furubayashi, Phys. Rev. Lett. 88, 067202 (2002).
- Makhlouf et al. (1997) S. A. Makhlouf, F. T. Parker, and A. E. Berkowitz, Phys. Rev. B. 55, R14717 (1997).
- Silva et al. (2009) N. J. O. Silva, A. Millán, F. Palacio, E. Kampert, U. Zeitler, H. Rakoto, and V. S. Amaral, Phys. Rev. B. 79, 104405 (2009).
- Mann (1996) S. Mann, Inorganic Materials (Willey and Sons, Chichester, 1996).
- Silva et al. (2005) N. J. O. Silva, V. S. Amaral, and L. D. Carlos, Phys. Rev. B. 71, 184408 (2005).
- Nogués et al. (2005) J. Nogués, J. Sort, V. Langlais, V. Skumryev, S. Suriñach, J. S. Muñoz, and M. D. Baró, Physics Reports 422, 65 (2005).
- Iglesias et al. (2008) O. Iglesias, A. Labarta, and X. Batlle, J. Nanosci. Nanotechnol. 8, 2761 (2008).
- Bendata et al. (2005) S. Bendata, S. Sahoo, X. Chen, W. Kleemann, D. Sudfeld, K. Wojczykowski, and A. Hutten, Phase Trans. 78, 121 (2005).
- Néel (1949) L. Néel, Ann. Geophys. 5, 99 (1949).
- Brown Jr. (1963) W. F. Brown Jr., Phys. Rev. 130, 1677 (1963).
- Stoner and Wohlfarth (1948) E. C. Stoner and E. P. Wohlfarth, Philos. Trans. R. Soc. London Ser. A 240, 599 (1948).
- Silva et al. (2008) N. J. O. Silva, V. S. Amaral, L. D. Carlos, B. Rodríguez-González, L. M. Liz-Marzán, T. S. Berquó, S. K. Banerjee, V. de Zea Bermudez, A. Millán, and F. Palacio, Phys. Rev. B. 77, 134426 (2008).
- García-Otero et al. (1998) J. García-Otero, A. J. García-Bastida, and J. Rivas, J. Magn. Magn. Mater. 189, 377 383 (1998).
- Pfeiffer (1990) H. Pfeiffer, Phys. Stat. Sol. A 118, 295 (1990).
- Nunes et al. (2001) W. C. Nunes, M. A. Novak, M. Knobel, and A. Hernando, J. Magn. Magn. Mater. 226-230, 1856 (2001).
- Bean and Livingston (1959) C. P. Bean and J. D. Livingston, J. Appl. Phys. 30, S120 (1959).
- Kneller and Luborsky (1963) E. F. Kneller and F. E. Luborsky, J. Appl. Phys. 34, 656 (1963).
- He and Chen (2007) L. He and C. Chen, Phys. Rev. B. 75, 184424 (2007).
- Silva et al. (2003) N. J. O. Silva, V. S. Amaral, L. D. Carlos, and V. de Zea Bermudez, J. Appl. Phys. 93, 6978 (2003).
- Silva et al. (2006) N. J. O. Silva, V. S. Amaral, L. D. Carlos, B. Rodríguez-González, L. M. Liz-Marzán, A. Millán, F. Palacio, and V. de Zea Bermudez, J. Appl. Phys. 100, 054301 (2006).
- Kilcoyne and Cywinski (1995) S. H. Kilcoyne and R. Cywinski, J. Magn. Magn. Mater. 140-144, 1466 (1995).
- Punnoose et al. (2004) A. Punnoose, T. Phanthavady, M. S. Seehra, N. Shah, and G. P. Huffman, Phys. Rev. B. 69, 054425 (2004).
- Berkowitz et al. (1999) A. E. Berkowitz, R. Kodama, S. A. Makhlouf, F. T. Parker, F. E. Spada, E. J. McNiff Jr., and S. Foner, J. Magn. Magn. Mater. 196-197, 591 (1999).
- Kachkachi and Mahboub (2004) H. Kachkachi and H. Mahboub, J. Magn. Magn. Mater. 278, 334 (2004).
- S. Pierre et al. (2001) T. G. S. Pierre, N. T. Gorham, P. D. Allen, J. L. Costa-Krämer, and K. V. Rao, Phys. Rev. B. 65, 024436 (2001).
- Jonsson et al. (1997) T. Jonsson, J. Mattsson, P. Nordblad, and P. Svedlindh, J. Magn. Magn. Mater. 168, 269 (1997).
- Luis et al. (1999) F. Luis, E. del Barco, J. M. Hernández, E. Remiro, J. Bartolomé, and J. Tejada, Phys. Rev. B. 59, 11837 (1999).
- Mamiya et al. (2006) H. Mamiya, M. Ohnuma, I. Nakatani, and T. Furubayashi, Europhys. Lett. 74, 500 (2006).
- Levy et al. (1982) P. M. Levy, C. Morgan-Pond, and A. Fert, J. Appl. Phys. 53, 2168 (1982).
- Rodríguez et al. (1985) R. Rodríguez, A. Fernández, A. Isalgué, J. Rodríguez, A. Labarta, J. Tejada, and X. Obradors, Journal of Physics C 18, L401 (1985).