The signature of LLAGNs in the nearby universe
Abstract
We have used the diagnostic diagram that compares the ratio of emission lines [NII]6584/H with the equivalent width of [NII]6584, as proposed by Coziol et al. (1998), to determine the source of ionization of SDSS NELGs that cannot be classified by standard diagnostic diagrams, because the emission line [OIII]5007, H, or both, are missing. We find these galaxies to be consistent with low luminosity AGNs, suggesting that this characteristic is the signature of the LLAGNs in the nearby Universe.
1 Resumen
Hemos utilizado el diagrama diagnóstico que compara la razón de las líneas de emisión [NII]6584/H con el ancho equivalente de [NII]6584, propuesto por Coziol et al. (1998), para determinar la fuente de ionización de galaxias con líneas de emisión agostas tomadas del SDSS donde la emisión en [OIII]5007, en H, o ambas, no están presentes y por esta razón fueron excluidas de análisis previos. Estas galaxias se encuentran generalmente poblando la región del digarama consistente con AGNs de baja luminosidad, sugiriendo que esta característica es la firma de los LLAGNs en el universo cercano.
2 Introduction and Discussion
The most common (standard) diagnostic diagrams devised to identify the source of ionization of Narrow Emission Line Galaxies (NELGs) in the nearby universe are those that compare the line ratios [OIII]5007/H with [NII]6584/H [OI], or [SII]. Applying different separation sequences Kewley at al. (2001) and Kauffmann et al. (2003) proposed to discriminate between NELGs ionized by thermal photo-ionization, consistent with Star Forming Galaxies (SFGs), and NELGs ionized by non thermal photo-ionization source, generally called Active Galactic Nuclei (AGNs). Galaxies with intermediate line ratios are classified as Transitory Objects (TOs).
The standard diagnostic diagrams are unfortunately useless in cases where some of the emission lines listed above are missing. In the SDSS survey this leaves an important fraction of galaxies unclassifiable (Cid Fernandes et al. 2010). The main interest of NELGs with emission lines missing is that they are particularly frequent in dense galactic structures, like clusters of galaxies (Phillips et al. 1986) and compact groups (Coziol et al. 1998; Martínez et al. 2010).
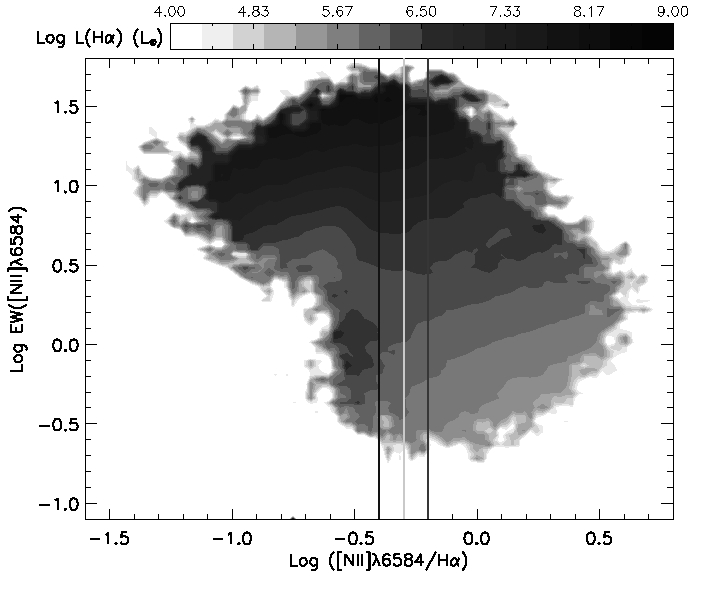
In Coziol et al. (1998) it was shown that even after subtracting different templates from the spectra the missing lines do not appear. This is why these authors have used an alternative ”diagnostic diagram” to classify these galaxies. The NII diagram compares the equivalent width (EW) of [NII]6584, which is unaffected by the template subtraction, with the corrected by template ratio [NII].
From the SDSS DR5 we have downloaded a sample of 476931 NELGs spectra, using the Virtual Observatory service111 http://www.starlight.ufsc.br. Keeping only galaxies that have emission lines S/N (S/N10 in the continuum) reduces our sample to 224846 galaxies. In this last sample we count 34307 galaxies without H, 12455 without [OIII] and 2840 without both lines, which represents 22% of the sample. These galaxies were systematically discarded by Cid Fernandes et al. (2010) in their recent study about the “forgotten” population of weak line galaxies (WLGs). Note also that since our galaxies have S/N they do not classify as WLGs.
In Figure 1 we show the NII diagram for the NELGs with the emission lines missing. 62.3% of the galaxies without [OIII] falls on the AGN side of the NII diagram (to the right of separation line at -0.3 in [NII]/H). This fraction increases to 91% for the galaxies without both lines and 93% for the galaxies without H. Therefore, most of the NELGs with emission lines missing are AGNs. These results differ significantly from what Cid Fernandes et al. (2010) have obtained. They found very few WLG are AGNs. This suggests that the absence of emission lines points to a different nature for the galaxies.
Most of the NELGs with emission lines missing have EW below Log(EW[NII]): 77% without [OIII], 94% without H and 98% without both lines. By definition, the EW is the ratio between the flux in the emission line and the flux in the adjacent continuum. This parameter is consequently sensitive to the luminosity of the emission line and to the underlying stellar population. A small value of EW suggests the galaxies have an early-type morphology (see the article by Torres-Papaqui et al. in this proceeding), and/or that the emission line has a low luminosity. This is confirmed in Figure 1 where it is seen that the H luminosity decreases with the EW. The median H luminosity below Log(EW[NII]) is that of the galaxies without H, which is 5.61039 erg s-1. This property categorizes these galaxies as Low Luminosity AGNs (LLAGNs).
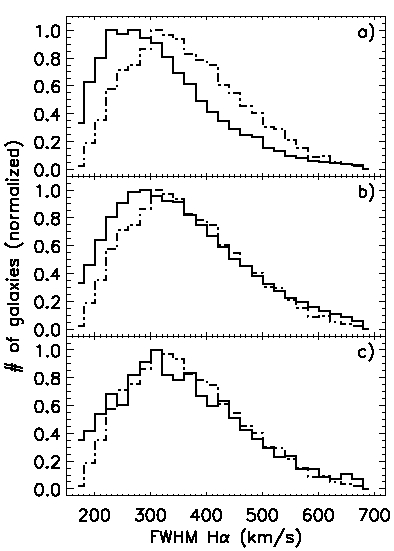
Figure2 shows that the NELGs with emission lines missing have broad FWHM, similar to luminous AGNs. After correction for the resolution of the instrument, the FWHM values fall between 170 up to 700 km s-1. A higher fraction of the galaxies without [OIII] have lower FWHM, which is consistent with the high number of TOs and SFGs in this sample. The FWHM seems like another good criterion to separate AGNs from SFGs.
We have found the NELGs with emission lines missing to be in majority LLAGNs. Therefore, this characteristics–the absence of emission lines–could be taken as the signature of LLAGNs in the nearby universe (Coziol et al. 1998). Summing all the luminous AGNs with the LLAGNs and TOs in our sample suggests that almost half of the NELGs in the nearby universe are AGNs (Miller et al. 2003). This result seems now much more consistent with the high number of QSOs observed at high redshifts. This observation may support the standard interpretation of AGNs (independent of their luminosity) as galaxies with active black holes in their nucleus.
We also acknowledge support from PROMEP (Grant No. 103.5-10-4684).
References
- Adelman-McCarthy et al. (2007) Adelman-McCarthy J.K. et al. 2007, ApJS, 172, 634
- Baldwin et al. (1981) Baldwin, J.A., Phillips, M.M., & Terlevich, R., 1981, PASP, 93, 5
- Cid Fernandes et al. (2005) Cid Fernandes, R., Mateus, A., Sodré, L., Stasińska, G., & Gomes, J.M., 2005, MNRAS, 348, 363
- Coziol et al. (1998) Coziol, R., Ribeiro, A.L.B., de Carvalho, R.R., & Capelato, H.V., 1998, ApJ, 493, 563
- Greene & Ho (2006) Greene, J.E., Ho, L.C., 2006, ApJ, 641, 117
- Martínez et al. (2008) Martínez, M.A., del Olmo, A., Coziol, R., & Focardi, P., 2008, ApJ, 678, L9
- Martínez et al. (2010) Martínez, M.A., del Olmo, A., Coziol, R., & Perea, J., 2010, AJ, 139, 1199
- Phillips et al. (1986) Phillips, M.M., Jenkins, C.R., Dopita, M.A., Sadler E.M., & Binette, L., 1986, AJ, 91, 1062
- Veilleux & Osterbrock (1987) Veilleux, S., & Osterbrock, D.E., 1987, ApJS, 63, 295