1 \YearpublicationYear of publication \YearsubmissionYear of submission \MonthMonth of publication \VolumeVolume \IssueIssue \DOIDOI 11institutetext: Institute of Solar-Terrestrial Physics SB RAS Irkutsk, Russia
Induced MHD oscillations of fine loop structures located in coronal hole.
Abstract
Many phenomena seen in solar atmosphere are connected with underphotospheric processes. MHD oscillation and other dynamical processes observed in quit sun objects are, for example, these phenomena. In our research we use Stereo Behind EUV(171Å and 304Å) observations to study dynamical processes in quiet Sun regions. We found an eruption event in a coronal bright point on the border of a small coronal hole close to the center of the Solar disk. Several oscillating loops became visible inside of the hole after the eruption. We suppose that these loops oscillation were induced by the eruption process in coronal bright point. The nature of interaction transfer agent is unclear because any propagating disturbance was not detected. For data processing we used Pixelize wavelet filtration (PWF method) and Time-distance plots. We measured the supposed interaction transfer speed and found it about 2-3 km/s. We tried to find out the nature of the interaction transfer agent.
keywords:
Sun: corona; Sun: oscillations; Sun: UV radiation; Sun: corona; Sun: helioseismology1 Introduction
Dynamical events observed in quiet Solar corona are often connected with photospheric and underphotospheric processes. Innes et al.[[1]] studied small scale eruptive events called Mini CME and showed that they are connected with supergranular flows.
For our research we use data obtained by STEREO mission. It s on-board instrument SECCHI provides the combination of high spatial resolution good sensibility and relatively high cadence. This allows us to study dynamical processes in small scale quiet Sun objects, such as coronal bright points and small coronal loops.
2 Observations
We use STEREO 171Å image sequence from 02:00 till 12:00 July 7, 2010. The 171Å observations have the highest cadence (2.5 min) for this date.
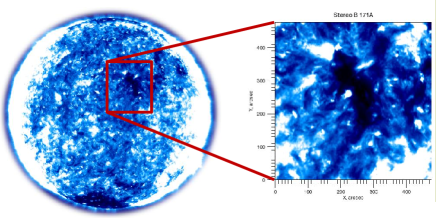
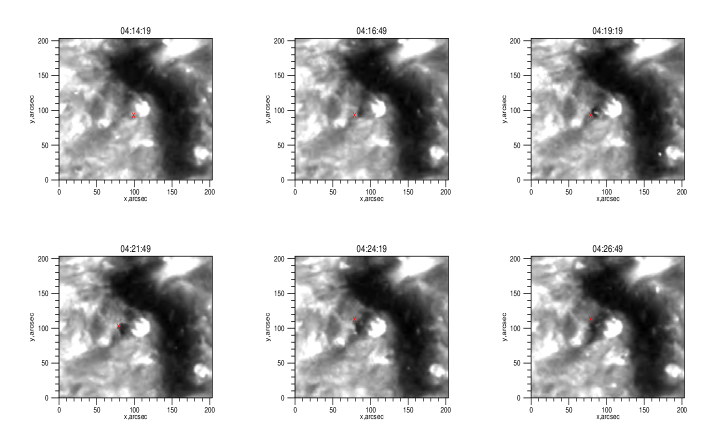
We select a small coronal hole close to the center of the Solar disk on STEREO Behind images(fig 1). A coronal bright point is located on the left border of the hole. We detected a sequence of eruptive events in the coronal point at 04:16, 05:51 and 06:54 UT. And at last the coronal bright point disappeared from EUVI images (08:36 - 08:44 UT). These events are illustrated on fig. 2.
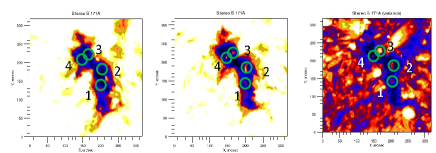
Four oscillating loops appeared inside of the coronal hole after eruption events. The images of the hole before and after eruption events are given on fig. 3.
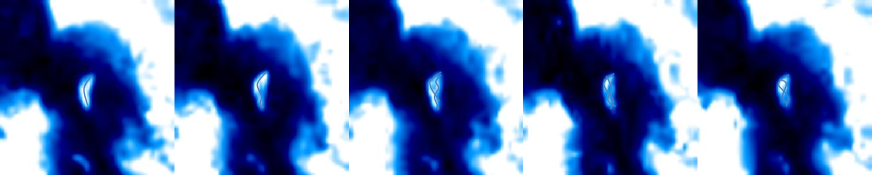
We found 2 types of oscillations inside the loops. The first type is propagating along the loop wave which is visible as brightness variation. The second type can be a kink mode. Fig. 4 illustrates oscillations in the loop number 2.
For each loop we have measured oscillation periods and starting time by the wavelet transform technique. You can find detailed information about wavelet transform and its application for studying oscillation in solar atmosphere in paper [[2]]. The wavelet spectrum of the emission from loop 2 is shown on Fig. 5.
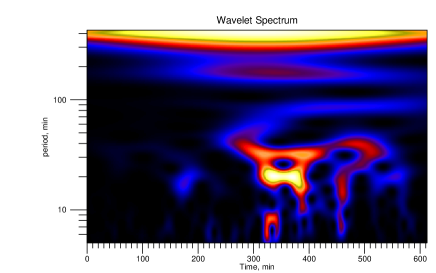
We can see two horizontal stripes on the spectrum. They correspond to oscillation with periods of 20 and 30 min. We also can determine when oscillation started and when they stopped. Oscillations start and stop time as well as their periods are presented in the table 1.
| Loop number | 1 | 2 | 3 | 4 |
|---|---|---|---|---|
| Start time, UT | 06:10 | 06:10 | 08:00 | 06:30 |
| Periods, min | 30 | 20 and 35 | 25 and 60 | 15 and 35 |
3 Interaction transfer speed measurement
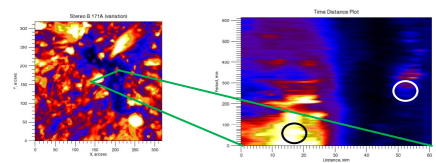
An eruptive event was detected on the border of the coronal hole. It was followed by the loop oscillations under discussion. We assume that the eruption caused loop oscillation inside coronal hole. We measured distances between eruption center and oscillating loops for investigating this hypothesis. We also measured time shifts between the eruption start and the start of loops oscillations. Distances and time shifts allow us to calculate interaction transfer speeds. We use time distance plots to measure distances and time shifts. This method is illustrated on Fig. 6. We use the intensity profile of the data cube along the line connecting the coronal bright point and the oscillating loop. Horizontal axis is distance, vertical axis is time. Using the time-distance plot, we can measure distances and time shifts between processes. Measured time shifts, distances and interaction transfer speeds are given in the table 2.
| Loop number | 1 | 2 | 3 | 4 |
| Time shift, min | 200 | 200 | 300 | 250 |
| Distance, Mm | 32 | 35 | 40 | 34 |
| Interaction speed, | 2.7 | 2.9 | 2.2 | 2.3 |
4 Discussion
Longitude and kink oscillation have been detected in small scale loop structure inside coronal hole. The different loops have different oscillation periods about 15-30 minutes. It is shown that these oscillations appear in several places of coronal hole after eruptive process in coronal bright point on the border of the hole. We also note that loop structures had not been visible on EUV images before oscillations started. We have measured distances between Eruptive event and oscillating loops. We also have measured time shifts between oscillation start in each loop structures and eruptive event in coronal bright point. The speed of supposed propagating agent was found to be almost the same for all loops (2-3 ). We made a conclusion that the oscillations were initiated by eruptive process in coronal bright point and the interaction transfer agent is same for all four loops. Interaction transfer speed is much lower than estimated sound speed in solar corona (173 for 171Å line forming temperature). It means that only slow mode MHD waves are allowed. But this mode can’t propagate across magnetic field lines (in coronal hole magnetic field lines are open and almost perpendicular to the solar surface and to the direction of the supposed disturbance propagation). We have not detected any propagating atmospheric disturbance in 171Å , 195Å and 304Å data. This is an argument for the underphotospheric or photospheric nature of the disturbance agent. We made a conclusion that the transfer agent can be photospheric gravitational wave or underphotospheric propagating disturbance .
References
- [1] D. E. Innes, A. Genetelli, R. Attie, and H. E. Potts. Quiet Sun mini-coronal mass ejections activated by supergranular flows. Astronomy and Astrophysics, 495(1):319–323, Февраль 2009.
- [2] R. A. Sych and V. M. Nakariakov. The Pixelised Wavelet Filtering Method to Study Waves and Oscillations in Time Sequences of Solar Atmospheric Images. Solar Physics, 248(2):395–408, Август 2007.