Suzaku diagnostics of the energetics in the lobes of the giant radio galaxy 3C 35
Abstract
The Suzaku observation of a giant radio galaxy 3C 35 revealed faint extended X-ray emission, associated with its radio lobes and/or host galaxy. After careful subtraction of the X-ray and non-X-ray background and contaminating X-ray sources, the X-ray spectrum of the faint emission was reproduced by a sum of the power-law (PL) and soft thermal components. The soft component was attributed to the thermal plasma emission from the host galaxy. The photon index of the PL component, where the first and second errors represent the statistical and systematic ones, was found to agree with the synchrotron radio index from the lobes, . Thus, the PL component was attributed to the inverse Compton (IC) X-rays from the synchrotron electrons in the lobes. The X-ray flux density at 1 keV was derived as nJy with the photon index fixed at the radio value. The X-ray surface brightness from these lobes ( nJy arcmin-2) is lowest among the lobes studied through the IC X-ray emission. In combination with the synchrotron radio flux density, Jy at 327.4 MHz, the electron energy density spatially averaged over the lobes was evaluated to be the lowest among those radio galaxies, as ergs cm-3 over the electron Lorentz factor of – . The magnetic energy density was calculated as ergs cm-3, corresponding to the magnetic field strength of G. These results suggest that the energetics in the 3C 35 lobes are nearly consistent with equipartition between the electrons and magnetic fields.
Subject headings:
radiation mechanisms: non-thermal — magnetic fields — X-rays: galaxies — radio continuum: galaxies — galaxies: individual (3C 35 (catalog ))1. Introduction
The lobes of radio galaxies and quasars accumulate the kinetic energy of their jets, after it is converted to those of the particles and magnetic fields through the terminal hot spots. Accordingly, the lobes are observed as sources of strong synchrotron radio emission, produced by interplay between the relativistic electrons and magnetic fields. These electrons inevitably emit X-ray and -ray photons, by inverse Compton (IC) scattering off the cosmic microwave background (CMB) radiation (Harris & Grindlay, 1979). A comparison of the IC X-ray and synchrotron radio intensities successfully disentangles the energy densities of the electrons and magnetic fields, and , in the lobes, which provide a clue to the past activity of the jets and nucleus, and their evolution.
Since the discovery of the IC X-ray emission from the lobes of Fornax A with ASCA (e.g., Kaneda et al., 1995) and ROSAT (Feigelson et al., 1995), tremendous progress was achieved by this method with Chandra (e.g., Isobe et al., 2002; Croston et al., 2005) and XMM-Newton (e.g., Isobe et al., 2005, 2006; Migliori et al., 2007), on the energetics in the lobes of radio galaxies. A number of studies (e.g., Isobe et al., 2002; Croston et al., 2005) suggested an electron dominance of – in the lobes. Correspondingly, the magnetic field was found to be weaker than that expected from the minimum energy condition by several factors.
Among radio galaxies, those with lobes evolved to a linear size larger than Mpc are usually called as giant radio galaxies. Based on the spectral aging technique, they are suggested to be relatively old sources (a typical spectral age of Myr; Schoenmakers et al., 2000). Therefore, the giant radio galaxies are utilized to probe a late phase in the evolution of jets and radio sources. However, the current IC X-ray studies on the lobe energetics are concentrated on smaller sources with a total dimension of – kpc, and only a few IC X-ray results are reported for giant radio galaxies (e.g., Konar et al., 2010).
For the X-ray study on the extended sources, including giant radio galaxies (e.g., Mpc corresponding to at the redshift of ), the X-ray Imaging Spectrometer (XIS; Koyama et al., 2007) onboard Suzaku (Mitsuda et al., 2007) is regarded as the best observatory, thanks to its low and stable background level (Tawa et al., 2008), in combination with its large effective area up to 10 keV. By taking advantage of these capabilities, Isobe et al. (2009) have made a successful detection of the IC X-rays with Suzaku from the west lobe of the giant radio galaxy 3C 326 with a size of Mpc. As a result, consistent with lobes of the smaller radio galaxies, the electron dominance of (Isobe et al., 2009) was revealed in this lobe. This result motivated a systematic X-ray study with Suzaku on the lobe energetics to be extended to the lobes of the giant radio galaxies.
Located at the redshift of (Spinrad et al., 1985), 3C 35 is a low-excitation radio galaxy (LERG, Laing et al., 1983; Jackson & Rawlings, 1997) with an elliptical host (Wyndham, 1966). The radio images of 3C 35 revealed its classical Fanaroff-Riley (FR) II morphology (e.g., van Breugel & Jagers, 1982), with a total angular size of , corresponding to kpc at the source rest frame. The spectral age of 3C 35 was estimated as Myr (Orrù et al., 2010), indicating that this radio galaxy is actually an evolved and old source. A moderate radio intensity of the object, Jy at GHz (Laing & Peacock, 1980), in combination with its large physical size, ensures a high IC X-ray intensity. Thus, this giant radio galaxy was selected as a suitable target for a Suzaku observation.
In the present paper, the cosmological constants of km s-1 Mpc-1, , and are adopted. This cosmology gives the luminosity distance of Mpc and the angle-to-size conversion ratio of kpc/, at the redshift of 3C 35.
2. Observation and Data Reduction
2.1. Suzaku Observation
The giant radio galaxy 3C 35 was observed with Suzaku on 2010 January 4 – 6. The XIS was operated in the normal clocking mode with no window option, while the Hard X-ray Detector (Takahashi et al., 2007) was in the normal mode. In order to avoid the lobes of 3C 35 falling on the anomalous columns in the Segment A of the XIS 0 111http://www.astro.isas.jaxa.jp/suzaku/news/2009/0702/, the XIS nominal position for the X-ray telescope (XRT; Serlemitsos et al., 2007) was placed south of the center of its host galaxy, with the satellite roll angle fixed at 222The definition of the roll angle of the Suzaku satellite is described in §7 of ”The Suzaku Technical Description” ; http://heasarc.gsfc.nasa.gov/docs/suzaku/prop_tools/suzaku_td/. In this set up, the whole radio structure of 3C 35 ( in the north-south direction) was safely observed within the clean XIS field of view, without any contamination from the calibration source at the specific corners of the CCD chips.
The data reduction and analysis were performed with the standard software package, HEASOFT 6.8. The X-ray emission from the source is very faint in the HXD bandpass, and only the XIS data are utilized in the present paper. The cleaned event files created in the standard processing were directory utilized, without reprocessing. Correspondingly, the CALDB were utilized, as of 2009 September 25 for the XIS and of 2008 July 09 for the XRT. According to the standard manner, the following criteria were adopted for the data screening; the spacecraft is outside the south Atlantic anomaly (SAA), the time after an exit from the SAA is larger than 436 s, the geometric cut-off rigidity is higher than GV, the source elevation above the rim of bright and night Earth is higher than and , respectively, and the XIS data are free from telemetry saturation. These procedures yielded about ks of good exposure. In the scientific analysis below, those events with a grade of 0, 2, 3, 4, or 6 were accumulated.
2.2. Archival Chandra data
On 2009 March 8 – 9, 3C 35 was observed with the Chandra ACIS (ObsID = 10240). In order to assist in the interpretation of the Suzaku results, the Chandra data in this observation were analyzed. All the data were reprocessed in the standard manner to create the new level 2 event file, with the CIAO 4.2 software package, referring to CALDB 4.2.1. The acis_detect_afterglow correction was removed, and a “new” bad pixel file created by the acis_run_hotpix tool was applied. Because the background level was found to be stable during the observation, no additional data screening was performed to the new level 2 event file. As a result, the good exposure became ks for the observation. In the following analysis, the grade selection same as for the Suzaku XIS data (i.e., 0, 2, 3, 4, or 6) was adopted.
3. Results
3.1. X-ray Image
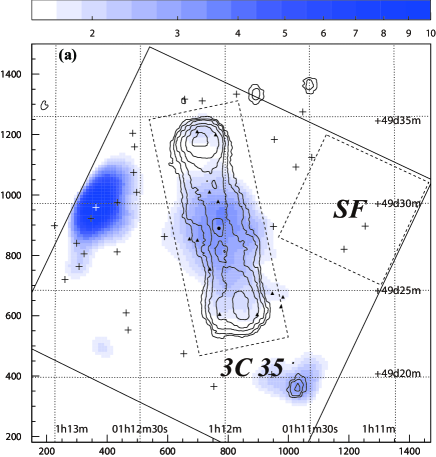
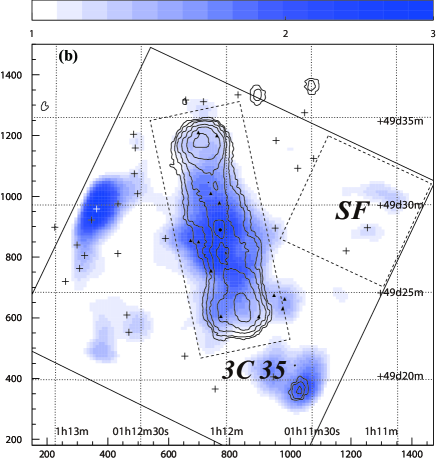
The background-inclusive Suzaku XIS images of 3C 35, in the soft ( – keV) and hard ( – keV) bands, are shown in the panels (a) and (b) of Figure 1, respectively, after being heavily smoothed with a two-dimensional Gaussian kernel of a radius. On the XIS images, the 608.5 MHz radio contour map (Leahy et al. unpublished) 333 Taken from “An Atlas of DRAGNs”, edited by Leahy, Bridle, & Strom; http://www.jb.man.ac.uk/atlas/. are superposed. A systematic offset of was noticed in the XIS coordinate, which may be regarded to be within the current systematic uncertainties in the XIS position determination (Uchiyama et al., 2008). The XIS image was shifted, by referring to the position of a bright serendipitous X-ray source within the XIS field of view, 1RXS J+ (Voges et al., 2000, ;the white cross in the XIS image), which was determined by the Chandra ACIS to be located at (R.A., DEC) = (, ) with an error of .
The XIS images suggest that the X-ray emission from the nucleus of 3C 35 (the filled circles on the XIS images) was weak. Instead, in these images, faint and possibly diffuse X-ray emission, apparently associated with 3C 35, is clearly detected. In the soft X-ray image (panel a of Figure 1), the faint emission appears to be somewhat concentrated around the 3C 35 nucleus or its host galaxy. From this spatial distribution, the soft component is suggested to originate from the thermal plasma in the 3C 35 host galaxy. In contrast, the hard band X-ray image seems to be more elongated along the radio lobes of 3C 35, as is seen in the panel (b) of Figure 1. This indicates that the emission from the radio electrons in the lobes has a significant contribution to the hard band XIS image.
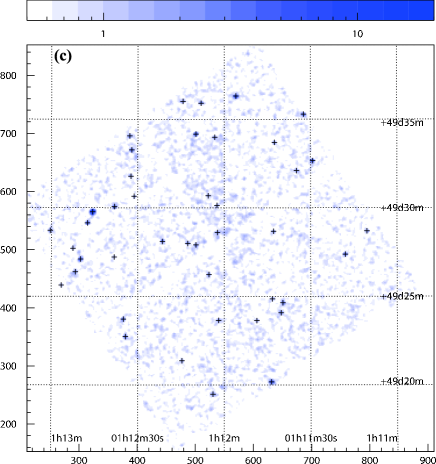
The XIS image is thought to be inevitably contaminated by faint point-like X-ray sources, which were unresolved with the XIS spatial resolution (a half power diameter of ; Serlemitsos et al., 2007). In order to search for those contaminant X-ray sources, the – keV Chandra ACIS images of the same sky field is shown in the panel (c) of Figure 1. Using the CIAO tool wavdetect, 42 X-ray sources were detected in the ACIS image, including 1RXS J+ mentioned above, and they are overlaid on the XIS images. Because several sources appear to contaminate the diffuse X-ray emission detected with the XIS, the contribution from these sources should be considered adequately in the spectral analysis below. It is consistent with the XIS result that the 3C 35 nucleus was rather faint in the Chandra observation, as is investigated in §3.2.2.
3.2. X-ray Emission Associated with 3C 35
In this section, the Suzaku XIS spectrum of the faint X-ray emission associated with the lobes and host galaxy of 3C 35 is carefully examined. For this purpose, the impact of the background and contaminating point sources is taken into account step by step.
3.2.1 Suzaku spectrum of the source free region
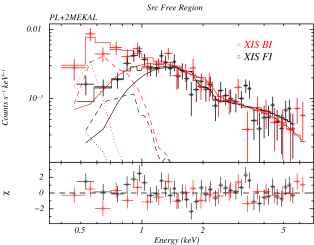
In order to examine the X-ray spectrum of the diffuse emission with a low surface brightness, like that associated with the lobes and host galaxy of 3C 35, it is of crucial importance to determine accurately the X-ray background (XRB) level. Therefore, in the fist step, the XRB spectrum in this field was examined, referring to Isobe et al. (2009). The XRB signal events were accumulated from the source free (SF) region, which is shown with the dashed square denoted as SF in Figure 1. This region was selected to avoid the XIS 0 anomalous columns located to the south of 3C 35. The spectrum of the non-X-ray background (NXB) was estimated by the HEADAS tool xisnxbgen. The accuracy of the tool is reported to be better than % in the 1 – 7 keV range, for a typical exposure of ks (Tawa et al., 2008). Figure 2 shows the NXB-subtracted XRB spectrum in this field. The SF region is unfortunately irradiated with a radioactive calibration source (55Fe) for the front-illuminated (FI) CCD chip of the XIS (XIS 0 and 3; Koyama et al., 2007). Therefore, the FI data are limited below keV, while those from the backside-illuminated (BI) CCD chip (XIS 1) were utilized up to keV.
| Parameter | Value |
|---|---|
| ( cm-2) | ccFixed at the Galactic value. |
| ddTaken from Kushino et al. (2002). | |
| (ergs cm-2 s-1 sr-1) aaThe observed 2 – 10 surface brightness of the PL component. | |
| (keV) | eeTaken from Lumb et al. (2002). |
| (keV) | eeTaken from Lumb et al. (2002). |
| (ergs cm-2 s-1 sr-1) bbThe observed 0.5 – 2 keV surface brightness of the sum of the 2 MEKAL components. | |
It is widely known that the XRB spectrum in the 0.2 – 10 keV range is decomposed into a hard power-law (PL) component with a photon index of (Kushino et al., 2002), and a two-temperature soft thermal plasma emission with temperatures of keV and keV (Lumb et al., 2002). The hard PL component, which is reported to exhibit only a small spatial fluctuation in its surface brightness (%; Kushino et al., 2002), is thought to be dominated by unresolved faint sources, such as distant active galactic nuclei. In contrast, the soft thermal component, with a significant field-to-field intensity variation, is thought to be associated with the Galaxy.
The XIS spectrum of the XRB in the field was fitted with a composite model consisting of a PL component with the photon index fixed at and of two soft MEKAL (e.g., Mewe et al., 1985) ones with the temperatures fixed at keV and keV. All the components were subjected to a photoelectric absorption with the Galactic hydrogen column density in the direction of 3C 35 ( cm-1; Kalberla et al., 2005). Because the result was found to be insensitive to the metalicity of the MEKAL components, the solar abundance ratio was adopted. The tool xisrmfgen was adopted to calculate response matrix functions (rmf) of the XIS. Auxiliary response files (arf) were generated by xissimarfgen (Ishisaki et al., 2007), assuming a diffuse source with a radius and a uniform surface brightness distribution.
An acceptable fit () was obtained by the model, with the parameters summarized in table 1. The total absorption-inclusive surface brightness of the XRB was measured as ergs cm-2 s-1 sr-1, in the 0.5 – 10 keV range. It is important to note that the 2 – 10 keV surface brightness of the hard PL component, ergs cm-2 s-1 sr-1, was found to be perfectly consistent with the result in Kushino et al. (2002), ergs cm-2 s-1 sr-1. Therefore, this result ensures that the best-fit XRB model is safely adopted for the spectrum of 3C 35, in combination with the NXB spectrum reproduced by xisnxbgen.
3.2.2 Chandra spectrum of contaminating sources
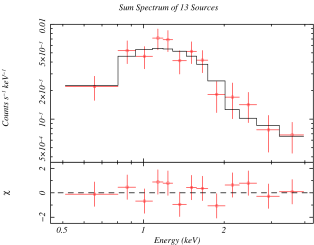
In the next step, the contamination from the X-ray point sources detected with Chandra is evaluated. The low signal statistics with the Chandra ACIS prevented us from analyzing the X-ray spectra of the individual sources. Therefore, the 13 sources, which are thought to contaminate significantly, are selected, and the sum of their spectra was analyzed. These sources are shown with the triangles and circle (the 3C 35 nucleus) in Figure 1, and their positions and ACIS count rates are tabulated in Table 2. The contribution from the other sources to the XIS spectrum of 3C 35 discussed in §3.2.3 is estimated to be less than % of the sum flux of the 13 sources, and so is regarded to be negligible.
| (R.A., Dec) | aaThe position error in arcsec | SignalbbThe 0.3 – 10 keV count rate of the source in the unit of counts s-1 |
|---|---|---|
| (, ) | ||
| (, ) | ||
| (, ) | ||
| (, ) | ||
| (, ) | ||
| (, ) | ||
| (, ) | ||
| (, ) | ||
| (, ) ccCorresponding to the nucleus of 3C 35. | ||
| (, ) | ||
| (, ) | ||
| (, ) | ||
| (, ) |
The ACIS events were integrated within a circle with a radius centered on each source, while the background ones were derived from neighboring source free regions each with a radius. The rmf and arf were generated the CIAO tools mkacisrmf and mkarf, respectively, for the individual sources, and they are simply averaged. Figure 3 shows the summed ACIS spectrum of the 13 sources in the – keV range. It is described with a single PL model with parameters listed in Table 3. The absorption column density is found to be consistent with the Galactic value within the statistical errors, while the photon index was similar to the typical value for active galactic nuclei. Thus, the result appears to be consistent with a picture that these sources are dominated by distant active galaxies. The summed flux in 0.5 – 5 keV was derived as ergs cm-2 s-1, without removing the absorption.
Adopting this best fit model, the count rate of the 3C 35 nucleus in 0.3 – 10 keV shown in Table 2 was converted to the 2 – 10 keV X-ray luminosity of ergs s-1. This value is at the lower end of the X-ray luminosities of typical LERGs (Hardcastle et al., 2009). Even if a heavy obscuration of cm-2, like in the case of narrow line radio galaxies (Hardcastle et al., 2009), is assumed, the absorption-corrected X-ray luminosity is estimated as at most ergs s-1 in the 2 – 10 keV range. Thus, the 3C 35 nucleus is suggested to be relatively inactive, or radiatively inefficient.
| Parameters | Value |
|---|---|
| ( cm-2) | |
| ( ergs cm-2 s-1) aaThe observed X-ray flux in 0.5 – 10 keV. | |
3.2.3 Suzaku spectrum of 3C 35
Finally, the Suzaku XIS spectrum of the faint diffuse X-ray emission, associated with 3C 35 was integrated within the rectangle, denoted as 3C35 in Figure 1. This region was carefully determined to include the whole radio structure of 3C 35. Figure 4 shows the XIS spectrum of 3C 35, after subtracting the NXB spectrum in the region simulated by the xisnxbgen tool. The data and NXB count rates in the 0.7 – 7 keV range were measured as counts s-1 and counts s-1, respectively, per one FI CCD chip, while those with the BI chip were derived as counts s-1 and counts s-1. Here, only the statistical errors are shown. Thus, a statistically significant signal was detected above the NXB, with the 0.7 – 7 keV FI and BI count rates of counts s-1 and counts s-1, respectively. The signal count rate is considerably larger than the typical NXB uncertainty of % (Tawa et al., 2008), corresponding to the FI and BI count rates of counts s-1 and counts s-1.
| Parameters | Case 1 | Case 2 | ||||
|---|---|---|---|---|---|---|
| ( cm-2) | 1.21bbFixed at the Galactic Value. | 1.21bbFixed at the Galactic Value. | ||||
| 1.7 ccFixed at the radio synchrotron index. | ||||||
| (nJy) | ||||||
| (keV) | ||||||
| ( ergs s-1)ddAbsorption-corrected 0.5 – 10 keV luminosity of the MEKAL component. | ||||||
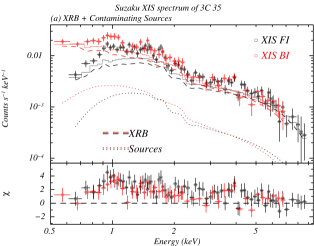
In the panel (a) of Figure 4, the NXB-subtracted XIS spectrum of 3C 35 is compared with the contributions from the XRB and contaminating sources. The best-fit model to the XRB spectrum determined in §3.2.1, was convolved with the arf and rmf of the 3C 35 region, which were calculated in the similar manner to the SF region. The – keV FI and BI count rates of the XRB were estimated as counts s-1 and counts s-1, respectively. For the individual sources considered in §3.2.2, the arfs were calculated, and averaged according to the Chandra ACIS count rates. The best-fit Chandra model to the sum spectrum of the contaminating sources are convolved with the averaged arf and rmf, to derive the FI and BI count rates of counts s-1 and counts s-1, respectively. As a result, significant excess has remained with the FI and BI count rates in – keV of counts s-1 and counts s-1, respectively, over the contribution from the XRB and contaminating sources. This excess is clearly seen in the residual spectrum in the panel (a) of Figure 4. Here and hereafter, the first error is due to the signal statistics of the 3C 35 region, while the errors from all the other components, including those from the NXB, XRB, contaminating sources and so forth, were propagated to the second one.
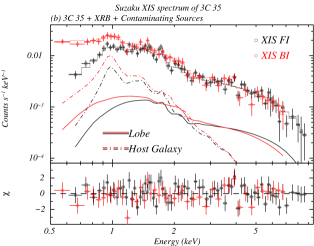
In order to reproduce the excess X-ray spectrum from 3C 35, a composite model consisting of PL and MEKAL components, both of which were subjected to the Galactic absorption ( cm-1), was utilized. Based on the XIS image in Figure 1, the PL component was introduced to describe the emission to be associated with the lobes of 3C 35, while the MEKAL component corresponds to the thermal plasma emission from the host galaxy. The metal abundance in the MEKAL model was fixed at 0.3 times the solar value, the typical value for nearby elliptical galaxies (e.g., Matsushita et al., 2000). The arf for the PL component was created by assuming a uniform rectangular emission region with size of , based on the radio image (Orrù et al., 2010). A point-like X-ray source at the center of the host galaxy was simply adopted, for the calculation of the MEKAL arf. Here, the lobe arf is estimated to be smaller then the point source one, by – % in 0.7 - 7 keV. As revealed by the Chandra data, the nucleus of 3C 35 was so faint that it was already taken into account as one of the contaminating sources.
As shown in the panel (b) of Figure 4, the PL+MEKAL model is found to reproduce the excess spectrum () with the parameters tabulated in Table 4 (Case 1). However, the errors from the model appear to be considerably large, since the two spectral components were strongly coupled to each other. The best-fit photon index of the PL component, , was found to be consistent with the synchrotron radio photon index from the lobe ( between – MHz; Orrù et al., 2010), and was fixed at this value. The model again became acceptable (), giving the best-fit parameters in Table 4 (Case 2). The flux density at 1 keV of the PL component was derived as nJy. The MEKAL temperature was measured as keV, while its absorption-corrected 0.5 – 10 keV luminosity was evaluated as ergs s-1, at the redshift of 3C 35 ().
4. Discussion
The Suzaku XIS image shown in Figure 1 revealed faint extended X-ray emission associated with the host galaxy and radio lobes of 3C 35. After carefully subtracting the NXB, XRB, and the contamination from faint X-ray sources detected with Chandra, the Suzaku XIS spectrum from 3C 35 was decomposed into the PL and MEKAL components, as is displayed in Figure 4. The PL component is found to dominate the MEKAL one above keV. In combination with the XIS images (Figure 1), in which the X-ray emission appears to be more extended along the radio lobes in the hard ( – keV) X-ray band, the PL component is regarded as emission from the lobes. The spectral energy distribution of the synchrotron radio emission and the X-ray PL component from 3C 35 is shown in Figure 5. The agreement between the X-ray photon index and the radio synchrotron one (; Orrù et al., 2010) supports an interpretation that the X-ray PL component is attributed to the IC emission from the electrons in the lobes, which are also radiating the synchrotron radio photons. Based on the flux density at 1 keV of nJy, derived when the photon index was fixed at , and the large angular size (), the lobe X-ray surface brightness is measured as nJy arcmin-2, which is amongst the faintest to be studied through IC X-ray emission to date (e.g., Isobe et al., 2009).

In contrast, the XIS image in the soft band ( – keV) suggests that the origin of the MEKAL component is a thermal plasma emission from the host galaxy, although an interpretation that it is originated from the possible group of galaxies surrounding the host galaxy is not rejected from the XIS data alone. The Chandra data could potentially help to resolve the diffuse emission, whose spatial extent is smaller than the XIS point spread function. Since the nucleus of 3C 35 is located close the gap of the ACIS chip (see the panel (c) of Figure 1), the analysis of the Chandra data immediately around 3C 35 is regarded to be difficult, and beyond the scope of the present paper. The X-ray luminosity of the MEKAL component, ergs s-1, derived with the PL photon index of , is found to be lower by a factor of than those anticipated for its temperature, keV, from the luminosity-temperature relation of nearby clusters/groups of galaxies (e.g, Xue & Wu, 2000; Fukazawa et al., 2004; Osmond & Ponman, 2004). These two quantities are instead rather consistent with the luminosity-temperature relation of nearby elliptical galaxies (e.g., Matsushita et al., 2000; Fukazawa et al., 2004). In addition, 3C 35 was not suggested to be in a rich cluster environment (McHardy, 1974). Thus, the host galaxy interpretation is thought to be more preferable for the MEKAL component. It is important to note that any contamination from this component to the PL one is insignificant, as long as the photon index is fixed at .
| Parameters | Value | Comments |
|---|---|---|
| (nJy) | Case 2 in Table 4 | |
| (Jy) | at MHz | |
| between MHz and MHz | ||
| ( cm3) | ||
| ( ergs cm-3) aaThe first and second errors represent the statistical and systematic ones, respectively. | – | |
| – | ||
| ( ergs cm-3) aaThe first error is due to the statistical error of , while all the possible systematics are taken into account in the second error. | ||
| (G) aaThe first error is due to the statistical error of , while all the possible systematics are taken into account in the second error. | ||
| aaThe first error is due to the statistical error of , while all the possible systematics are taken into account in the second error. | – | |
| – |
There are several seed photon candidates for the IC X-rays in lobes of radio galaxies, including the CMB radiation (Harris & Grindlay, 1979), infrared (IR) photons from the nucleus (e.g., Brunetti et al., 1997), and the synchrotron radiation from the lobes themselves. At the redshift of 3C 35 (), the CMB energy density is calculated as ergs cm-3. From the upper limit on the IR flux of the 3C 35 nucleus of mJy at 12 m (Golombek et al., 1998), the nuclear IR photons are estimated to have an energy density of ergs cm-3, where is the distance from the nucleus, assuming the emission from the nucleus is isotropic. Except for the central region ( kpc), the nuclear IR photons are found to be unimportant. The synchrotron photons are fully negligible, since the radio flux density of 3C 35 ( Jy at MHz; Orrù et al., 2010) gives a synchrotron photon energy density of ergs cm-3 averaged over the lobes. Therefore, the CMB radiation is specified as the dominant seed photon source.
In order to diagnose the energetics in the lobes of 3C 35, the synchrotron radio photon index and flux density were derived from the recent result presented in Orrù et al. (2010), as and Jy at MHz, respectively. Correspondingly, the 1 keV IC X-ray flux density of nJy, determined with the photon index fixed at (Case 2 in Table 4), was utilized. The number density spectrum of the radiating electrons is assumed to be a simple PL form of , where is the electron Lorentz factor. From the radio image (Orrù et al., 2010), the shape of the lobe is assumed to be a cylinder, with a radius and height of kpc and kpc, respectively. These give the total volume of the lobes as cm3.
Table 5 summarizes the energetics in the lobes, evaluated by referring to Harris & Grindlay (1979), together with the input observables discussed above. The magnetic energy density spatially-averaged over the lobes of 3C 35 was derived as ergs cm-3, while the electron energy density with the rest mass energy subtracted was estimated as ergs cm-3 for – , corresponding to the electrons observable directly through the synchrotron radio or IC X-ray emission. The first error is from the statistical one in , while in the second error, all the systematic ones from , , (or ), and are considered. Thus, an approximate equipartition condition of is realized in the lobes of 3C 35. As a result, the equivalent magnetic field strength of G is consistent with the equipartition field ( G; Orrù et al., 2010). Even if the minimum Lorentz factor was lowered down to , by referring to Orrù et al. (2010), the energetics in the 3C 35 lobes are found not to deviate significantly from equipartition, as , though with the large errors.
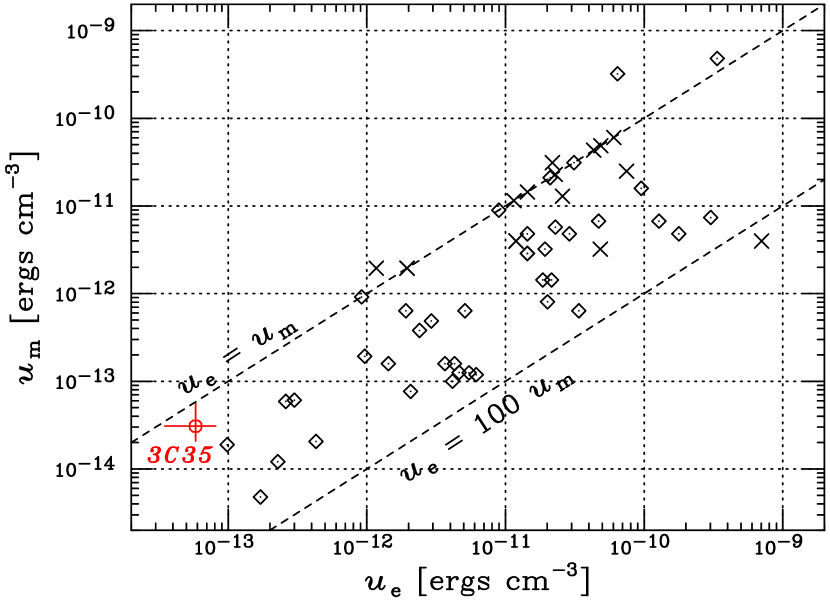
Figure 6 summarizes the relation between and in the lobes of radio galaxies, which were determined through the IC X-ray technique (Croston et al., 2005; Isobe et al., 2009, and reference therein). This diagram indicates that an electron dominance of appears to be typical for the radio galaxies, over orders of magnitude in and . The Suzaku result indicates that the ratio in the lobes of 3C 35 is lower than the typical value, and even consistent with the equipartition, although with relatively large errors. In addition, and in 3C 35 are both located at the lower end of those of the radio galaxies (the lower-left corner in Figure 6). These features of 3C 35 are thought to be related to the fact that it is an old radio source evolved to a size of Mpc, with the spectral age of Myr (Orrù et al., 2010). Especially, is found to be lower by an order of magnitude than the CMB energy density at the rest frame of 3C 35. This result confirms the dominance of IC energy losses over synchrotron ones, which was predicted to be a common property of the giant radio galaxies under the equipartition assumption (Ishwara-Chandra & Saikia, 1999).
In Figure 7, in the lobes is plotted against the total linear size of the radio galaxies. As is pointed out by Isobe et al. (2009), the figure suggests a correlation of in the range of kpc – Mpc (the dashed line in Figure 7). In order to derive this relation, the upper limits (the crosses with an arrow in Figure 7) were neglected. This relation is indicated by the dashed line in Figure 7. It was proposed that the radio galaxies follow this trend while their jets are actively injecting sufficient energy into their lobes, based on the following argument (Isobe et al., 2009). The size of the radio sources is reported to scale roughly as over a wide range of pc – kpc (Nagai, 2008), where is the age of the radio galaxy and its jet. Assuming that the energy input rate is constant in time, the total energy input to the lobes, , is considered to be in proportion to , before radiative cooling becomes dominant. These simple assumptions give the relation of . In contrast, after the jets become inactive and cease the energy transport, in the lobes should decrease due to the adiabatic expansion of the lobes, and to the synchrotron and IC radiation energy losses. Correspondingly, the data points for such sources should deviate downward from the - correlation in Figure 7. Actually, in the lobes of Fornax A which is reported to host a dormant nucleus (Iyomoto et al., 1998; Kim & Fabbiano, 2003), the values of , precisely determined through various X-ray observations (e.g., Isobe et al., 2006; Tashiro et al., 2009), are found to be lower than the trend of the other radio galaxies by one order of magnitude (see Figure 7).
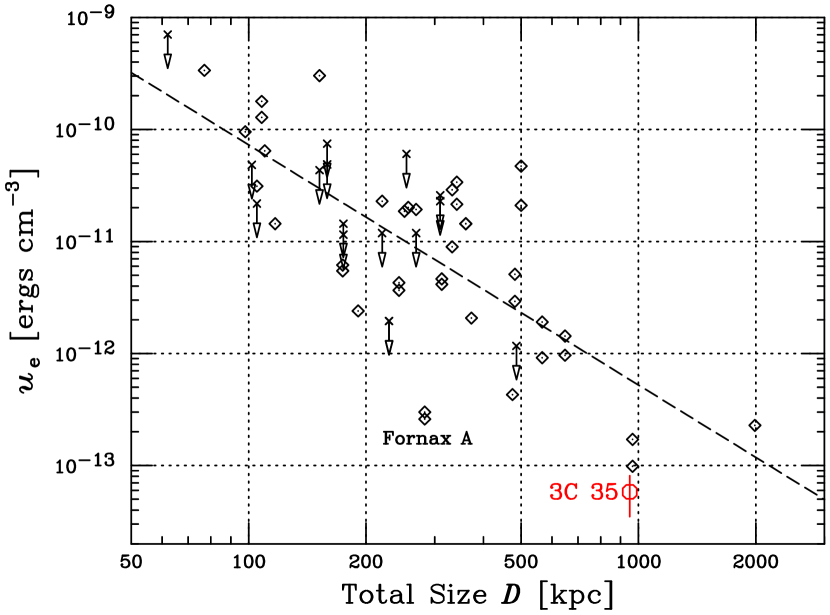
Radio images (e.g., van Breugel & Jagers, 1982; Orrù et al., 2010) have revealed the hot spots in the individual lobes of 3C 35, suggesting that these lobes are still energized by the jets. In spite of this, the data point for the lobes of 3C 35 deviates below by a factor of from the - regression curve in Figure 7, similar to Fornax A. A possible scenario to settle this apparent discrepancy is that the current jet power to the lobes of 3C 35 has become significantly lower than that in the past, as is expected from the smaller and hence younger radio sources with a size of kpc. This idea seems to be supported by the observational fact that no jet feature was detected from the nucleus of 3C 35 (Mullin et al., 2008), even though about % of LERGs exhibited definite/possible jets. This is also compatible with the inactive X-ray nucleus of 3C 35 as a LERG with a 0.5 – 10 keV luminosity of ergs s-1, as is discussed in §3.2.2. Another interpretation is given by a model for dynamical evolution of a radio source (e.g., Kaiser et al., 1997), proposed to interpret the behavior of radio sources on the radio power-size diagram (so-called the - diagram), on which a deficit of luminous giant radio sources is observed. The model predicts that the power of a radio source decreases suddenly on the - diagram due to the dominance of the IC loss without assuming the decline of the jet activity, when the source size reaches Mpc. This prediction qualitatively appears to consistent with the low value of , observed in the lobes of 3C 35. The current X-ray knowledge on the giant radio galaxies is insufficient to distinguish these two possibilities. A systematic X-ray study on giant radio galaxies is necessary.
| Parameters | PL | PL+MEKAL |
|---|---|---|
| ( cm-2) | ||
| (keV) | – | |
| ( ergs cm-2 s-1)aaThe total observed X-ray flux in 0.5 – 5 keV. | ||
Appendix A Suzaku spectrum of 1RXS J+
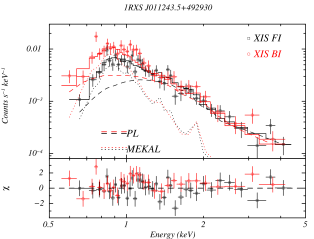
The XIS spectrum of 1RXS J+ (Voges et al., 2000), the brightest source within the XIS FoV, is briefly analyzed, although detailed discussions are beyond the scope of the present paper. The XIS events were extracted from a circle with a radius of centered on the source (the white cross in Figure 1), while the background (NXB+XRB) events were simply taken from a neighboring source free circular region with a radius. The background-subtracted XIS spectrum of 1RXS J+ in the 0.5 – 5 keV range is shown in Figure 8.
The spectrum appears to be rather soft. A simple PL model subjected to a free absorption failed to describe the observed spectrum (). By adding a MEKAL component with the solar abundance, the fit became acceptable with the parameters listed in Table 6. The spectrum gave the MEKAL temperature and PL photon index of (keV) and , respectively. The absorption-inclusive X-ray flux was measured as ergs cm-2 s-1 in 0.5 – 5 keV, although the intrinsic source luminosity can not be evaluated, due to the unknown redshift of the source.
References
- Belsole et al. (2006) Belsole, E., Worrall, D. M., & Hardcastle, M. J., 2006, MNRAS, 366, 339
- Brunetti et al. (1997) Brunetti, G., Setti, G., & Comastri, A., Brunetti, G. & Stanghellini, C. 1997, A&A, 325, 898
- Croston et al. (2005) Croston, J. H., Hardcastle, M. J., Harris, D. E., Belsole, E., Birkinshaw, M., Worrall, D. M., 2005, ApJ, 626, 733
- Evans et al. (2006) Evans, D. E., Worrall, D. M., Hardcastle, M. J., Kraft R. P., & Birkinshow M., 2006, ApJ, 642, 96
- Feigelson et al. (1995) Feigelson, E. D., Laurent-Muehleisen, S. A., Kollgaard, R. I., & Fomalont, E. B., 1995, ApJ, 449, L149
- Fukazawa et al. (2004) Fukazawa, Y., Makishima, K. & Ohashi, T., 2004, PASJ, 56, 965
- Golombek et al. (1998) Golombek, D., Miley, G. K., & Neugebauer, G., 1988,AJ, 95, 26
- Hardcastle et al. (2006) Hardcastle, M. J., Evans, D. A., & Croston, J. H., 2006, MNRAS, 370, 1893
- Hardcastle et al. (2009) Hardcastle, M. J., Evans, D. A., & Croston, J. H., 2009, MNRAS, 396, 1929,
- Harris & Grindlay (1979) Harris, D. E., & Grindlay, J. E., 1979, MNRAS, 188, 25
- Ishisaki et al. (2007) Ishisaki, Y., et al. 2007, PASJ, 59, 113
- Ishwara-Chandra & Saikia (1999) Ishwara-Chandra, C. H., & Saikia, D. J., 1999, MNRAS, 309, 100
- Isobe et al. (2002) Isobe, N., et al., 2002, ApJ, 580, L111
- Isobe et al. (2005) Isobe, N., Makishima, K., Tashiro, M., & Hong, S., 2005, ApJ, 632, 781
- Isobe et al. (2006) Isobe, N., Makishima, K., Tashiro, M., Itoh, K., Iyomoto, N., Takahashi, I., & Kaneda, H., 2006, ApJ, 645, 256
- Isobe et al. (2009) Isobe, N., et al. 2009, ApJ, 706, 454
- Iyomoto et al. (1998) Iyomoto, N., Makishima, K., Tashiro, M., Inoue, S., Kaneda, H., Matsumoto, Y., & Mizuno, T. 1998, ApJ, 503, L31
- Jackson & Rawlings (1997) Jackson, N., & Rawlings, S., 1997, MNRAS, 286, 241
- Kaiser et al. (1997) Kaiser, C. R., Dennett-Thorpe, J., & Alexander, P., 1997, MNRAS, 292, 723
- Kaneda et al. (1995) Kaneda, H., et al., 1995, ApJ, 453, L13
- Kalberla et al. (2005) Kalberla, P. M. W., Burton, W. B., Hartmann, Dap, Arnal, E. M., Bajaja, E., Morras, R., & Poöppel, W. G. L., 2005,A&A, 440, 775
- Kim & Fabbiano (2003) Kim, Dong-Woo, & Fabbiano, G., 2003, ApJ, 586, 826
- Konar et al. (2010) Konar, C., Hardcastle, M. J., Croston, J. H., & Saikia, D. J. 2010, MNRAS, 400, 480
- Koyama et al. (2007) Koyama K., et al., 2007, PASJ, 59, S23
- Kuhr et al. (1979) Kuhr, H., Nauber, U., Pauliny-Toth, I. I. K., & Witzel, A. 1979, A Catalogue of Radio Sources (Bonn: Max-Planck Institut fur Radio Astronomie)
- Kushino et al. (2002) Kushino, A., Ishisaki, Y., Morita, U., Yamasaki, N. Y., Ishida, M., Ohashi, T., & Ueda, Y., 2002, PASJ, 54, 327
- Laing et al. (1983) Laing, R. A., Riley, J. M., & Longair, M. S. 1983, MNRAS, 204, 151
- Laing & Peacock (1980) Laing, R. A., & Peacock, J. A., 1980., MNRAS, 190, 903
- Lumb et al. (2002) Lumb, D. H., Warwick, R. S., Page, M., & De Luca, A., 2002, A&A, 389, 93
- Matsushita et al. (2000) Matsushita, K., Ohashi, T., & Makishima, K., 2000, PASJ, 52, 685
- McHardy (1974) McHardy, I. M., 1974, MNRAS, 169, 527
- Mewe et al. (1985) Mewe, R., Gronenschild, E. H. B. M., & van den Oord, G. H. J. 1985, A&AS, 62, 197
- Migliori et al. (2007) Migliori, G., Grandi, P., Palumbo, G. G. C., Brunetti, G. & Stanghellini, C. 2007, ApJ, 668, 203
- Mitsuda et al. (2007) Mitsuda, K., et al., 2007, PASJ, 59, S1
- Mullin et al. (2008) Mullin, L. M., Riley, J. M., & Hardcastle, M. J., 2008, MNRAS, 390, 595
- Nagai (2008) Nagai, H., 2008, The Astronomical Herald (ISSN 0374-2466), 101, 264
- Orrù et al. (2010) Orrù, E., Murgia, M., Feretti, L., Govoni, F., Giovannini, G., Lane, W., Kassim, N., & Paladino, R. 2010, arXiv:1003.0623
- Osmond & Ponman (2004) Osmond, J. P. F., & Ponman, T. J., 2004, MNRAS, 350, 1511
- Serlemitsos et al. (2007) Serlemitsos, P. J, et al., 2007, PASJ, 59, S9
- Schoenmakers et al. (2000) Schoenmakers, A. P., Mack, K.-H., de Bruyn, A. G., Röttgering, H. J. A., Klein, U.,& van der Laan, H., 2000, A&AS, 146, 293
- Spinrad et al. (1985) Spinrad, H., Marr, J., Aguilar, L., & Djorgovski, S. 1985, PASP, 97, 932
- Takahashi et al. (2007) Takahashi, T., et al., 2007, PASJ, 59, S35
- Tashiro et al. (1998) Tashiro, M., et al., 1998, ApJ, 499, 713
- Tashiro et al. (2001) Tashiro, M., Makishima, K., Iyomoto, N., Isobe, N., & Kaneda, H., 2001, ApJ, 546, L19
- Tashiro et al. (2009) Tashiro M., Isobe, N., Seta H., Yaji, Y., & Matsuta K., 2009, PASJ, 61, S327
- Tawa et al. (2008) Tawa, N., et al., 2008, PASJ, 60, S11
- Uchiyama et al. (2008) Uchiyama et al., 2008, PASJ, 60, S35
- van Breugel & Jagers (1982) van Breugel, W., & Jagers, W., 1982, A&AS, 49, 529
- Voges et al. (2000) Voges, W. et al., 2000, IAU Circ., 7432, 1
- Wyndham (1966) Wyndham, J. D., 1966, ApJ, 144, 459
- Xue & Wu (2000) Xue, Y.-J., & Wu, X.-P. 2000, ApJ, 538, 65