Polarization-Sensitive Quantum Optical Coherence Tomography: Experiment
Mark C. Booth,1 Bahaa E. A. Saleh,2,3 and Malvin Carl Teich1,2,4,∗
1Department of Biomedical Engineering, Boston University, Boston, MA 02215, USA
2Quantum Photonics Laboratory, Department of Electrical & Computer Engineering,
Boston University, Boston, MA 02215, USA
3Quantum Photonics Laboratory, College of Optics and Photonics (CREOL),
University of Central Florida, Orlando, FL 32816, USA
4Department of Electrical Engineering, Columbia University, New York, NY 10027, USA
∗teich@bu.edu
http://people.bu.edu/teich/
Abstract
Polarization-sensitive quantum optical coherence tomography (PS-QOCT) makes use of a Type-II twin-photon light source for carrying out optical sectioning with polarization sensitivity. A BBO nonlinear optical crystal pumped by a Ti:sapphire psec-pulsed laser is used to confirm the theoretical underpinnings of this imaging paradigm. PS-QOCT offers even-order dispersion cancellation with simultaneous access to the group-velocity dispersion characteristics of the interstitial medium between the reflecting surfaces of the sample.
OCIS codes: (110.4500) Optical coherence tomography; (170.4500) Optical coherence tomography; (270.0270) Quantum optics.
References and links
- [1] R. C. Youngquist, S. Carr, and D. E. N. Davies, “Optical coherence-domain reflectometry: A new optical evaluation technique,” Opt. Lett. 12, 158–160 (1987).
- [2] K. Takada, I. Yokohama, K. Chida, and J. Noda, “New measurement system for fault location in optical waveguide devices based on an interferometric technique,” Appl. Opt. 26, 1603–1606 (1987).
- [3] B. L. Danielson and C. D. Whittenberg, “Guided-wave reflectometry with micrometer resolution,” Appl. Opt. 26, 2836–2842 (1987).
- [4] H. H. Gilgen, R. P. Novàk, R. P. Salathé, W. Hodel, and P. Beaud, “Submillimeter optical reflectometry,” J. Lightwave Technol. 7, 1225–1233 (1989).
- [5] D. Huang, E. A. Swanson, C. P. Lin, J. S. Schuman, W. G. Stinson, W. Chang, M. R. Hee, T. Flotte, K. Gregory, C. A. Puliafito, and J. G. Fujimoto, “Optical coherence tomography,” Science 254, 1178–1181 (1991).
- [6] J. M. Schmitt, “Optical coherence tomography (OCT): A review,” IEEE J. Sel. Topics Quantum Electron. 5, 1205–1215 (1999).
- [7] A. F. Fercher and C. K. Hitzenberger, “Optical coherence tomography,” in Progress in Optics, E. Wolf, ed., vol. 44 (Elsevier, Amsterdam, 2002), chap. 4, pp. 215–302.
- [8] A. F. Fercher, W. Drexler, C. K. Hitzenberger, and T. Lasser, “Optical coherence tomography—principles and applications,” Rep. Prog. Phys. 66, 239–303 (2003).
- [9] W. Drexler, “Ultrahigh-resolution optical coherence tomography,” J. Biomed. Opt. 9, 47–74 (2004).
- [10] P. H. Tomlins and R. K. Wang, “Theory, developments and applications of optical coherence tomography,” J. Phys. D: Appl. Phys. 38, 2519–2535 (2005).
- [11] M. E. Brezinski, Optical Coherence Tomography: Principles and Applications (Academic, San Diego, 2006).
- [12] A. M. Zysk, F. T. Nguyen, A. L. Oldenburg, D. L. Marks, and S. A. Boppart, “Optical coherence tomography: A review of clinical development from bench to bedside,” J. Biomed. Opt. 12, 051403 (2007).
- [13] W. Drexler and J. Fujimoto, Eds., Optical Coherence Tomography: Technology and Applications (Springer, Berlin, 2008).
- [14] C. M. Eigenwillig, B. R. Biedermann, W. Wieser, and R. Huber, “Wavelength swept amplified spontaneous emission source,” Opt. Express 17, 18 794–18 807 (2009).
- [15] M. R. Hee, D. Huang, E. A. Swanson, and J. G. Fujimoto, “Polarization-sensitive low-coherence reflectometer for birefringence characterization and ranging,” J. Opt. Soc. Am. B 9, 903–908 (1992).
- [16] B. H. Park and J. F. de Boer, “Polarization-sensitive optical coherence tomography,” in Optical Coherence Tomography: Technology and Applications, W. Drexler and J. Fujimoto, eds. (Springer, Berlin, 2008), chap. 22.
- [17] M. C. Teich and B. E. A. Saleh, “Photon Bunching and Antibunching,” in Progress in Optics, E. Wolf, ed., vol. 26 (North-Holland, Amsterdam, 1988), chap. 1, pp. 1–104.
- [18] M. C. Teich and B. E. A. Saleh, “Squeezed states of light,” Quantum Opt. 1, 153–191 (1989) [Reprinted in Tutorials in Optics, edited by D. T. Moore (Optical Society of America, Washington, D.C., 1992), chap. 3, pp. 29-52].
- [19] M. C. Teich and B. E. A. Saleh, “Squeezed and antibunched light,” Phys. Today 43, No. 6, 26–34 (1990).
- [20] J. Peřina, Z. Hradil, and B. Jurčo, Quantum Optics and Fundamentals of Physics (Kluwer, Boston, 1994), chaps. 7 and 8.
- [21] L. Mandel and E. Wolf, Optical Coherence and Quantum Optics (Cambridge, New York, 1995), chap. 22.
- [22] S. E. Harris, M. K. Oshman, and R. L. Byer, “Observation of tunable optical parametric fluorescence,” Phys. Rev. Lett. 18, 732–734 (1967).
- [23] D. Magde and H. Mahr, “Study in ammonium dihydrogen phosphate of spontaneous parametric interaction tunable from 4400 to 16000 Å,” Phys. Rev. Lett. 18, 905–907 (1967).
- [24] D. N. Klyshko, Photons and Nonlinear Optics (Nauka, Moscow, 1980), chaps. 1 and 6 [Translation: Gordon and Breach, New York, 1988].
- [25] B. E. A. Saleh and M. C. Teich, Fundamentals of Photonics (Wiley, Hoboken, N.J., 2007), 2nd ed.
- [26] T. Larchuk, R. A. Campos, J. G. Rarity, P. R. Tapster, E. Jakeman, B. E. A. Saleh, and M. C. Teich, “Interfering entangled photons of different colors,” Phys. Rev. Lett. 70, 1603–1606 (1993).
- [27] A. F. Abouraddy, M. B. Nasr, B. E. A. Saleh, A. V. Sergienko, and M. C. Teich, “Quantum-optical coherence tomography with dispersion cancellation,” Phys. Rev. A 65, 053817 (2002).
- [28] M. B. Nasr, B. E. A. Saleh, A. V. Sergienko, and M. C. Teich, “Demonstration of dispersion-canceled quantum-optical coherence tomography,” Phys. Rev. Lett. 91, 083601 (2003).
- [29] M. B. Nasr, B. E. A. Saleh, A. V. Sergienko, and M. C. Teich, “Dispersion-cancelled and dispersion-sensitive quantum optical coherence tomography,” Opt. Express 12, 1353–1362 (2004).
- [30] M. B. Nasr, D. P. Goode, N. Nguyen, G. Rong, L. Yang, B. M. Reinhard, B. E. A. Saleh, and M. C. Teich, “Quantum optical coherence tomography of a biological sample,” Opt. Commun. 282, 1154–1159 (2004).
- [31] J. D. Franson, “Nonlocal cancellation of dispersion,” Phys. Rev. A 45, 3126–3132 (1992).
- [32] A. M. Steinberg, P. G. Kwiat, and R. Y. Chiao, “Dispersion cancellation and high-resolution time measurements in a fourth-order optical interferometer,” Phys. Rev. A 45, 6659–6665 (1992).
- [33] A. M. Steinberg, P. G. Kwiat, and R. Y. Chiao, “Dispersion cancellation in a measurement of the single-photon propagation velocity in glass,” Phys. Rev. Lett. 68, 2421–2424 (1992).
- [34] T. S. Larchuk, M. C. Teich, and B. E. A. Saleh, “Nonlocal cancellation of dispersive broadening in Mach–Zehnder interferometers,” Phys. Rev. A 52, 4145–4154 (1995).
- [35] B. I. Erkmen, and J. H. Shapiro, “Phase-conjugate optical coherence tomography,” Phys. Rev. A 74, 041601 (2006).
- [36] J. Le Gouët, D. Venkatraman, F. N. C. Wong, and J. H. Shapiro, “Experimental realization of phase-conjugate optical coherence tomography,” Opt. Lett. 35, 1001–1003 (2010).
- [37] K. J. Resch, P. Puvanathasan, J. S. Lundeen, M. W. Mitchell, and K. Bizheva, “Classical dispersion-cancellation interferometry,” Opt. Express 15, 8797–8804 (2007).
- [38] R. Kaltenbaek, J. Lavoie, D. N. Biggerstaff, and K. J. Resch, “Quantum-inspired interferometry with chirped laser pulses,” Nature Phys. 4, 864–868 (2008).
- [39] M. C. Booth, G. Di Giuseppe, B. E. A. Saleh, and M. C. Teich, “Polarization-sensitive quantum-optical coherence tomography,” Phys. Rev. A 69, 043815 (2004).
- [40] M. C. Booth, “Quantum Imaging of Biological Specimens Using Entangled Photons,” Ph.D. Dissertation, Boston University College of Engineering, 2004.
- [41] C. K. Hong, Z. Y. Ou, and L. Mandel, “Measurement of subpicosecond time intervals between two photons by interference,” Phys. Rev. Lett. 59, 2044–2046 (1987).
- [42] W. P. Grice and I. A. Walmsley, “Spectral information and distinguishability in type-II down-conversion with a broadband pump,” Phys. Rev. A 56, 1627–1634 (1997).
- [43] M. B. Nasr, A. F. Abouraddy, M. C. Booth, B. E. A. Saleh, A. V. Sergienko, M. C. Teich, M. Kempe, and R. Wolleschensky, “Biphoton focusing for two-photon excitation,” Phys. Rev. A 65, 023816 (2002).
- [44] J. A. Izatt, M. R. Hee, G. M. Owen, E. A. Swanson, and J. G. Fujimoto, “Optical coherence microscopy in scattering media,” Opt. Lett. 19, 590–592 (1994).
- [45] F. Marsili, D. Bitauld, A. Fiore, A. Gaggero, F. Mattioli, R. Leoni, M. Benkahoul, and F. Lévy, “High efficiency NbN nanowire superconducting single photon detectors fabricated on MgO substrates from a low temperature process,” Opt. Express 16, 3191–3196 (2008).
- [46] M. B. Nasr, S. Carrasco, B. E. A. Saleh, A. V. Sergienko, M. C. Teich, J. P. Torres, L. Torner, D. S. Hum, and M. M. Fejer, “Ultrabroadband biphotons generated via chirped quasi-phase-matched optical parametric down-conversion,” Phys. Rev. Lett. 100, 183601 (2008).
- [47] A. Hayat, P. Ginzburg, and M. Orenstein, “Observation of two-photon emission from semiconductors,” Nature Phot. 2, 238–241 (2008).
1 Introduction
Optical coherence tomography (OCT).
Optical coherence-domain reflectometry (OCDR) is a high-resolution axial-imaging technique originally developed for optical-fiber and integrated-optics applications [1, 2, 3]. It offers high resolution, typically of the order of m, which is achieved via the use of interferometry and the broad bandwidth of the optical source [4].
With the addition of transverse scanning, this range-finding technique provides cross-sectional images and is called optical coherence tomography (OCT) [5]. Because OCT has the merits of being a non-invasive, non-contact, high-resolution, and rapid procedure, it has revolutionized in vivo biological imaging [5, 6, 7, 8, 9, 10, 11, 12]. It has found widespread use in clinical medicine, particularly in the specialties of ophthalmology, gastroenterology, dermatology, laryngology, cardiology, and oncology [12, 13].
OCT makes use of the second-order coherence properties of a classical optical source to effectively section a reflective or scattering sample with a resolution governed by the coherence length of the source. Sources of short coherence length, with their attendant broad spectral width, provide high resolution. Examples of optical sources used in OCT include superluminescent diodes (SLDs), ultrashort pulsed lasers, wavelength-swept lasers, supercontinuum sources such as photonic-crystal fibers [13], and wavelength-swept amplified-spontaneous-emission (ASE) sources [14].
OCT can be carried out in a number of modalities, including time-domain, Fourier-domain, swept-source, Doppler, spectroscopic, and polarization-sensitive configurations (PS-OCT) [13]. This latter modality, in particular, reveals enhanced information about the birefringence properties of samples endowed with an organized linear structure [15], such as tissues containing a high content of collagen or other elastin fibers, including tendons, muscle, nerve, and cartilage [16]. Indeed, a change in birefringence can be indicative of a change in the functionality, integrity, or viability of biological tissue.
Deleterious effects of dispersion.
The development of improved broadband optical sources has served to enhance OCT resolution. At the same time, however, the larger bandwidth leads to increased sample dispersion that increases the width of the coherence-envelope of the probe beam, which in turn results in a loss of axial resolution and fringe visibility. In the particular case of ophthalmologic imaging, for example, the retinal structure of interest is located behind the thick dispersive ocular medium.
To further improve the sensitivity of OCT, it is useful to implement techniques for handling dispersion. Indeed, a whole host of techniques for mitigating its presence have been developed, ranging from the use of dispersion-compensating optical elements to a posteriori numerical methods. The use of many of these techniques, however, requires an understanding of the character of the dispersion inherent in the sample so that the appropriate optical element or numerical algorithm can be used [7, 9].
Advent of nonclassical light.
Over the past several decades, a number of nonclassical (quantum) sources of light have been developed [17, 18, 19, 20, 21] and it is natural to inquire whether making use of any of these sources might be advantageous for tomographic imaging. An example of such a nonclassical source is spontaneous parametric down-conversion (SPDC) [22, 23, 24], a nonlinear process that generates entangled twin beams of light. Type-I and Type-II SPDC interactions generate light with spectral/spatial and polarization entanglement, respectively [24][25, chap. 21]. Such sources, which are broadband, have been utilized to demonstrate a number of interference effects in physics that cannot be observed using traditional classical sources of light [26, as an example].
It turns out that we are indeed able to make use of frequency-entangled twin photon pairs to construct a system that provides range measurements analogous to those obtained using classical OCT, but with additional salutary nonclassical features. We refer to this scheme as quantum optical coherence tomography (QOCT).
Quantum optical coherence tomography (QOCT).
QOCT provides axial imaging by making use of a fourth-order interferometer incorporating two photodetectors, rather than the second-order interferometer with a single photodetector, as used for classical OCT. Type-I QOCT was first proposed in 2002 [27], and experimentally demonstrated as a quantum-imaging technique in 2003 and 2004 [28, 29]. Three-dimensional QOCT images of a biological sample, an onion-skin tissue coated with gold nanoparticles, were obtained more recently [30], confirming that QOCT is a viable biological imaging technique. This also represented the first demonstration that a quantum-entangled entity could interact with a nonplanar, scattering, biological medium to generate a collection of quantum interferograms, which in turn could be used to construct a biological image.
A particular merit of QOCT, as indicated above, is that it is inherently immune to even-order group-velocity dispersion (GVD) [25, chap. 22] imparted by the sample, by virtue of the frequency entanglement associated with the twin-photon pairs [31, 32, 33, 34]. Conventional OCT, in contrast, is subject to GVD, which degrades resolution. Moreover, for sources of the same bandwidth, the twin-photon entanglement endows QOCT with a resolution enhancement of a factor of two in comparison with that achievable with OCT [27].
In addition, QOCT permits a direct determination of the GVD coefficients of the interstitial media between the reflecting surfaces of the sample [29]. A typical QOCT scan comprises two classes of features. Features in the first class carry the information that is most often sought in OCT: the depth and reflectance of the layer surfaces that constitute the sample. In QOCT, each of these features is associated with a reflection from a single surface and is immune to GVD. Features in the second class arise from cross-interference between the reflection amplitudes associated with every pair of surfaces and are sensitive to the dispersion characteristics of the media between them. Measurement of the broadening of a feature associated with two consecutive surfaces directly yields the GVD coefficient of the interstitial medium lying between them. In an OCT scan, in contrast, only a single class of features is observed; each feature is associated with the reflection from a single surface and is subject to the cumulative dispersion of the portion of the sample lying above it. Thus, GVD information is not directly accessible via OCT; to measure the GVD of a particular buried medium, it is necessary to consecutively compute the GVD of each of the constituent layers above it.
The performance characteristics of a QOCT system, such as its signal-to-noise ratio (SNR) and speed, are determined by a number of factors, including the optical power (biphoton flux) in the interferometer [30].
Quantum-mimetic optical coherence tomography (QM-OCT).
QOCT has inspired a number of “quantum-mimetic” versions that operate on the basis of classical nonlinear optics [35, 36, 37, 38]. Though these approaches mimic the dispersion-cancellation feature inherent in photon pairs that are entangled in frequency, they have their own limitations, which are principally associated with the complexity of the required experimental arrangements.
Polarization-sensitive quantum optical coherence tomography (PS-QOCT).
As an extension of the QOCT theory proposed in 2002 [27], the theory for Type-II polarization-sensitive quantum optical coherence tomography (PS-QOCT) was set forth in 2004; it offered optical sectioning with polarization-sensitive capabilities [39]. This approach provides a means for obtaining information about the optical path length between isotropic reflecting surfaces, the relative magnitudes of the reflectances from each interface, the birefringence of the interstitial materials, and the orientation of the optical axes of the sample. As with its precursor, PS-QOCT is immune to even-order sample dispersion and thus permits measurements to be carried out at depths greater than those accessible via PS-OCT. A general Jones-matrix theory for analyzing PS-QOCT systems, along with a proposed procedure for carrying out these experiments, is provided in Ref. [39].
2 PS-QOCT Experiments
In this paper we report the results of several proof-of-principle experiments illustrating that Type-II polarization-sensitive QOCT provides results in accord with the theory [39]. The experimental arrangement used in these experiments is discussed in detail in Sec. 2.1.
In the first experiment (Sec. 2.2), we make use of a reflective sample buried under a highly dispersive material to demonstrate that even-order group-velocity dispersion cancellation can be achieved when the pulsed pump laser is operated in the psec regime. This results from the frequency anti-correlation of the signal and idler downconverted photons.
The second experiment (Sec. 2.3), conducted with pump pulses of fsec duration, illustrates the persistence of group-velocity dispersion when the pump pulses have insufficient duration. This is expected because the broad spectra of the pump pulses blur the frequency anti-correlation of the signal and idler photons. These experiments reveal that dispersion cancellation can be achieved with sufficiently long pump pulses, or with CW.
In the third experiment (Sec. 2.4), we show that PS-QOCT can be successfully used for samples that scatter light rather than reflect it, such as biological specimens, by inserting a single lens at a carefully selected location in the experimental apparatus. This experiment also demonstrates that high-resolution lateral, as well as axial, imaging can be attained with PS-QOCT.
Finally, the fourth experiment (Sec. 2.5), conducted with a sample comprising two surfaces and an interstitial medium, reveals the presence of two classes of features in the Type-II QOCT interferogram. As with Type-I QOCT, these correspond to interference arising from each surface individually and to cross-interference involving both surfaces. This experiment demonstrates that PS-QOCT can be used to determine the GVD coefficients of the interstitial media between the reflecting surfaces of the sample.
2.1 Experimental arrangement
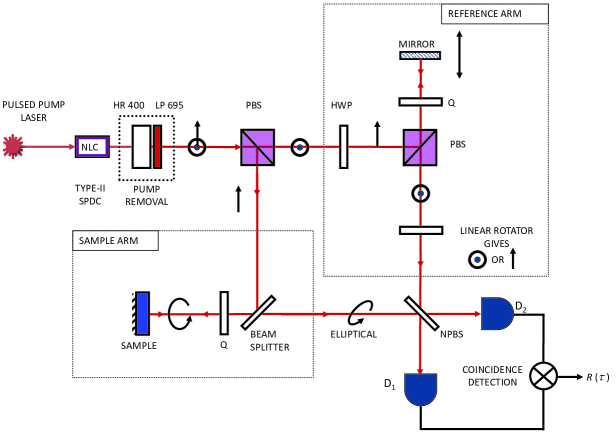
A general experimental arrangement that can be used for investigating the properties of pulse-pumped Type-II QOCT experiments is displayed in Fig. 1. A frequency-doubled Ti:sapphire laser, used to generate either 10-psec or 80-fsec optical pulses at a center wavelength of 400 nm, pumps a -barium borate (BBO) nonlinear optical crystal (NLC) oriented for Type-II, collinear, degenerate spontaneous parametric downconversion (SPDC) at a center wavelength of 800 nm [40]. The pump beam is removed from the SDPC by a highly reflective mirror (HR 400) centered at the pump wavelength in conjunction with a long-pass filter (LP 695).
The vertically polarized signal photons and horizontally polarized idler photons are separated by a polarizing beam splitter (PBS) and fed to the sample and reference arms of a Mach–Zehnder interferometer, respectively. For the experiments considered here, the polarization in the reference arm was set to horizontal (indicated by ). The reference arm consists of a variable path-length delay comprised of a half-wave plate (HWP), a polarizing beam splitter (PBS), a quarter-wave plate (Q), and a translational mirror that changes the length of the reference arm relative to the sample arm. The final polarization of the reference beam can be oriented to either vertical or horizontal by a linear rotator placed before the final non-polarizing beam splitter (NPBS) of the interferometer.
The sample arm contains a beam splitter, a quarter-wave plate (Q), and the sample under study; this arrangement allows circularly polarized light to impinge normally on the sample. The back-scattered light from the sample, which in general has elliptical polarization, is mixed with the delayed reference beam at the final NPBS. In the general configuration portrayed in Fig. 1, the elliptically polarized backscattered light from the sample travels back along the probe-beam path, through the NPBS in the sample arm, to the final non-polarizing beam splitter.
The two outputs of the final NBPS are directed through pinholes (not shown) to two single-photon counting detectors. The coincidence rate for photons arriving at the two detectors, as a function of the path-length delay in the reference arm, are recorded in a time window determined by a coincidence-counting detection circuit (indicated by ).
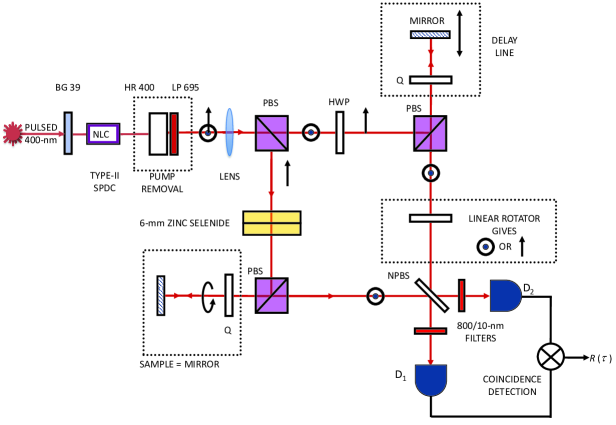
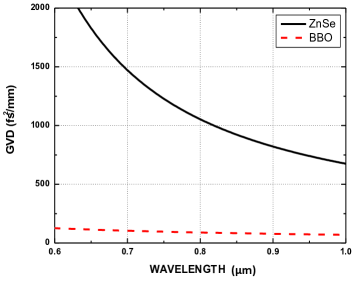
The actual experimental setup used to carry out the experiments we report is displayed in Fig. 2. In experiments designed to examine the dispersion-cancellation capabilities of the pulse-pumped Type-II QOCT system, a reflective mirror sample was buried beneath a 6-mm thickness of zinc selenide (ZnSe). At a wavelength of 800 nm, this material is highly dispersive; its GVD coefficient is more than 10 times greater than that of the BBO nonlinear crystal, as is evident from Fig. 3.
The light backscattered from the sample is directed through a polarizing beam splitter in the sample arm, rather than through the ordinary beam splitter depicted in Fig. 1. In experiments designed to demonstrate that PS-QOCT can be used for the imaging of scattered light, a lens is inserted before the initial PBS.
2.2 Cancellation of group-velocity dispersion for a ps-pulsed pump
Using the setup portrayed in Fig. 2, but with no lens, we carried out a set of experiments in which the Ti:sapphire laser was configured for psec-pulse operation. For such long optical pulses, the source is effectively quasi-CW so that even-order dispersion cancellation is expected.
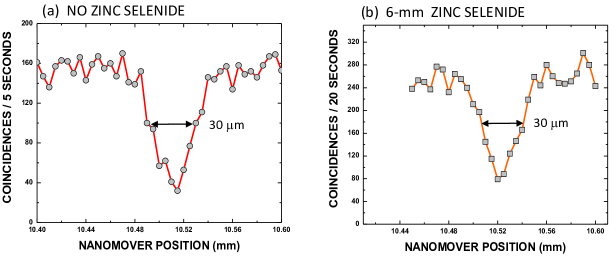
The interferograms displayed in Fig. 4 were obtained with a 1.5-mm-thick BBO nonlinear crystal. Coincidence data are shown: (a) in the absence of ZnSe, and (b) with 6 mm of ZnSe placed in the sample arm before the single reflecting surface. Each data point represents the number of coincidences measured in a 5-sec or 20-sec integration time (as indicated in Figs. 4(a) and 4(b), respectively), as the path-length delay between the sample and reference arms was scanned via a translational mirror in the reference arm located on a motorized stage (Melles Griot Nanomover).
As the optical path-length delay approaches zero in Fig. 4(a) (at nanomover position mm), quantum destructive interference at the final beam splitter causes the observed coincidence rate to decrease, and the result is a sharp dip in the curve. This is the well-known Hong–Ou–Mandel (HOM) interference dip [41]. The interferogram in Fig. 4(b) behaves similarly. Indeed, the 30-m full-width half-maximum (FWHM) of the dip displayed in Fig. 4(b), in the presence of 6 mm of ZnSe, is the same as that shown in Fig. 4(a) in the absence of the ZnSe. This reveals that the presence of highly dispersive ZnSe has no effect on the width of the dip, thereby demonstrating the cancellation of group-velocity dispersion for ps-pulsed pumping.
2.3 Persistence of group-velocity dispersion for a fs-pulsed pump
The dispersion cancellation offered by QOCT is related to the matching of each spectral component above the center frequency in one beam to an anti-correlated spectral component below the center frequency in its companion beam. For a CW pump beam with a single frequency , energy conservation requires that , where the subscripts (p, s, i) denote the pump, signal, and idler beams, respectively. Since the down-converted signal and idler photon frequencies always sum to the pump frequency , the signal and idler photons are perfectly anti-correlated in frequency. The deviations from the center frequency ultimately cancel via the interference of both beams at the final beam splitter.
For a pulsed-pump beam, the same energy-conservation condition applies. However, the range of frequencies comprising the pump pulse increases as its duration decreases by virtue of their Fourier-transform relationship. For a sufficiently short pump pulse, therefore, the signal and idler frequencies need not sum to a constant value, so that the signal and idler photons are no longer precisely anti-correlated [42]. Consequently, the immunity of QOCT to even-order dispersion in the sample is expected to degrade as the pump-pulse duration shortens. It is clear from the results reported in Sec. 2.2 that 10-psec pump pulses are sufficiently long so that dispersion cancellation is maintained. However, the 80-fsec pump pulses are sufficiently short so that dispersion cancellation is expected to fail.
To confirm this, we carried out a set of experiments similar to those reported in Sec. 2.2 but with the Ti:sapphire laser reconfigured to generate 80-fs, rather than 10-ps, optical pulses. Decreasing the pulse duration causes the peak pulse intensity at the output of the Ti:sapphire laser to increase substantially, thereby increasing the second-harmonic output power fed to the nonlinear crystal. As a result, these experiments were conducted using a thinner (0.5-mm thickness) BBO crystal. The measured spectral bandwidth of the pump laser at its 400-nm center wavelength was found to be nm.
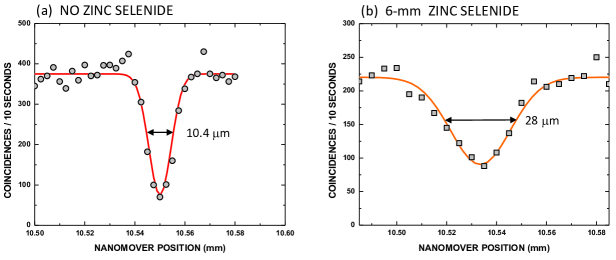
Coincidence data are displayed in Fig. 5(a) in the absence of ZnSe, and in Fig. 5(b) in the presence of 6 mm of ZnSe placed in the sample arm before the single reflecting surface. Each data point represents the number of coincidences measured during a 10-sec integration time, as the path-length difference between the sample and reference arms was scanned. Again, dips in the curves are observed as the optical path-length delay approaches zero (at nanomover position mm). The solid curves represent Gaussian fits to the HOM quantum-interference dips and the measured FWHM values are indicated by the double arrows. In the absence of ZnSe, the width of the dip is 10.4 m, whereas in its presence the width is broadened to 28 m. This clearly demonstrates the persistence of group-velocity dispersion when using a fs-pulsed pump to generate the SPDC. These results are in sharp contrast to those obtained when using a ps-pulsed pump, as portrayed in Fig. 4.
2.4 Imaging of a scattering sample
QOCT is an interferometric technique that relies on the interference between two spatial/polarization modes at the final beam splitter. If the overlap of these modes is less than ideal, the quality of the observed interference pattern will be degraded and the contrast of the interference pattern diminished. The experiments reported in Secs. 2.2 and 2.3 made use of a mirror sample that directly reflected the normally incident probe-beam light so that it achieved spatial/polarization matching.
However, the back-scattered light returned from real samples often extends over a cone of angles. The question arises as to whether a lens inserted in the apparatus can serve to suitably collect this returned light and thereby to maintain the integrity of the PS-QOCT interferogram. Since a scattering sample, such as a biological specimen, can be modeled as a collection of small reflecting regions at various angles of tilt, we have carried out experiments using a reflecting-mirror sample tilted over a range of angles to demonstrate that Type-II PS-QOCT is suitable for imaging scattering specimens, much as has been found with Type-I QOCT [30].
The first set of experiments was conducted using the experimental setup displayed in Fig. 2 with a 3-cm-focal-length lens inserted before the mirror sample. Figure 6 displays the PS-QOCT interferograms for: 1) reflection of the probe beam at normal incidence (circles); 2) reflection at a 5.83-mrad mirror tilt in the horizontal direction (squares); and 3) reflection at an 8.00-mrad mirror tilt in the vertical direction (triangles). The data reveal that the sample mirror could be tilted by more than 5 mrad in both the horizontal and vertical directions without degrading the quantum-interference pattern.
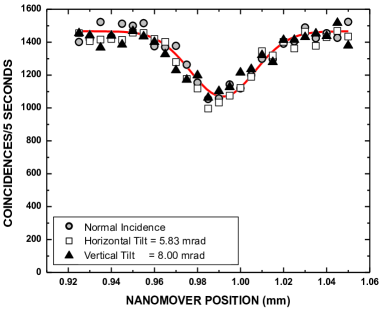
It is apparent from the results presented in Fig. 6, however, that the introduction of the lens reduces the visibilities of all three interference patterns by 25%. It was ascertained that this results from an imbalance in the interferometer that arises from a mismatch in the spatial-mode overlap at the final beam splitter. This in turn leads to distinguishability between the paths and a concomitant reduction in the interferogram visibility.
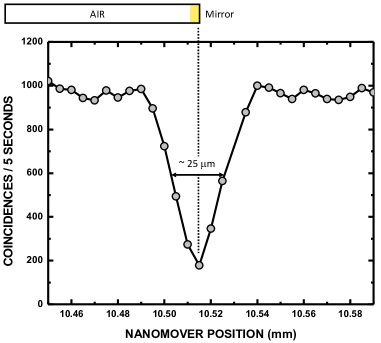
We therefore conducted a second set of experiments in which we demonstrated that high-visibility interference can in fact be regained by inserting an identical lens in the reference arm to restore indistinguishability. Alternatively, we can place a single lens before the first polarizing beam splitter (as shown in Fig. 2), since this symmetrically affects both arms of the interferometer. In Fig. 7, we display the interferogram obtained from a third set of experiments in which we employed this latter technique. The spatial modes in the sample and reference arms are modified in an identical manner, and this does indeed lead to a substantially increased visibility of 85%, with a coincidence count rate of coincidences/second. While the presence of this particular lens restricts the sample tilt to 0.5 mrad, it increases the overall count rate via improved mode matching at the fiber-coupled single-photon counting detectors. These results can, no doubt, be further improved by optimally selecting matched focusing systems for the sample and reference arms.
Moreover, since the lens restricts the light falling on the sample to a small lateral spot, these results demonstrate that high-resolution lateral (transverse), as well as axial, imaging can be attained for a PS-QOCT imaging system [43]. The lateral resolution can be enhanced by making use of high-numerical-aperture (NA) focusing optics in the sample arm. This approach should be implemented carefully, however, since incorporating a single lens in the apparatus can impair axial resolution, as discussed above. Rather, matched focusing in both arms of the interferometer should be used to preserve indistinguishability. The construction of a two-dimensional imaging system of this kind would benefit from the combined and coordinated scanning of the focusing lens in the sample arm and the interferometric delay. This can be achieved by using a single mechanical stage to control both functions, as has been successfully implemented in OCT [44].
2.5 Determination of interstitial-media dispersion
The final experiment that we report is designed to demonstrate that PS-QOCT can serve as a tool for determining the GVD coefficients of the interstitial (in general birefringent) media between the reflecting interfaces of a multi-layer sample.
For a sample with two reflective surfaces, PS-QOCT theory predicts two classes of features in the Type-II QOCT interferogram [39, Sec. IVC]. These correspond, respectively, to a pair of interference dips, each associated with one of the surfaces, and to a cross-interference feature involving both surfaces that is expected to appear midway between the two dips [39, Eq. (43)]. This latter feature can be either a peak or a dip, depending on the values of the pump frequency , the average refractive index , the nonlinear crystal thickness, and the arguments of the complex reflection coefficients and . A numerical simulation for the interferogram expected for a quartz flat is instructive [39, Fig. 5].
Our experiment was carried out using the apparatus portrayed in Fig. 2, with a 20-cm-focal-length lens inserted before the first polarizing beam splitter. The sample was a silica flat of refractive index and thickness m. From the PS-QOCT theory discussed above, we expect two dips in the interferogram associated with the reflections at the two surfaces of the flat. These dips should have equal visibility for this thin sample since the intensity reflectances from the two interfaces will be equal at normal incidence: . The dips should be separated by the optical path length of the sample, m. The interference pattern expected from the two interfaces is illustrated as the dashed curve in Fig. 8.
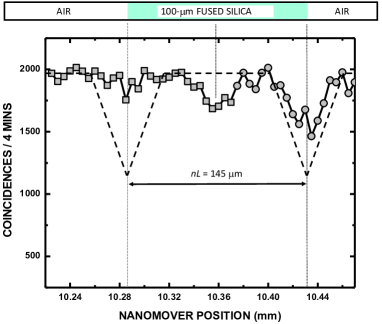
The observed QOCT interferogram for the silica flat is also displayed in Fig. 8. The data indicated by squares represent coincidence count rates acquired over 4 minutes, whereas the circles represent renormalized coincidence count rates acquired over 1 minute. The interferogram is constructed from two separate scans because of operational problems with the Ti:sapphire laser that prevented all of the data from being acquired in a single scan. Though the experiment was not optimized, the interference dips resulting from the two interfaces are clearly evident. They are at the correct locations and are indeed separated by the optical path length of the sample, m, although they exhibit different visibilities because of alignment problems.
Also, as expected, the cross-interference feature emerges midway between the dips. Its width, in conjunction with those of the two interference dips, can be used to provide the GVD coefficients for the interstitial silica.
For multilayer samples it is worth emphasizing that the widths of the cross-interference terms are determined only by the dispersion of the medium residing between the two relevant reflective surfaces, and not by the nature of the material under which they are buried. Furthermore, in the absence of prior information relating to the structure of the sample, interference features in the PS-QOCT interferogram associated with reflections from individual surfaces may be confounded by the presence of cross-interference features associated with pairs of surfaces. These two classes of features may be readily distinguished, however, since slight variations of the pump frequency can be used to change the form of features in the second class (e.g., from dips to humps), whereas those in the first class are invariant to such variations. Thus, dithering the pump frequency, for example, can serve to wash out the features in the second class, thereby leaving intact the desired dispersion-cancelled portion of the interferogram that reveals the axial structure of the sample [29]. We expect that returns from scattering media would exhibit similar behavior because of the randomness of the relative phases associated with different surfaces. At the same time, simple subtraction of this pattern from the undithered version would allow the second class of features to be separated, thereby facilitating the determination of the GVD coefficients of the various media comprising the sample.
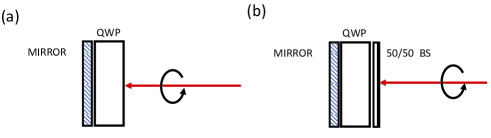
The experiment discussed above can be extended to provide a more thorough examination of the polarization-sensitive properties of the PS-QOCT paradigm. For example, an experiment could be carried out by replacing the polarizing beam splitter in the sample arm of Fig. 2 by an ordinary beam splitter (as shown in Fig. 1), so that the full polarization information inherent in the sample returns along the sample path to the final non-polarizing beam splitter. Two idealized samples, illustrated in Figs. 9(a) and (b), could serve to establish the validity of Figs. 4 and 5 of Ref. [39], respectively. The highly reflective mirror in Fig. 9(a), as well as the 50/50 beam splitter and mirror in Fig. 9(b), offer far stronger reflections than those from the surfaces of the quartz plate (for which ), which would facilitate this experiment by shortening the integration time required for a scan such as that shown in Fig. 8.
The use of samples such as these would readily permit a set of three measurements to yield: 1) the thickness of the quartz; 2) its birefringence properties; and 3) its orientation angle. This is because it has previously been established that three experiments are required to completely determine the properties of the sample [39]. The procedure is as follows: The reference-arm polarization is first selected to be horizontal (H) and the associated quantum interferogram is measured by recording the photon coincidence rate from the two detectors as the path-length delay is scanned. The second experiment is performed by rotating the reference-arm polarization to the orthogonal vertical (V) position and measuring the quantum interferogram . The third experiment is carried out by selecting a value of that coincides with the position of a layer; the angles of the polarization elements in the reference arm are then adjusted to maximize the coincidence rate.
The sample properties are obtained via the following procedure [39]: The birefringence inherent in the parameter is determined by forming the ratio of and at a value of that coincides with the location of a layer. The quantity is determined from the angles of the polarization elements in the reference arm and by solving the equations for orthonormality. This approach is not unlike the nulling techniques used in ellipsometry; the total quantum interferogram is computed from the sum of and , and is then readjusted for the DC offset given by the constant term , so that . The curve provides the path-length delay between the interfaces as well as the ratio of the relative reflectances from each layer.
3 Discussion
Signal-to-noise ratio and speed.
The signal-to-noise ratio (SNR) and speed of the PS-QOCT technique are determined by a number of factors, including the optical power (biphoton flux) in the interferometer, the transmittances of the optical paths, the quantum efficiencies of the detectors, and the duration of the experiments. Although the biphoton flux can be increased by simply raising the pump power, an upper limit is imposed by the saturation level of the single-photon detectors and coincidence circuit. Faster single-photon detectors, such as those relying on superconducting technology [45], as well as faster coincidence circuits, should significantly enhance the SNR and speed of PS-QOCT. Additionally, some of the recent advances in biphoton generation that have enabled ultrahigh axial resolution to be achieved in Type-I QOCT [46] can be considered in the context of Type-II QOCT. Also in the offing are electrically driven solid-state biphoton sources [47] that promise optical powers in the W region, which could enhance the prospects for PS-QOCT.
Generalization of the model.
To advance the use of PS-QOCT, it would also be beneficial to relax some of the simplifying assumptions used in the initial model [39]. The specimen can be endowed with properties that more closely mirror biological tissue rather than being considered as a collection of layers separated by transparent dispersive media. It would be helpful to accommodate: 1) Depletion of the probe beam — the assumption of an undepleted probe beam is widely used throughout the OCT literature but the ability of PS-QOCT to probe more deeply into tissue may make depletion more important; 2) Frequency- and polarization-dependent reflection coefficients at the boundaries; 3) Scattering and absorption at the boundaries and in the interstitial layers.
4 Conclusion
We have carried out a collection of experiments that have served to demonstrate the operation of dispersion-cancelled and dispersion-sensitive Type-II polarization-sensitive quantum optical coherence tomography (PS-QOCT). We have illustrated the principal advantages that stem from the entanglement of the twin-photon source: dispersion cancellation, polarization sensitivity, and the ability to directly measure the dispersion characteristics of the interstitial media. We have also shown that the judicious placement of focusing elements in the experimental apparatus allows high-resolution lateral, as well as axial, imaging to be achieved. Suggestions have been provided for further experiments.
Acknowledgments
This work was supported by a U.S. Army Research Office (ARO) Multidisciplinary University Research Initiative (MURI) Grant; and by the Bernard M. Gordon Center for Subsurface Sensing and Imaging Systems (CenSSIS), an NSF Engineering Research Center.