Origin of Pyroelectricity in LiNbO3
Abstract
We use molecular dynamics with a first-principles based shell model potential to study pyroelectricity in lithium niobate. We find that the primary pyroelectric effect is dominant, and pyroelectricity can be understood simply from the anharmonic change in crystal structure with temperature and the Born effective charges on the ions. This opens a new experimental route to studying pyroelectricity, as candidate pyroelectric materials can be studied with X-ray diffraction as a function of temperature in conjunction with theoretical effective charges. We also predict an appreciable pressure effect on pyroelectricity, which could be used to optimize materials pyroelectricity, and the converse electrocaloric effect, peak as is approached.
pacs:
77.70.+a,77.84.Ek,31.15.xv,71.15.PdThe theory of ferroelectricity had a classical period that culminated in the 1970s linesglass ; PhysRevB.13.180 ; PhysRevLett.39.1362 , followed by a quiescent period, and was rejuvenated in the 1990s with the introduction of modern electronic structure methods to these complex, interesting, and useful materials cohen:prb1990 ; cohen:Nature1992 . The fundamental physics of pyroelectricity, the change in polarization with respect to temperature, has not been re-investigated until now, and there is no previous first principles computation of pyroelectricity. Pyroelectricity is of current great interest since the discovery of particle acceleration of ions from changes in temperature at pyroelectric surfaces sufficient to generate hard X-rays in a commercial product brownridge:640 ; ida2005 ; coolxx as well as neutrons in heavy water via fusion Naranjo:Nature2005 . is a uniaxial pyroelectric with space group R3c in the polar phase with ten atoms per primitive cell, and a of K PhysRevB.53.1193 ; linesglass . The structure, polarization and lattice dynamics of have been previously studied from first-principles using total energy, Berry’s phase and linear response methods within Density Functional Theory (DFT) PhysRevB.53.1193 ; PhysRevB.61.272 ; PhysRevB.65.214302 . has been studied extensively experimentally Rauber ; linesglass due to its use in SAW filters and non-linear optics. There is also much interest now in the converse of the pyroelectric effect, the electrocaloric effect, for refrigeration or energy scavenging. scott2007 ; Akcay2007 ; Prosandeev2008
Pyroelectricity is the change in spontaneous polarization with temperature . The total pyroelectric coefficient is
| (1) |
The first term on the right side is the primary pyroelectric effect and the second the secondary effect. Experimentally the pyroelectric effect is measured under the constraint of constant stress. The experimentally accessible or proper pyroelectric coefficient is due to the adiabatic current flow due to a slow change in temperature, , where is the change in temperature with time . The of an unclamped sample can be expressed as
| (2) |
measures the variation of spontaneous polarization with respect to temperature at constant strain (clamped), which arises from changes in phonon occupations and anharmonicity. is the result of crystal deformation where the strain caused by thermal expansion alters the polarization via the piezoelectric effect as , where the indices label coordinate directions Newnham , repeated indices imply summation, are piezoelectric compliances, are elastic moduli, and are the thermal expansion coefficients. is the difference from the total and proper pyroelectric coefficients linesglass , where is the linear thermal expansion coefficient of the plane perpendicular to the polar axis. can be measured with charge-integration or dynamic pyroelectric techniqueslinesglass , whereas cannot be measured directly. Understanding the components of is crucial in studying pyroelectricity and its origin.
We performed density functional theory (DFT) computations and fitted the results to a atomistic shell model. We used Density Functional Perturbation Theory (DFPT) PhysRevB.43.7231 to compute phonons, effective charges, and dielectric constants. We performed first principles calculations with the ABINIT package CMS.25.478 within the local density approximation (LDA) PhysRevB.45.13244 . Lithium and electrons, niobium , , , and electrons, as well as oxygen and electrons were considered as valence states. We constructed pseudopotentials using the OPIUM packageopium . We used a kinetic energy cutoff of 45 Hartree and sampled the Brillouin zone using a Monkhorst-Pack mesh of special points. The results were carefully checked against previous all-electron PhysRevB.53.1193 and pseudopotential PhysRevB.61.272 ; PhysRevB.65.214302 computations.
| ( ) | ( ) | ( ) | () | () | |
| DFT(0K) | 5.151 | 13.703 | 0.86 | ||
| QHLD(300K) | 5.184 | 13.774 | 94.04 | 3.59 | |
| MD(300K) | 5.145 | 13.488 | 0.63 | 2.63 | |
| Exp.(300K) | 5.151a | 13.876a | 0.70-0.71b | 95.8c | 3.24-3.83d |
Boysen:459 ; PhysRevB.13.180 ; wemple:209 ; LNO.cv ; LNO2002 ; kim:4637 ; smith:2219
The structural parameters of in its polar ground state as functions of volume were obtained by relaxing the cell shape and atomic positions at seven volumes from to Å(-5 to 20 GPa from the fitted equation of state). We also optimized the atomic coordinates for the paraelectric symmetry R with the same sets of optimized lattices.
We computed the phonon frequencies using DFPT on a grid of q-points at each of the seven volumes. The frequencies were interpolated onto a finer grid using short-range force constants PhysRev.125.1905 . Quasi-harmonic Helmholtz free energies were obtained from these frequencies as functions of temperature and volume. Isotherms were fitted to the Vinet equation of state PhysRevB.73.104303 .
The polarization was computed for each of the seven volumes using the Berry’s phase method with a mesh of points. The results of the calculations were checked for convergence with respect to the number of points and the plane wave cutoff energy. We obtained as the differences of the polarization between the polar and centrosymmetric at each volume, making sure we are on the same polarization versus mode coordinate curve resta2007 .
| Smith et al.smith:2219 | Yamada amada:151 et al. | Present | |
| () | () | () | |
| 2.030 | 2.03 | 2.18 | |
| 0.573 | 0.53 | 0.68 | |
| 0.752 | 0.75 | 0.78 | |
| 0.085 | 0.09 | 0.15 | |
| 2.424 | 2.45 | 2.40 | |
| 0.595 | 0.60 | 0.55 | |
| 0.728 | 0.75 | 0.75 | |
| () | () | () | |
| 6.92 | 6.8 | 8.12 | |
| 2.08 | 2.1 | 2.37 | |
| -0.09 | -0.1 | -0.15 | |
| 0.60 | 0.6 | 0.81 | |
| () | () | () | |
| 3.76 | 3.7 | 3.722 | |
| 2.43 | 2.5 | 2.317 | |
| 0.23 | 0.2 | 0.219 | |
| 1.33 | 1.3 | 1.718 |
The shell model approach has proven to be a computationally efficient and confident methodology for the simulation of ferroelectric perovskites, including bulk properties of pure crystals, solid solutions and super lattices, and also surfaces and thin films propertiesSepliarsky:2004 . In this model, each atom is represented by a massive core coupled to a massless shell, and the relative core-shell displacement describes the atomic polarization. The model contains 4th order core-shell couplings, long-range Ewald interactions and short-range interactions described by the Rydberg potential . The parameters were fit from the DFT and DFPT results of total energies, forces, stresses, phonon frequencies and eigenvectors, Born effective charges, and dielectric constants for a number of distorted and strained structures. We then performed classical molecular dynamic simulations with DL_POLY package dlpoly .
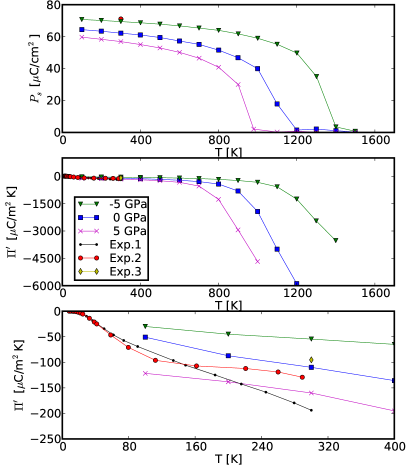
We computed the spontaneous polarizations during the MD simulations. NT ensembles in MD simulations capture the evolutions of the system volume and shape corresponding to applied pressure, temperature. As a result,MD simulations in NT ensemble allow us to compute , the total pyroelectric coefficient in Eq. 1. We also performed MD simulations in the NT ensemble (constant strain) and obtained , and the difference gives . We computed from MD NT simulations.
The MD simulations were carried out in a super cell with primitive unit cells, which is 5120 atoms (5120 cores and 5120 shells). The NT ensemble allows the shape and volume to change at constant stress, by which and can be obtained. decreases with temperature and drops to zero at the phase transition to the paraelectric phase at 1200 K (Fig. 1), which agrees well with the experimental value of 1430K Boysen:459 and 1480K linesglass .
In order to understand the effects of volume error and the effects of pressure, we repeated the MD simulations and analysis at GPa. We found that GPa reduces the volume about 3.6%, and GPa increases the volume by 4.0%. is 1400 K and 1000 K for and 5 GPa respectively.
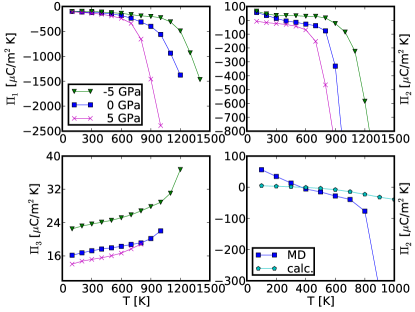
We separately computed from MD simulations in the NVT ensemble. The volume of the target temperature was taken from the previous simulations. MD simulations at K were carried out to calculate at in Fig. 2 and Table 3. decreases with temperature and pressures, as does , calculated by . We found and at 300 K. While lacking the direct and complete experimental data of all the coefficients of pyroelectricity, we estimate them as listed in in Table 3 by combining the reported data of ref.kim:4637 ; smith:2219 and PhysRevB.13.180 . There is good agreement between the experiment and present calculations.
| Present | -90.2 | -107.7 | -121.3 | 13.5 | 17.6 |
|---|---|---|---|---|---|
| Calc. from ExpPhysRevB.13.180 ; smith:2219 | -133.0 | -154.9 | -171.9 | 17.0 | 21.9 |
| Exp Lang:2005 | -83 | -95.8 | 12.8 |
As a check, we calculated in an alternative way as for , where are piezoelectric stress constants (Voigt notation), which are obtained by the first principles calculation at zero pressure and zero temperature as listed in Table 2. Using obtained from NT simulations, we computed (Fig. 2), which agrees with direct MD results at low temperatures up to 700K.
We found that is dominant and is small. The absolute value of both and increase rapidly with temperature as is approached.
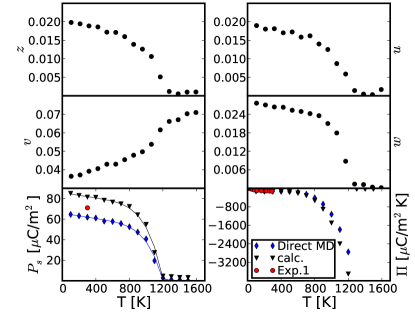
Up until now there has not been a clear exposition of the origin of pyroelectricity and the electrocaloric effect, but they are often considered as resulting from increasing polarization disorder with temperature. We find that the effects can be understood from the changes in crystal structure with temperature, as a simple anharmonic effect. We determined the average structural parameters , , and PhysRevB.65.214302 from the average atomic positions in the MD simulations (Fig. 3). We computed the versus temperature using these average positions with the Born effective charges obtained from the DFPT computations, and where is the th ionic displacement along the polar axis from the centrosymmetric to polar structures, the elementary charge and the unit cell volume (Fig. 3). The results show that the pyroelectric effect can be entirely understood in the classical regime above room temperature from the change in average structure with temperature, peaking at . Thus the anharmonic internal atomic rearrangement with respect to the temperature contribute the dominant part of the pyroelectricity. We find that pyroelectric coefficients could easily be obtained experimentally without electrical measurements, simply by studying changes in crystal structure with temperature, along with first-principles theoretical effective charges . Good pyroelectrics and electrocaloric materials should have slightly higher than the operating temperatures.
This work was partly supported by the EFree, an Energy Frontier Research Center funded by the U.S. Department of Energy, Office of Science, Office of Basic Energy Sciences under Award Number DE-SC0001057 and partly by the Office of Naval Research No. N00014-07-1-0451.
References
- (1) M. Lines and A. Glass, Principles and Applications of Ferroelectrics and Related Materials (Clarendon Press, Oxford, 1977)
- (2) A. M. Glass and M. E. Lines, Phys. Rev. B 13, 180 (1976)
- (3) M. E. Lines and A. M. Glass, Phys. Rev. Lett. 39, 1362 (1977)
- (4) R. E. Cohen and H. Krakauer, Phys. Rev. B 42, 6416 (1990)
- (5) R. Cohen, Nature 358, 136 (1992)
- (6) J. D. Brownridge and S. Raboy, Journal of Applied Physics 86, 640 (1999)
- (7) H. Ida and J. Kawai, X-Ray Spectrometry 34, 225 (2005)
- (8) http://www.amptek.com/coolx.html
- (9) B. Naranjo, J. Gimzewski, and S. Putterman, Nature 434, 1115 (2005)
- (10) I. Inbar and R. E. Cohen, Phys. Rev. B 53, 1193 (1996)
- (11) K. Parlinski, Z. Q. Li, and Y. Kawazoe, Phys. Rev. B 61, 272 (2000)
- (12) M. Veithen and P. Ghosez, Phys. Rev. B 65, 214302 (2002)
- (13) A. Rauber, “Current topics in materials science,” (North-Holland, Amsterdam, 1978) p. 481
- (14) J. F. Scott, Science 315, 954 (2007)
- (15) G. Akcay, S. P. Alpay, J. V. Mantese, and G. A. Rossetti, Jr., Applied Physics Letters 90, 252909 (2007)
- (16) S. Prosandeev, I. Ponomareva, and L. Bellaiche, Physical Review B 78, 052103 (2008)
- (17) R. E. Newnham, Properties of Materials: Anisotropy, Symmetry, Structure (Oxford University Press, Oxford, 2005)
- (18) P. Giannozzi, S. de Gironcoli, P. Pavone, and S. Baroni, Phys. Rev. B 43, 7231 (1991)
- (19) X. Gonze, J. M. Beuken, R. Caracas, F. Detraux, M. Fuchs, G. M. Rignanese, L. Sindic, M. Verstraete, G. Zerah, F. Jollet, M. Torrentb, A. Royb, M. Mikamic, P. Ghosezd, J. Y. Ratyd, and D. C. Allane, Computational Materials Science 25, 478 (2002)
- (20) J. P. Perdew and Y. Wang, Phys. Rev. B 45, 13244 (1992)
- (21) http://opium.sourceforge.net
- (22) H. Boysen and F. Altorfer, Acta Crystallographica Section B: Structural Science 50, 405 (1994)
- (23) S. H. Wemple, J. M. DiDomenico, and I. Camlibel, Applied Physics Letters 12, 209 (1968)
- (24) V. V. Zhdanova, V. P. Klyuev, V. V. Lemanov, I. A. Smirnov, and V. V. Tikhonov, Sov. Phys.-Solid State (USA) 10, 1360 (1968)
- (25) Properties of Lithium Niobate, edited by K. K. Wong (INSPEC, 2002)
- (26) Y. S. Kim and R. T. Smith, Journal of Applied Physics 40, 4637 (1969)
- (27) R. T. Smith and F. S. Welsh, Journal of Applied Physics 42, 2219 (1971)
- (28) H. Kaplan, Phys. Rev. 125, 1905 (1962)
- (29) X. Sha and R. E. Cohen, Phys. Rev. B 73, 104303 (2006)
- (30) R. Resta and D. Vanderbilt, in Physics of Ferroelectrics: a Modern Perspective, edited by C. Ahn, K. Rabe, and J. Triscone (Springer-Verlag, New York, 2007) pp. 31–68
- (31) T. Yamada, N. Niizeki, and H. Toyoda, Jpn. J. Appl. Phys. 6, 2219 (1967)
- (32) S. B. Lang, Physics today 58, 31 (2005)
- (33) M. Sepliarsky, Z. Wu, A. Asthagiri, and R. E. Cohen, Ferroelectrics 301, 55 (2004)
- (34) W. Smith, C. W. Yong, and P. M. Rodger, Molecular Simulation 28, 385 (2002)