Discovery of Nuclear X-ray Sources in SINGS Galaxies
Abstract
We present the results of a search for nuclear X-ray activity in nearby galaxies using archival data in a sample of 62 galaxies from the Infrared Nearby Galaxy Survey (SINGS). We detect 37 nuclear X-ray sources; seven of these are new detections. Most of the nuclear X-ray sources are likely to be AGNs. The fraction of galaxies hosting AGNs is thus about 60%, much higher than that found with optical searches, and demonstrates the efficacy of X-ray observations to find hidden AGNs in optically normal galaxies. We find that the nuclear X-ray sources are preferentially present in earlier type galaxies. Unlike what is observed at high redshift for high-luminosity AGNs, we do not find a strong correlation between the AGN luminosity and the m luminosity of the host galaxy; we find a strong correlation with the m luminosity instead. This suggests that at the present epoch the accretion rate depends on the total mass of the galaxy, as perhaps does the black hole mass.
1 INTRODUCTION
The past decade has seen extraordinary growth in our understanding of supermassive black holes (SMBHs), with secure detections, mass measurements and new demographic information (see Ferrarese & Ford 2005 and references therein; FF05 hereafter). Knowledge of the mass function of SMBHs directly affects our understanding of SMBH formation and growth, nuclear activity, and the relation of SMBHs to the formation and evolution of galaxies in hierarchical cold dark matter models (e.g. Menci et al. 2004). The cumulative mass function needed to explain the energetics of high redshift quasars implies that all galaxies in the local universe should host a SMBH (e.g. Marconi et al. 2004, Shankar et al. 2004), but we do not know whether this is indeed the case.
Many SMBHs have been found, and their masses measured through stellar and gas dynamics methods at the high end of the SMBH mass function (FF05). In the intermediate mass range, around 108 M⊙, we know of the existence of SMBHs as active galactic nuclei (AGNs); their masses are measured through reverberation mapping or using scaling relations with emission line widths and luminosity (e.g. Blandford & McKee 1982, Peterson 1993, Wandel et al. 1999, Kaspi et al. 2000, 2005). When considering smaller SMBHs or galaxies farther away, mass measurement is more difficult; the sphere of influence of the black hole in these objects is too small to resolve, so we cannot use dynamical estimates, and if we do not see AGN activity at visible wavelengths, we cannot use reverberation mapping. For these reasons, the low-mass end of the SMBH mass function is largely unexplored; indeed we still do not know whether all galaxies host SMBHs.
Because of these difficulties, we turn to AGN signatures to help us probe the existence of low-mass SMBHs. The observed “downsizing” of AGNs (e.g. Hasinger et al. 2005), in which more luminous AGNs are seen to be accreting more actively at higher redshifts and less luminous objects are expected to dominate in the local universe, implies that proportionally more low-mass SMBHs should still be accreting at present. The low mass SMBHs are expected to be present in late-type galaxies. It is possible that the nearby “normal” galaxies appear “normal” because AGN activity is weak and is washed out by starlight when viewed in the optical bands. However, if these objects are in fact accreting, we should observe many of them in X-ray emission. X-rays are well-suited to identifying low-mass systems in late-type galaxies because they can penetrate obscuring material, which in many cases can mask out the emission-line regions surrounding the AGN. Additionally, for low luminosity AGNs the optical light can be overwhemed by the host galaxy light; X-rays, once again, are helpful in this respect because galaxies themselves are not very bright in X-rays. Indeed, there have been several successful efforts using X-rays to identify AGN activity in galaxies residing in clusters (Martini et al. 2002) and in fields (Brand et al. 2005).
In an effort to improve our knowledge of the low-mass end of the SMBH mass function, we conducted a search for low-luminosity AGN candidates using (Ghosh et al. 2008, 2009, 2010a, 2010b). Our program was successful in that we discovered AGNs in what were thought to be normal galaxies. Through extensive spectral, timing and multiwavelength analysis we classified nuclear X-ray sources in 56 galaxies and found 17 that are almost certainly AGN. Thus at least 30% of normal galaxies are actually active. The inferred luminosities of these sources range from to erg s-1. In a few objects where SMBH masses were known from stellar/gas dynamics methods, we find accretion rates as low as of the Eddington limit.
We found that AGNs are present in galaxies of all Hubble types. The distribution of luminosities in a given type and across Hubble types is wide. Moreover, in a given Hubble type, some galaxies host AGNs (down to our flux limit), but some do not. Thus the important outstanding question is: What governs accretion onto a SMBH? At low redshift, the merger rate is low, so the accretion is unlikely to be merger driven. Is it related to star formation rate, as seen at high redshift (e.g. Netzer 2009a, Lutz et al. 2008)? Is it the galactic structure in the central regions, such as bars or nuclear spirals (Pogge & Martini 2002)? Multiwavelength data are necessary to answer these fundamental questions and the Infrared Nearby Galaxy Survey (SINGS) provides such data. Most SINGS galaxies have been observed with , so we searched for nuclear X-ray sources in these galaxies. The main goals of this study were to investigate in detail the X-ray properties of the SINGS sample, detect potential new low-luminosity nuclear activity, and investigate possible connections between nuclear X-ray luminosity and various multiwavelength properties of the host galaxies.
2 DATA AND ANALYSIS
2.1 Galaxy Sample
Our galaxy sample consists of objects from SINGS and is described in detail in Kennicutt et al. (2003). The original sample contained 75 galaxies within 30 Mpc that were chosen to obtain a broad range of galaxy properties to represent the composition of the local universe. This sample was well-suited for our study because these galaxies have been the subjects of many different investigations at many different wavelengths, and we hoped to investigate various properties of galaxies and their connection to the nuclear X-ray activity. Basic information on each of the galaxies in our sample was retrieved from Kennicutt et al. (2003) and presented in Table 1 along with information on the observations used. There were 13 objects in the SINGS sample for which data was unavailable in the archive; the remaining 62 SINGS galaxies had been observed with by the time of this study and the data are available for public use. These 62 galaxies constitute the sample in our study. The SINGS sample is composed of both quiescient and active galaxies; our X-ray sample includes 13 objects whose nuclei are optically identified as Seyferts, nine that are identified as H ii regions, 11 that contain low ionization nuclear emission regions (LINERs), and seven that are optically identified as starbursts. The remaining 22 galaxies in our study had no listed optical nuclear classifications.
2.2 Data Analysis
We used the Interactive Analysis of Observations software (CIAO)111http://cxc.harvard.edu/ciao3.4/index.html v3.4 to process images and extract source counts (Fruscione et al. 2006). X-ray data were downloaded from the archive and filtered to exclude background flares, following the procedure of Ghosh et al. (2008). We used the CIAO task to determine the positions of the sources. We then searched for nuclear sources using object positions listed in the NASAIPAC Extragalactic Database (NED). ’s 90% source location error circle has a radius of less than and less than 1% of sources fall outside a 1″ radius. Therefore, sources that were detected within a 1″ radius of the listed position in NED are considered nuclear detections.
Source counts were extracted from a region centered on the source found by ; the radius of the source region is equal to the 95% encircled-energy radius or (4.67 pixels), whichever is greater. We extracted the background counts from an annulus with an outer radius of 5 times the radius of the source region and an inner radius of twice the radius of the source region. Any other source that fell inside this annulus was excised from the image before counts were extracted. Broadband source counts were extracted in the 0.3-8.0 keV range; counts were also extracted in the 0.3-2.5 keV (soft) and the 2.5-8.0 keV (hard) bands. We also calculated the hardness ratios, defined as HR = ()/(), where H represents the number of hard counts and S represents soft counts, when possible.
We retrieved IRAC, MIPS, and 2MASS fluxes from Dale et al. (2007), which are measured from image mosaics that are large enough to detect emission out to R25 in each galaxy. These flux densities therefore represent the total fluxes of the galaxy at a given wavelength. We also searched for 2MASS point source detections at the positions of the nuclei in these galaxies; all of our detected X-ray sources have 2MASS counterparts that are listed in the 2MASS point source catalog (Skrutskie et al. 2006). The 2MASS magnitudes are measured using a PSF profile-fitting algorithm (see catalog for details) within an aperture of 4″ centered on the position of the detected source. We also obtained 1.4 GHz integrated flux densities for those sources that were detected in the VLA “Faint Images of the Radio Sky at Twenty-Centimeters” survey (FIRST; White et al. 1997). The FIRST survey has a resolution of about 5″; fluxes were measured by fitting a Gaussian to the observations. To summarize, the X-ray, 2MASS source, and FIRST luminosities are nuclear luminosities, while the and 2MASS global luminosities from Dale et al. (2007) include light from the entire galaxy.
3 X-RAY RESULTS
3.1 New Detections
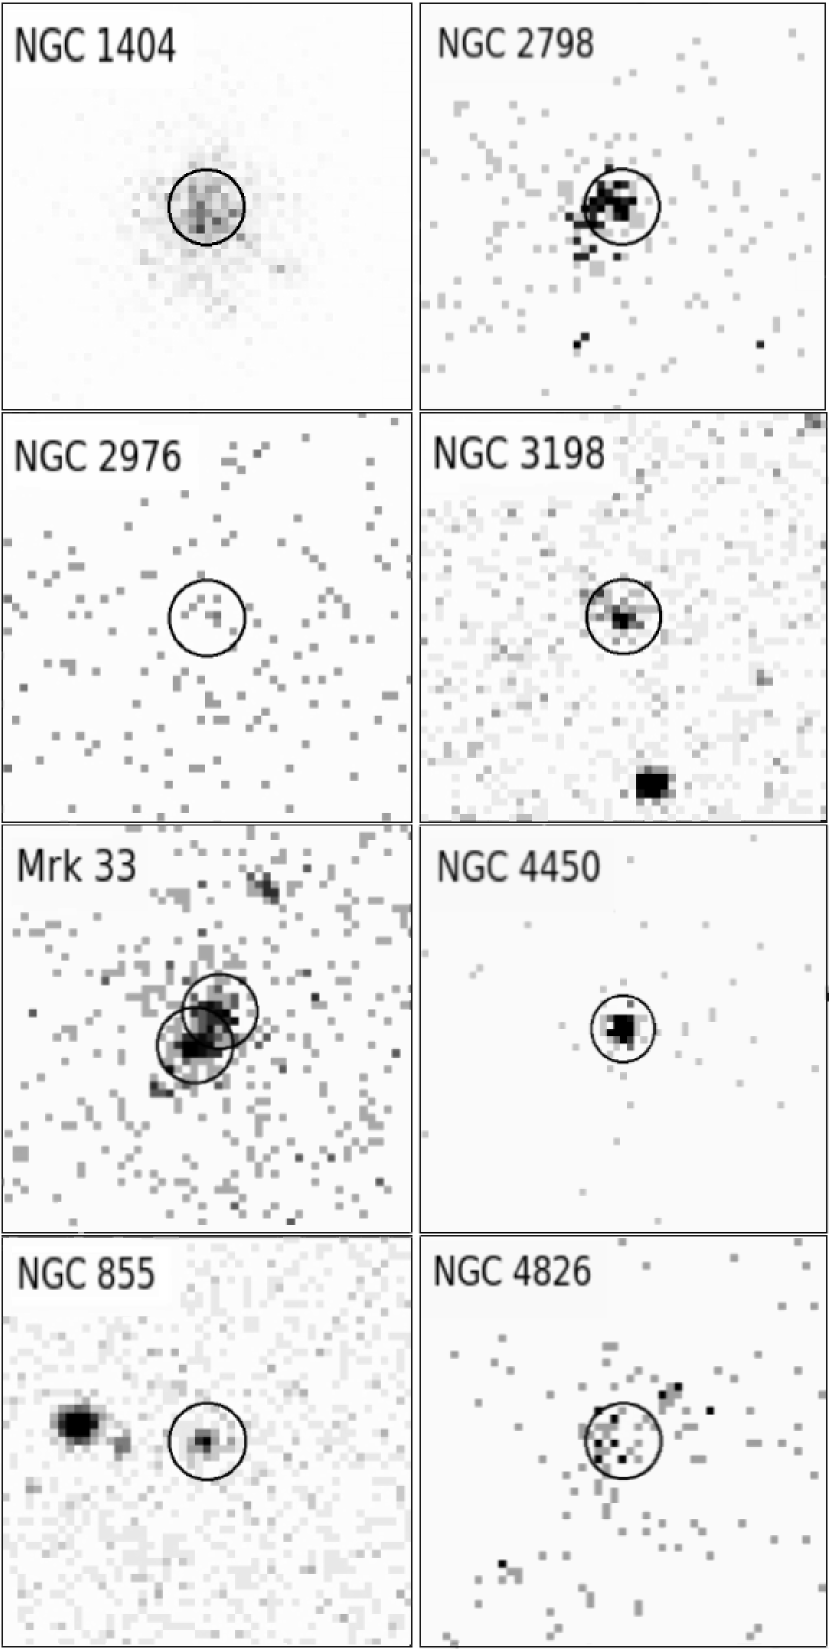
We detected nuclear sources in 37 objects in this sample. Six of these detections are in galaxies that have not yet been examined for nuclear X-ray activity using observations. We also report a new detection in one galaxy (NGC 855) that has been previously searched but its nucleus had not been detected. We discuss the new detections individually below. All quoted X-ray luminosities are calculated using a power law with and Galactic absorption.
In order to quantify our assumptions for AGN activity, we computed IR to X-ray slopes in these new objects to see how they compared with observed slopes in known AGNs. We compare our measured slopes with Laor et al. (1994), who measure the average IR to soft X-ray slope = 0.11 in their sample of quasars, defining as
| (1) |
We estimate for the seven objects discussed individually below. We calculate by using a = 2 power law and our observed integrated 0.3-8 keV fluxes to estimate the flux at 0.3 keV. As mentioned, we have 3.6 m fluxes for all of these objects from Dale et al. (2007), which we use to approximate . Spectral templates from Assef et al. (2010) show that for a typical AGN, the difference in flux between 1.69 m and 3.6 m is about a factor of . We correct our fluxes by this factor, which translates to an increase in in our sources of 0.18. Typical uncertainties in for these 7 measurements are around 0.2. We can then directly compare our slopes with the results of Laor et al; individual measurements are discussed below.
3.1.1 NGC 1404
NGC 1404 is a type E1 galaxy at a distance of 25.1 Mpc. There was no previously listed nuclear classification for this object. There are several publications investigating NGC 1404 in X-rays but to our knowledge, none of them examine the nuclear X-ray properties of the galaxy. We have four observations of NGC 1404 and it was detected in all four; we here report on only the longest observation. NGC 1404 was observed by using the ACIS-I camera for 44 ks and detected with 797 net broadband counts. Its hardness ratio HR. We estimate = 1.55 1040 erg s-1 for this source. This point source was detected in the 2MASS survey with LJ = 7.6 1043 erg s-1, LH = 1.4 1044 erg s-1, and LK = 2.9 1044 erg s-1. Given the 2MASS luminosities, the bolometric luminosity of the source is high enough for it to be an AGN. We measure = ; this slope is consistent with that expected of an AGN as measured by Laor et al. (1994). Based on the image (Figure 1), there is a potential for extended emission as well, which could originate from the circumnuclear region, as observed in Seyfert 2 galaxies (Ghosh et al. 2007).
3.1.2 NGC 2798
This is an SBa galaxy at a distance of 24.7 Mpc that was observed for 5 ks. Its nucleus was listed by Kennicutt et al. (2003) and references therein as a starburst region based on optical spectroscopy. We detect the nucleus with 73 counts; the nuclear source is shown in Figure 1. Its hardness ratio is HR = and we estimate = 7 1039 erg s-1. The nucleus was detected by 2MASS with observed = 4.8 1043 erg s-1, = 1.1 1044 erg s-1, and = 1.7 1044 erg s-1. This source is also detected in FIRST with an integrated 1.4GHz flux density of 61.38 mJy. We measure = , again consistent with the slope expected in AGNs. Because this nuclear source is also an X-ray and radio source and has such high 2MASS luminosities, we identify it here as an AGN, though there is likely a starburst contribution to the X-ray flux.
3.1.3 NGC 2976
This SAc galaxy is at a distance of 3.5 Mpc, and its nucleus is listed as an H ii region in Kennicutt et al. (2003). It was observed for 10 ks and the nucleus was detected with 6 broadband counts. The source is shown in Figure 1. There are insufficient counts to recover a spectrum and HR, but we estimate = 6.2 1036 erg s-1, again using a standard power law model. The nucleus was detected by 2MASS with = 3.5 1040 erg s-1, = 7.6 1040 erg s-1, and = 1.0 1041 erg s-1. The 2MASS luminosities of this source are not as high as the two galaxies listed above, but the band luminosity is high enough that the source is unlikely to be an X-ray binary. We measure = , which is somewhat steeper than expected, but is consistent with an AGN with an obscured X-ray source.
3.1.4 NGC 3198
NGC 3198 is an SBc galaxy at a distance of 9.8 Mpc. It was observed by for 61.8 ks and was detected with 108 broadband counts, corresponding to log = 1.4 1038 erg s-1. The source is shown in Figure 1. The X-ray hardness ratio HR = . The nucleus was detected by 2MASS with = 1.2 1042 erg s-1, = 2.4 1042 erg s-1, and = 4.0 1042 erg s-1. The nucleus is identified in the FIRST survey with an integrated flux density of 1.89 mJy. We measure = , which is again consistent with the presence of an AGN with an obscured central X-ray source. As in the case of NGC 2798 above, this is highly likely to be an AGN based on its 2MASS luminosities and the fact that it is both an X-ray and radio source.
3.1.5 Mrk 33
Mrk 33 is categorized as an irregular galaxy in NED but is listed by SIMBAD as a pair of interacting galaxies at a distance of 21.7 Mpc. Its nucleus is also listed as a starburst region by Kennicutt et al. (2003). The nucleus was detected with two separate components. One source is detected in both the soft and hard bands, but the other source disappears completely in the hard band. Here we focus only on the hard source; while a soft-only source could be an AGN if it is completely obscured and all we see is reprocessed/starburst emission, we cannot be sure without a good quality spectrum. Because the 95% energy radii of the two sources overlap, we were unable to disentangle the two sources completely. Since the counts in the soft band are similar in each source, we extracted counts from a region encircling both sources and halved the number of soft counts to obtain counts for the hard source. We attribute all of the hard counts to the hard source. Our X-ray image is shown in Figure 1. The harder source is detected with 100 broadband counts, corresponding to a luminosity = 2.2 1039 erg s-1. The hardness ratio is HR= . The hard source was detected by 2MASS with = 1.3 1043 erg s-1, = 2.2 1043 erg s-1, and = 2.8 1043 erg s-1. It is also a radio source, detected in the FIRST survey with an integrated flux density of 9.56 mJy. Again, its high 2MASS luminosities and that it is both an X-ray and a radio source merit its inclusion as an AGN candidate. Furthermore, we measure = in this source, again is consistent with our expectations in AGNs. As noted above, we cannot be sure that the soft source is an AGN. However, it is reasonable to suspect that it too is an obscured AGN at the center of the second galaxy of the pair. Much follow up is required on this particular object to determine if this is in fact the case.
3.1.6 NGC 4450
NGC 4450 is an Sab galaxy at a distance of 20 Mpc and its nucleus has been optically identified as a LINER. It was observed by for 3.7 ks and detected with 223 counts. We estimate = 5.0 1040 erg s-1 and hardness ratio HR = . The source is shown in Figure 1. Its nucleus was detected by 2MASS with = 3.8 1043 erg s-1, = 7.6 1043 erg s-1, and = 8.1 1043 erg s-1. We measure = in this source, which again is consistent with expectations in AGNs to within our uncertainties. It is also a radio source detected by FIRST with an integrated flux density of 6.53 mJy, and is clearly an AGN.
3.1.7 NGC 855
There has been some disagreement regarding the morphological classification of NGC 855. While this object is listed as an elliptical, many authors in fact argue that this is a dwarf elliptical galaxy. We discuss its classification further in section 5. We have one 59.48 ks observation of the NGC 855 and detect the nucleus with 108 broad band counts. Zhang et al. (2009) used a 1.7 ks exposure of this object and did not detect the source– this makes our detection a new detection. The nuclear source is shown in Figure 1. We estimate = 1.6 1038 erg s-1. The nucleus was also detected by 2MASS with = 1.5 1042 erg s-1, = 1.5 1042 erg s-1, and = 1.9 1042 erg s-1. We measure = in this source, which again is consistent with expectations in AGNs; this object is very likely an AGN.
3.2 Detections in objects with previous publications
There were 44 objects on which previous analysis has been done; previous publications that investigate the nuclei of these galaxies using observations are listed in Table 1. We analyzed these as well to provide a consistent analysis of the entire sample. Our measurements are presented in Tables 2 and 3. With the exception of NGC 4826, all of our results are consistent with previous measurements. Our measurements for this object are presented below. In the cases of NGC 3521, NGC 3627, NGC 4569, NGC 4594, and NGC 4725, we have analyzed data with longer exposure times than have previously been published.
3.2.1 NGC 4826
NGC 4826 is an SAab galaxy that is optically identified as a Seyfert 2 (Véron-Cetty & Véron 2006). We detect a point source here, while neither Ho et al. (2001) or Zhang et al. (2009) report a nuclear point source detection. Figure 1 shows our image. The detected source is soft, and therefore unlikely to be direct AGN emission. However, this could be an obscured AGN in which only circumnuclear emission is visible, as is often the case with Seyfert 2 galaxies (Ghosh et al. 2007).
3.3 Non-detections
We do not detect a nuclear source in 25 of the galaxies in our sample. Several of these objects are irregular galaxies; for these objects we searched for X-ray sources within a few arcseconds of the galaxy position as listed on NED, since in these cases the “center” of the galaxy is poorly defined. 3 upper limits to all non-detections are given in Table 2; the upper limits were calculated by extracting source counts within a radius circle centered on the nuclear position as listed on NED and background counts from an annulus with the same measurements as the background regions for the detected sources. In all cases, our results are consistent with previous results. In the cases of Ho IX, NGC 4625, NGC 4826, and NGC 5474, we used data with longer exposure times than previous studies, but we still do not detect the nuclei in these sources.
3.4 Results: Summary
Altogether, out of the 75 SINGS galaxies, 62 have data in the archive and we detect nuclear X-ray sources in 37 of them. The nuclear X-ray sources, however, could be stars, binaries, supernova remnants or AGNs. In the Ghost et al. papers (§1) we did extensive spectral, timing and multiwavelength analysis to identify the nuclear X-ray sources. Similarly, we show that the new detections in SINGS galaxies listed above are highly likely to be AGNs by examining their properties in multiple wavelengths as well as comparing their IR to X-ray slopes with those of identified AGNs. As discussed in Ghosh et al. (2010a), when the sample as a whole is considered it becomes statistically unlikely that all detected nuclear X-ray sources are contaminants which happen to be at the center of the galaxy (see also Ho 2009, Zhang et al. 2009). We therefore argue that statistically, most, if not all, of the nuclear X-ray sources in SINGS galaxies are AGNs; we assume them to be AGNs for the rest of this paper.
4 MULTIWAVELENGTH ANALYSIS
4.1 Measurements
As mentioned above, we obtained IRAC and MIPS flux densities from Dale et al. (2007) to see how the X-ray activity is related to other galaxy properties. We converted these flux densities to observed luminosities; since these objects are all at very low redshift, this did not require a K-correction. Figure 2 shows the luminosities of the galaxies plotted against the nuclear (i.e. AGN) X-ray luminosities from this study. We observe correlations between the nuclear X-ray luminosity and mid-infrared luminosity at all wavelengths, but the correlation is the strongest at 3.6, 4.5 and 5.8 m. The measured ratios and intercepts for all of the correlations observed are given in Table 4. We also compute the Spearman and Pearson’s coefficients in each case to determine the strength of the correlation. In both cases, a coefficient of 1 represents a perfect linear correlation between the two parameters, a coefficient of 0 represents no correlation, and negative coefficients show a correlation in the opposite direction. The coefficients are presented in Table 4. We also calculated the probability that the the observed correlation is not real, . The correlations between nuclear X-ray luminosity and infrared luminosities at 3.6, 4.5, and 5.8 m are significant at greater than 99.9%; the correlation at 8 m is significant to 99%, and those at 24, 70, and 160 m, while much weaker than the other correlations, are still correlated at 90% certainty. To ensure that the observed correlations are not artifacts of sample selection or flux limits, we have also included upper limits of non-detections in Figure 2. It is clear that the observed correlations are robust.
Note that our flux measurements measure the infrared fluxes– not just the nuclear fluxes– so comparing 3.6 m and nuclear X-ray luminosity does not simply compare AGN luminosities in two different bands unless the nuclear infrared flux completely dominates the infrared flux of the entire galaxy. To be sure that the nuclei of these galaxies were not dominating the global flux in the infrared, we obtained nuclear surface brightness estimates from Muñoz-Mateos et al. (2009), which allowed us to estimate the total flux within a 6″ radius of the nucleus of each galaxy. We then subtracted this flux from the global IR flux to see how much the total was affected by removing the nuclear component, and in nearly all cases, the removal of the nuclear IR flux did not have a significant effect. This indicates that our global infrared fluxes do in fact represent the flux of the galaxy rather than the AGN. Light at these wavelengths is mostly contributed by stars; the observed correlation between nuclear X-ray luminosity and IR luminosity is therefore a manifestation of an observed relation between AGN luminosity and host galaxy mass. The relationship between and stellar mass in the host bulge has been well-established (e.g. Kormendy & Richstone 1995, Magorrian et al. 1998, Bentz et al. 2009), as has the relationship between the size of the host bulge and the total stellar mass in the galaxy (Ferrarese 2002, Baes et al. 2003). Therefore it would follow that correlates with the host galaxy stellar mass. Our observed correlation between X-ray luminosity and host galaxy stellar mass suggests that accretion rate () also depends on the host galaxy mass; this is a surprising new discovery.
4.2 2MASS , , and band Measurements
We looked for potential relations between nuclear 2MASS luminosities and nuclear X-ray luminosities. As demonstrated in Figure 3, we observe trends with nuclear X-ray luminosity that are well-fit by power laws; the best-fit parameters and correlation coefficients are again given in Table 4. The correlation coefficients indicate that the correlations are significant in all three 2MASS bandpasses shown. Such correlations should exist between X-ray and IR luminosities of AGNs; observations of these correlations further support the identification of nuclear X-ray sources as AGNs. The scatter around the correlations and the non-unity slopes also suggest varying amounts of obscuration, dust or intrinsic variations in the SED.
We also obtained global , , and -band fluxes from Dale et al. (2007). On a global scale, band magnitudes are good stellar mass indicators, so we looked to see if there was a correlation between nuclear X-ray luminosity and global band luminosity. Figure 4 shows this correlation; while shallower than the relation, it is still a rather strong correlation. As with the data, we checked to be sure that the band emission is not dominated by the nuclei, and in most cases it did not. We removed the galaxies in which the nuclear band flux was greater than 50% of the total flux and determined that these objects did not affect the measured correlation.
In addition, we examined the 1.4 GHz fluxes from the FIRST survey (Figure 5) and observe no correlation between the nuclear X-ray flux and the integrated radio flux.
4.3 Star Formation Rates
Several studies in recent years have investigated a possible connection between star formation and AGN luminosity in active galaxies and quasars (e.g. Netzer 2009a, Lutz et al. 2008). These correlations have been measured primarily using star formation rate (SFR) indicators in the FIR, H and O ii fluxes, or features that arise from polycyclic aromatic hydrocarbons (PAHs) that are measured in the mid-infrared. Netzer (2009b) and Lutz et al. (2008) both measure slopes of around 0.8 when comparing the bolometric AGN luminosity (using either or [ O iO ii] to estimate ) to 60 m luminosity. While we do not have the same observables, we can check whether the galaxies in our sample show a correlation between AGN X-ray luminosity and the 70 m luminosity. We find a slope of when comparing to . Since the AGNs are likely to be obscured, perhaps the X-ray luminosity is not a perfect indicator of the total AGN luminosity; the broad correlation between and mentioned above, however, suggests that this is not a bad assumption. A comparison between nuclear K-band luminosity and global results in a slope of 0.2 (see Figure 6). Similarly shallow slopes are observed for correlations between and other FIR measurements (Table 4). Thus, regardless of whether we use X-ray, K-band, or other IR luminosities as indicators of AGN activity, we do not see a strong correlation of AGN activity with star formation activity as seen at higher redshifts.
We also examined the SFRs in our sample of nuclear X-ray detected galaxies using SFRs computed by Calzetti et al. (2010). The SFRs were calculated using the 24 m luminosity combined with the H luminosity as a composite star formaton rate indicator; see Calzetti et al. (2010) for details in these calculations. Figure 7 shows the star formation rate per unit area in our sample. We observe no significant correlation between nuclear X-ray luminosity and SFR, which again is no surprise, as we do not observe a strong correlation between and and therefore do not expect SFRs that are calculated using to correlate either. Total SFR (rather than SFR per unit area) was also examined and shows no significant correlation with .
5 DISCUSSION
In a sample of 62 SINGS galaxies with available archival data, we detect 37 nuclear X-ray sources. Eleven detections are in objects whose nuclei have been identified as LINERs, five detections are in identified H ii regions, twelve are in galaxies hosting Seyfert nuclei, and two occurred in starburst galaxies. The other seven detections were in galaxies which do not have a previous nuclear classification. We argue that most of these 37 detections are likely low-luminosity AGNs. We present nuclear X-ray fluxes, luminosities, and hardness ratios for all of these sources. We look for connections between infrared and X-ray luminosities and observe a correlation between nuclear X-ray luminosity and various IR luminosities, including IRAC 3.6 m and 4.5 m bands and 2MASS , , and bands. Unlike the results for higher redshift AGNs, we find that the AGN activity is not strongly correlated with the star formation activity, though a mild trend is observed. We find instead a strong correlation with the stellar mass of a galaxy. As discussed above, it is well known that the mass of the nuclear BH is correlated with the bulge mass or perhaps the total galaxy mass. Our observations suggest that even the accretion rate depends on the galaxy mass. It is possible that all of the galaxies are emitting at a similar fraction of their Eddington luminosity; galaxies with higher mass BHs would then be more luminous. New observations with (Shao et al. 2010) also show that the correlation between AGN activity and star formation activity disappears at lower AGN luminosity even at higher redshift. It thus appears that the AGN-SFR correlation is not as generic a phenomenon as once thought.
Figure 8 shows the distribution of Hubble types among the SINGS galaxy sample in our study. We show the number of galaxies at each Hubble type and compare this with the number of galaxies with nuclear X-ray detections at each type. We observe nuclear X-ray activity in nearly all of the galaxies towards the early end of the Hubble sequence, and report no detections in Sdm and Sm galaxies and only two nuclear X-ray detections in irregular or peculiar galaxies. We may expect such a result if the bulge-less galaxies do not harbor a nuclear BH. However, this is unlikely to be the case, as BHs in bulge-less galaxies have been detected through optical (Peterson et al. 2005; Shields et al. 2008), IR (Satyapal et al. 2007, 2009) and X-ray (Ghosh et al. 2008) studies. Once again, it may suggest lower accretion rates.
We also show the 3.6 m luminosity of SINGS galaxies as a function of Hubble Type in Figure 9. As one would expect, earlier-type galaxies show a higher 3.6 m luminosity than later-type galaxies, reflecting the differences in stellar mass between early and late-type galaxies. Figure 9 shows that NGC 855 is a significant outlier on the relation. We re-checked the classification of the source and found that there is some disagreement between sources over what type of galaxy this is. While it is listed in the RC3 catalog as an elliptical (de Vaucouleurs et al. 1991), other sources suggest that this galaxy is actually a dwarf elliptical (e.g. Roussel et al. 2007) or even a late-type spiral (Phillips et al. 1996). Our observed correlation supports the reclassification of NGC 855 as a dwarf elliptical.
Given the anticorrelation of m luminosity with the Hubble type and the correlation between m luminosity with X-ray luminosity, we expect to see an anticorrelation between the X-ray luminosity and the Hubble type. However, as shown in Figure 10, there appears to be no correlation between these measurements. This is likely because for every Hubble type there is a wide range of m luminosities and also a wide range of X-ray luminosities. We do notice that none of the galaxies later than = 5 have particularly high .
6 CONCLUSION
We find that about 60% of SINGS galaxies host nuclear X-ray sources which are likely to be AGNs. This fraction is much larger than that found through optical studies (e.g. Ho et al. 1997) and shows the efficacy of X-ray observations to find hidden AGNs in normal galaxies. We find that for our sample of galaxies AGN activity is correlated with the stellar mass of the galaxy. This is a surprising new result and suggests that together with the mass of the SMBH, accretion rate also depends on galaxy mass. Unlike the merger driven black hole growth observed at high redshift for high-luminosity AGN, there appears to be an alternative mode of black hole growth at the present epoch in late type galaxies. It has been suggested in literature that the total mass of a galaxy, not just the bulge mass, is the primary driver of the mass of the SMBH (Ferrarese 2002, Baes et al. 2003); our results support such a scenario.
References
- Assef et al. (2010) Assef, R. J., Kochanek, C. S., Brodwin, M., Cool, R., Forman, W., Gonzalez, A. H., Hickox, R. C., Jones, C., Le Floc’h, E., Moustakas, J., Murray, S. S., & Stern, D. 2010, ApJ, 713, 970
- Baes et al. (2003) Baes, M., Buyle, P., Hau, G. K. T., & Dejonghe, H. 2003, MNRAS, 341, L44
- Bentz et al. (2009) Bentz, M. C., Peterson, B. M., Netzer, H., Pogge, R. W., & Vestergaard, M. 2009, ApJ, in press (astro-ph/0812.2283)
- Blandford & McKee (1982) Blandford, R. D., & McKee, C. F. 1982, ApJ, 255, 419
- Brand et al. (2005) Brand, K., Dey, A., Brown, M. J. I., Watson, C. R., Jannuzi, B. T., Najita, J. R., Kochanek, C. S., Shields, J. C., Fazio, G. G., Forman, W. R., Green, P. J., Jones, C. J., Kenter, A. T., McNamara, B. R., Murray, S. S., Rieke, M., & Vikhlinin, A. 2005, ApJ, 626, 723
- Calzetti et al. (2010) Calzetti, D., Wu, S., Hong, S., Kennicutt, R. C., Lee, J. C., Dale, D. A., Engelbracht, C. W., van Zee, L., Draine, B. T., Hao, C., Gordon, K. D., Moustakas, J., Murphy, E. J., Regan, M., Begum, A., Block, M., Dalcanton, J., Funes, J., Gil de Paz, A., Johnson, B., Sakai, S., Skillman, E., Walter, F., Weisz, D., Williams, B., & Wu, Y. 2010, ApJ, 714, 1256
- Dale et al. (2007) Dale, D. A., Gil de Paz, A., Gordon, K. D., Hanson, H. M., Armus, L., Bendo, G. J., Bianchi, L., Block, M., Boissier, S., Boselli, A., Buckalew, B. A., Buat, V., Burgarella, D., Calzetti, D., Cannon, J. M., Engelbracht, C. W., Helou, G., Hollenbach, D. J., Jarrett, T. H., Kennicutt, R. C., Leitherer, C., Li, A., Madore, B. F., Martin, D. C., Meyer, M. J., Murphy, E. J., Regan, M. W., Roussel, H., Smith, J. D. T., Sosey, M. L., Thilker, D. A., & Walter, F. 2007, ApJ, 655, 863
- de Vaucouleurs et al. (1991) de Vaucouleurs, G., de Vaucouleurs, A., Corwin, Jr., H. G., Buta, R. J., Paturel, G., & Fouqué, P. 1991, Third Reference Catalogue of Bright Galaxies. Volume I: Explanations and references. Volume II: Data for galaxies between 0h and 12h. Volume III: Data for galaxies between 12h and 24h., ed. de Vaucouleurs, G., de Vaucouleurs, A., Corwin, H. G., Jr., Buta, R. J., Paturel, G., & Fouqué, P.
- Desroches & Ho (2009) Desroches, L., & Ho, L. C. 2009, ApJ, 690, 267
- Eracleous et al. (2002) Eracleous, M., Shields, J. C., Chartas, G., & Moran, E. C. 2002, ApJ, 565, 108
- Ferrarese (2002) Ferrarese, L. 2002, 3
- Ferrarese & Ford (2005) Ferrarese, L., & Ford, H. 2005, Space Science Reviews, 116, 523
- Filho et al. (2004) Filho, M. E., Fraternali, F., Markoff, S., Nagar, N. M., Barthel, P. D., Ho, L. C., & Yuan, F. 2004, A&A, 418, 429
- Flohic et al. (2006) Flohic, H. M. L. G., Eracleous, M., Chartas, G., Shields, J. C., & Moran, E. C. 2006, ApJ, 647, 140
- Fruscione et al. (2006) Fruscione, A., McDowell, J. C., Allen, G. E., Brickhouse, N. S., Burke, D. J., Davis, J. E., Durham, N., Elvis, M., Galle, E. C., Harris, D. E., Huenemoerder, D. P., Houck, J. C., Ishibashi, B., Karovska, M., Nicastro, F., Noble, M. S., Nowak, M. A., Primini, F. A., Siemiginowska, A., Smith, R. K., & Wise, M. 2006, in Presented at the Society of Photo-Optical Instrumentation Engineers (SPIE) Conference, Vol. 6270, Society of Photo-Optical Instrumentation Engineers (SPIE) Conference Series
- Gallo et al. (2008) Gallo, E., Treu, T., Jacob, J., Woo, J., Marshall, P. J., & Antonucci, R. 2008, ApJ, 680, 154
- Georgantopoulos et al. (2002) Georgantopoulos, I., Panessa, F., Akylas, A., Zezas, A., Cappi, M., & Comastri, A. 2002, A&A, 386, 60
- Ghosh (2009) Ghosh, H. 2009, PhD thesis, The Ohio State University
- Ghosh et al. (2008) Ghosh, H., Mathur, S., Fiore, F., & Ferrarese, L. 2008, ApJ, 687, 216
- Ghosh et al. (2007) Ghosh, H., Pogge, R. W., Mathur, S., Martini, P., & Shields, J. C. 2007, ApJ, 656, 105
- Ghosh et al. (2010a) Ghosh, H. et al. 2010a, ApJ, submitted
- Ghosh et al. (2010b) —. 2010b, ApJ, submitted
- Gliozzi et al. (2009) Gliozzi, M., Satyapal, S., Eracleous, M., Titarchuk, L., & Cheung, C. C. 2009, ApJ, 700, 1759
- González-Martín et al. (2009) González-Martín, O., Masegosa, J., Márquez, I., Guainazzi, M., & Jiménez-Bailón, E. 2009, A&A, 506, 1107
- Hasinger et al. (2005) Hasinger, G., Miyaji, T., & Schmidt, M. 2005, A&A, 441, 417
- Ho (2009) Ho, L. C. 2009, ApJ, 699, 626
- Ho et al. (2001) Ho, L. C., Feigelson, E. D., Townsley, L. K., Sambruna, R. M., Garmire, G. P., Brandt, W. N., Filippenko, A. V., Griffiths, R. E., Ptak, A. F., & Sargent, W. L. W. 2001, ApJ, 549, L51
- Ho et al. (1997) Ho, L. C., Filippenko, A. V., & Sargent, W. L. W. 1997, ApJ, 487, 568
- Holt et al. (2003) Holt, S. S., Schlegel, E. M., Hwang, U., & Petre, R. 2003, ApJ, 588, 792
- Hughes et al. (2007) Hughes, J. P., Chugai, N., Chevalier, R., Lundqvist, P., & Schlegel, E. 2007, ApJ, 670, 1260
- Irwin et al. (2002) Irwin, J. A., Sarazin, C. L., & Bregman, J. N. 2002, ApJ, 570, 152
- Kaspi et al. (2000) Kaspi, S., Smith, P. S., Netzer, H., Maoz, D., Jannuzi, B. T., & Giveon, U. 2000, ApJ, 533, 631
- Kennicutt et al. (2003) Kennicutt, Jr., R. C., Armus, L., Bendo, G., Calzetti, D., Dale, D. A., Draine, B. T., Engelbracht, C. W., Gordon, K. D., Grauer, A. D., Helou, G., Hollenbach, D. J., Jarrett, T. H., Kewley, L. J., Leitherer, C., Li, A., Malhotra, S., Regan, M. W., Rieke, G. H., Rieke, M. J., Roussel, H., Smith, J., Thornley, M. D., & Walter, F. 2003, PASP, 115, 928
- Kim & Fabbiano (2003) Kim, D., & Fabbiano, G. 2003, ApJ, 586, 826
- Kormendy & Richstone (1995) Kormendy, J., & Richstone, D. 1995, ARA&A, 33, 581
- Laor et al. (1994) Laor, A., Fiore, F., Elvis, M., Wilkes, B. J., & McDowell, J. C. 1994, ApJ, 435, 611
- Li et al. (2009) Li, J., Wang, Q. D., Li, Z., & Chen, Y. 2009, ApJ, 706, 693
- Luo et al. (2007) Luo, B., Chen, J., Zhang, Z., Wang, Y., Wang, J., & Xu, H. 2007, Chinese Journal of Astronomy and Astrophysics, 7, 335
- Lutz et al. (2008) Lutz, D., Sturm, E., Tacconi, L. J., Valiante, E., Schweitzer, M., Netzer, H., Maiolino, R., Andreani, P., Shemmer, O., & Veilleux, S. 2008, ApJ, 684, 853
- Magorrian et al. (1998) Magorrian, J., et al. 1998, AJ, 115, 2285
- Marconi et al. (2004) Marconi, A., Risaliti, G., Gilli, R., Hunt, L. K., Maiolino, R., & Salvati, M. 2004, MNRAS, 351, 169
- Martini et al. (2002) Martini, P., Kelson, D. D., Mulchaey, J. S., & Trager, S. C. 2002, ApJ, 576, L109
- Menci et al. (2004) Menci, N., Fiore, F., Perola, G. C., & Cavaliere, A. 2004, ApJ, 606, 58
- Muñoz-Mateos et al. (2009) Muñoz-Mateos, J. C., Gil de Paz, A., Zamorano, J., Boissier, S., Dale, D. A., Pérez-González, P. G., Gallego, J., Madore, B. F., Bendo, G., Boselli, A., Buat, V., Calzetti, D., Moustakas, J., & Kennicutt, R. C. 2009, ApJ, 703, 1569
- Nemmen et al. (2006) Nemmen, R. S., Storchi-Bergmann, T., Yuan, F., Eracleous, M., Terashima, Y., & Wilson, A. S. 2006, ApJ, 643, 652
- Netzer (2009a) Netzer, H. 2009a, MNRAS, 399, 1907
- Netzer (2009b) —. 2009b, ApJ, 695, 793
- Ochsenbein et al. (2000) Ochsenbein, F., Bauer, P., & Marcout, J. 2000, A&AS, 143, 23
- Peterson (1993) Peterson, B. M. 1993, PASP, 105, 247
- Peterson et al. (2005) Peterson, B. M., Bentz, M. C., Desroches, L., Filippenko, A. V., Ho, L. C., Kaspi, S., Laor, A., Maoz, D., Moran, E. C., Pogge, R. W., & Quillen, A. C. 2005, ApJ, 632, 799
- Phillips et al. (1996) Phillips, A. C., Illingworth, G. D., MacKenty, J. W., & Franx, M. 1996, AJ, 111, 1566
- Pogge & Martini (2002) Pogge, R. W., & Martini, P. 2002, ApJ, 569, 624
- Rasmussen et al. (2008) Rasmussen, J., Ponman, T. J., Verdes-Montenegro, L., Yun, M. S., & Borthakur, S. 2008, MNRAS, 388, 1245
- Rinn et al. (2005) Rinn, A. S., Sambruna, R. M., & Gliozzi, M. 2005, ApJ, 621, 167
- Roussel et al. (2007) Roussel, H., Helou, G., Hollenbach, D. J., Draine, B. T., Smith, J. D., Armus, L., Schinnerer, E., Walter, F., Engelbracht, C. W., Thornley, M. D., Kennicutt, R. C., Calzetti, D., Dale, D. A., Murphy, E. J., & Bot, C. 2007, ApJ, 669, 959
- Satyapal et al. (2005) Satyapal, S., Dudik, R. P., O’Halloran, B., & Gliozzi, M. 2005, ApJ, 633, 86
- Satyapal et al. (2004) Satyapal, S., Sambruna, R. M., & Dudik, R. P. 2004, A&A, 414, 825
- Satyapal et al. (2007) Satyapal, S., Vega, D., Heckman, T., O’Halloran, B., & Dudik, R. 2007, ApJ, 663, L9
- Schlegel & Pannuti (2003) Schlegel, E. M., & Pannuti, T. G. 2003, AJ, 125, 3025
- Shankar et al. (2004) Shankar, F., Salucci, P., Granato, G. L., De Zotti, G., & Danese, L. 2004, MNRAS, 354, 1020
- Shao et al. (2010) Shao, L., Lutz, D., Nordon, R., Maiolino, R., Alexander, D. M., Altieri, B., Andreani, P., Aussel, H., Bauer, F. E., Berta, S., Bongiovanni, A., Brandt, W. N., Brusa, M., Cava, A., Cepa, J., Cimatti, A., Daddi, E., Dominguez-Sanchez, H., Elbaz, D., Förster Schreiber, N. M., Geis, N., Genzel, R., Grazian, A., Gruppioni, C., Magdis, G., Magnelli, B., Mainieri, V., Pérez García, A. M., Poglitsch, A., Popesso, P., Pozzi, F., Riguccini, L., Rodighiero, G., Rovilos, E., Saintonge, A., Salvato, M., Sanchez Portal, M., Santini, P., Sturm, E., Tacconi, L. J., Valtchanov, I., Wetzstein, M., & Wieprecht, E. 2010, A&A, 518, L26+
- Shields et al. (2008) Shields, J. C., Walcher, C. J., Böker, T., Ho, L. C., Rix, H., & van der Marel, R. P. 2008, ApJ, 682, 104
- Skrutskie et al. (2006) Skrutskie, M. F., Cutri, R. M., Stiening, R., Weinberg, M. D., Schneider, S., Carpenter, J. M., Beichman, C., Capps, R., Chester, T., Elias, J., Huchra, J., Liebert, J., Lonsdale, C., Monet, D. G., Price, S., Seitzer, P., Jarrett, T., Kirkpatrick, J. D., Gizis, J. E., Howard, E., Evans, T., Fowler, J., Fullmer, L., Hurt, R., Light, R., Kopan, E. L., Marsh, K. A., McCallon, H. L., Tam, R., Van Dyk, S., & Wheelock, S. 2006, AJ, 131, 1163
- Strickland et al. (2004) Strickland, D. K., Heckman, T. M., Colbert, E. J. M., Hoopes, C. G., & Weaver, K. A. 2004, ApJS, 151, 193
- Swartz et al. (2003) Swartz, D. A., Ghosh, K. K., McCollough, M. L., Pannuti, T. G., Tennant, A. F., & Wu, K. 2003, ApJS, 144, 213
- Swartz et al. (2006) Swartz, D. A., Yukita, M., Tennant, A. F., Soria, R., & Ghosh, K. K. 2006, ApJ, 647, 1030
- Terashima & Wilson (2001) Terashima, Y., & Wilson, A. S. 2001, ApJ, 560, 139
- Terashima & Wilson (2003) —. 2003, ApJ, 583, 145
- Terashima & Wilson (2004) —. 2004, ApJ, 601, 735
- Véron-Cetty & Véron (2006) Véron-Cetty, M., & Véron, P. 2006, A&A, 455, 773
- Veron-Cetty & Veron (2010) Veron-Cetty, M. P., & Veron, P. 2010, VizieR Online Data Catalog, 7258, 0
- Wandel et al. (1999) Wandel, A., Peterson, B. M., & Malkan, M. A. 1999, ApJ, 526, 579
- White et al. (1997) White, R. L., Becker, R. H., Helfand, D. J., & Gregg, M. D. 1997, ApJ, 475, 479
- Xu et al. (2005) Xu, Y., Xu, H., Zhang, Z., Kundu, A., Wang, Y., & Wu, X. 2005, ApJ, 631, 809
- Zhang et al. (2009) Zhang, W. M., Soria, R., Zhang, S. N., Swartz, D. A., & Liu, J. F. 2009, ApJ, 699, 281


| RA | DEC | Morphological | T | Nuclear | Dist | ||||
|---|---|---|---|---|---|---|---|---|---|
| Galaxy | (J2000) | (J2000) | Type (RC3) | (RC3) | TypeaaNuclear identifications: S=Seyfert, SB= starburst, H= nuclear H iiregion, L= Liner nucleus. Most values are from the RC3 catalog and have been supplemented by values from Veron-Cetty & Veron (2010). | (Mpc)bbFrom Kennicutt et al. (2003) | R magbbFrom Kennicutt et al. (2003) | PublicationsccPublications containing analyses of galactic nuclei using data. References: (1) This paper; (2) Zhang et al. 2009; (3) Ho 2009; (4) Ghosh 2009; (5) Desroches & Ho 2009; (6) Nemmen et al. 2006; (7) Irwin et al. 2002; (8) Kim & Fabbiano 2003; (9) Rinn et al. 2005; (10 Strickland et al. 2004; (11)Schlegel & Pannuti 2003; (12) González-Martín et al. 2009 (13) Ho et al. 2001; (14) Swartz et al. 2003; (15) Hughes et al. 2007; (16) Rasmussen et al. 2008; (17) Ghosh et al. 2008; (18) Swartz et al. 2006; (19) Gliozzi et al. 2009; (20) Flohic et al. 2006; (21) Satyapal et al. 2004; (22) Gallo et al. 2008; (23) Xu et al. 2005; (24) Satyapal et al. 2005; (25) Filho et al. 2004; (26) Eracleous et al. 2002; (27) Terashima & Wilson 2003; (28) Luo et al. 2007; (29) Terashima & Wilson 2001; (30) Georgantopoulos et al. 2002; (31) Terashima & Wilson 2004; (32) Li et al. 2009; (33) Holt et al. 2003. | |
| NGC 0024 | 00 09 56.5 | 24 57 47 | SAc | 5 | 8.2 | 18.4 | 1 | ||
| NGC 0337 | 00 59 50.1 | 07 34 41 | SBd | 7 | 25 | 20.3 | |||
| NGC 0584 | 01 31 20.7 | 06 52 05 | E4 | -5 | 28 | 22.2 | |||
| NGC 0628 | 01 36 41.8 | +15 47 00 | SAc | 5 | 11 | 20.9 | 2,3, 4 | ||
| NGC 0855 | 02 14 03.6 | +27 52 38 | E | -5 | 9.6 | 17.7 | 2 | ||
| NGC 0925 | 02 27 16.9 | +33 34 45 | SABd | 7 | H | 10.1 | 20.6 | 2,5 | |
| NGC 1097 | 02 46 19.0 | 30 16 30 | SBb | 3 | L | 16.9 | 22.4 | 6 | |
| NGC 1266 | 03 16 00.7 | 02 25 38 | SB0 | -2 | Sy | 31.3 | 21.1 | ||
| NGC 1291 | 03 17 18.6 | 41 06 29 | SBa | 0 | 9.7 | 22.0 | 2,4, 7 | ||
| NGC 1316 | 03 22 41.7 | 37 12 30 | SAB0 | -2 | L | 26.3 | 23.5 | 8, 9 | |
| NGC 1377 | 03 36 39.1 | 20 54 08 | S0 | -2 | H | 24.4 | 19.6 | ||
| NGC 1404 | 03 38 51.9 | 35 35 40 | E1 | -5 | 25.1 | 22.9 | 1 | ||
| NGC 1482 | 03 54 38.9 | 20 30 09 | SA0 | -0.8 | 22 | 20.5 | 10 | ||
| NGC 1512 | 04 03 54.3 | 43 20 56 | SBab | 1 | SB | 10.4 | 19.9 | ||
| NGC 1566 | 04 20 00.4 | 54 56 16 | SABbc | 4 | Sy1.5 | 18 | 21.9 | ||
| NGC 1705 | 04 54 13.5 | 53 21 40 | Am | -3 | SB | 5.8 | 16.7 | 2 | |
| NGC 2403 | 07 36 51.4 | +65 36 09 | SABcd | 6 | H | 3.5 | 19.7 | 2,5, 11 | |
| Ho II | 08 19 05.0 | +70 43 12 | Im | 10 | 3.5 | 17.1 | |||
| M81 DwA | 08 23 55.1 | +71 01 56 | Im | 10 | 3.5 | 1 | |||
| DDO 053 | 08 34 07.2 | +66 10 54 | Im | 10 | 3.5 | 13.6 | 1 | ||
| NGC 2798 | 09 17 22.9 | +41 59 59 | SBa | 1 | SB | 24.7 | 19.6 | 1 | |
| NGC 2841 | 09 22 02.6 | +50 58 35 | SAb | 3 | Sy3 | 9.8 | 20.7 | 12, 13 | |
| NGC 2915 | 09 26 11.5 | 76 37 35 | I0 | 90 | SB | 2.7 | 15.1 | 1 | |
| Ho I | 09 40 32.3 | +71 10 56 | IABm | 10 | 3.5 | 13.2 | 1 | ||
| NGC 2976 | 09 47 15.4 | +67 54 59 | SAc | 5 | H | 3.5 | 17.6 | 1 | |
| NGC 3049 | 09 54 49.5 | +09 16 16 | SBab | 2 | SB | 19.6 | 18.7 | ||
| NGC 3031 (M81) | 09 55 33.2 | +69 03 55 | SAab | 2 | L | 3.5 | 21.2 | 2,13, 14 | |
| NGC 3034 (M82) | 09 55 52.7 | +69 40 46 | IO | 90 | SB | 3.5 | 17.9 | 2 | |
| Ho IX | 09 57 32.0 | +69 02 45 | Im | 10 | 3.5 | 13.6 | 2 | ||
| M81 DwB | 10 05 30.6 | +70 21 52 | Im | 10 | 3.5 | 12.5 | 1 | ||
| NGC 3190 | 10 18 05.6 | +21 49 55 | SAap | 1 | L | 17.4 | 20.7 | 15, 16 | |
| NGC 3184 | 10 18 17.0 | +41 25 28 | SABcd | 6 | H | 8.6 | 19.0 | 2,5, 17 | |
| NGC 3198 | 10 19 54.9 | +45 32 59 | SBc | 5 | 9.8 | 20.2 | 1 | ||
| IC 2574 | 10 28 23.5 | +68 24 44 | SABm | 9 | 3.5 | 17.7 | 2 | ||
| NGC 3265 | 10 31 06.8 | +28 47 48 | E | -5 | 20 | 17.7 | |||
| Mrk 33 | 10 32 31.9 | +54 24 04 | Im | 10 | SB | 21.7 | 18.4 | 1 | |
| NGC 3351 | 10 43 57.7 | +11 42 14 | SBb | 3 | SB | 9.3 | 20.4 | 2,18 | |
| NGC 3521 | 11 05 48.6 | 00 02 09 | SABbc | 4 | L | 9 | 21.0 | 2 | |
| NGC 3621 | 11 18 16.5 | -32 48 51 | Sad | 7 | Sy2 | 6.2 | 19.4 | 19 | |
| NGC 3627 | 11 20 15.0 | +12 59 30 | SABb | 3 | Sy3 | 8.9 | 20.8 | 2,13 | |
| NGC 3773 | 11 38 12.9 | +12 06 43 | SA0 | -2 | 12.9 | 17.5 | |||
| NGC 3938 | 11 52 49.4 | +44 07 15 | SAc | 5 | 12.2 | 20.1 | 1 | ||
| NGC 4125 | 12 08 06.0 | +65 10 27 | E6p | -5 | 21.4 | 21.6 | 11,20, 21 | ||
| NGC 4236 | 12 16 42.1 | +69 27 45 | SBdm | 8 | 3.5 | 18.1 | 1 | ||
| NGC 4254 | 12 18 49.6 | +14 24 59 | SAc | 5 | 20 | 21.6 | 4 | ||
| NGC 4321 | 12 22 54.9 | +15 49 21 | SABbc | 4 | L | 20 | 22.1 | 2,12, 13 | |
| NGC 4450 | 12 28 29.6 | +17 05 06 | SAab | 2 | L | 20 | 21.4 | 3 | |
| NGC 4536 | 12 34 27.0 | +02 11 17 | SABbc | 4 | H | 25 | 20.8 | ||
| NGC 4552 | 12 35 39.8 | +12 33 23 | E0 | -5 | Sy2 | 20 | 20.8 | 20, 22, 23, 3, 12,24,25 | |
| NGC 4559 | 12 35 57.7 | +27 57 35 | SABcd | 6 | H | 11.6 | 21.0 | 2,5 | |
| NGC 4569 | 12 36 49.8 | +13 09 46 | SABab | 2 | Sy | 20 | 22.0 | 13, 21 | |
| NGC 4579 | 12 37 43.5 | +11 49 05 | SABb | 3 | L | 20 | 21.8 | 13, 21, 12,26 | |
| NGC 4594 | 12 39 59.4 | 11 37 23 | SAa | 1 | Sy3 | 13.7 | 21.5 | 2, 12, 13 | |
| NGC 4625 | 12 41 52.7 | +41 16 26 | SABmp | 9 | Sy | 9.5 | 17.5 | 2,5 | |
| NGC 4631 | 12 42 08.0 | +32 32 29 | SBd | 7 | 9 | 20.6 | 2,5 | ||
| NGC 4725 | 12 50 26.6 | +25 30 03 | SABab | 2 | Sy2 | 17.1 | 22.0 | 2,13 | |
| NGC 4736 | 12 50 53.0 | +41 07 14 | SAab | 2 | Sy | 5.3 | 19.9 | 2,12,24,26 | |
| DDO 154 | 12 54 05.2 | +27 08 59 | IBm | 10 | 5.4 | 15.1 | 1 | ||
| NGC 4826 | 12 56 43.7 | +21 40 58 | SAab | 2 | Sy2 | 5.6 | 20.3 | 2,13 | |
| DDO 165 | 13 06 24.8 | +67 42 25 | Im | 10 | 3.5 | 15.3 | 1 | ||
| NGC 5033 | 13 13 27.5 | +36 35 38 | SAc | 5 | Sy2 | 13.3 | 20.9 | 13,27 | |
| NGC 5055 | 13 15 49.3 | +42 01 45 | SAbc | 4 | H/L | 8.2 | 19.0 | 20,2,12,28 | |
| NGC 5194 (M51) | 13 29 52.7 | +47 11 43 | SABbc | 4 | Sy2 | 8.2 | 21.4 | 2,12,29,21 | |
| NGC 5195 | 13 29 59.6 | +47 15 58 | SB0p | 90 | L | 8.2 | 20.0 | 30,13,21,2,31 | |
| NGC 5398 | 14 01 21.5 | 33 03 50 | SBdm | 8.1 | H | 15 | 18.9 | ||
| NGC 5408 | 14 03 20.9 | 41 22 40 | IBm | 90 | 4.5 | 16.1 | 1 | ||
| NGC 5474 | 14 05 01.6 | +53 39 44 | SAcd | 6 | H | 6.9 | 18.4 | 2, 5 | |
| NGC 5713 | 14 40 11.5 | 00 17 20 | SABbcp | 4 | 26.6 | 20.9 | |||
| NGC 5866 (M102) | 15 06 29.5 | +55 45 48 | SA0 | -1 | Sy | 12.5 | 19.9 | 12, 20, 24, 32, 27 | |
| IC 4710 | 18 28 38.0 | 66 58 56 | SBm | 9 | SB | 8.5 | 18.3 | ||
| NGC 6822 | 19 44 56.6 | 14 47 21 | IBm | 10 | 0.6 | 13.8 | 2 | ||
| NGC 6946 | 20 34 52.3 | +60 09 14 | SABcd | 6 | H | 5.5 | 21.3 | 5, 2, 33 | |
| NGC 7331 | 22 37 04.1 | +34 24 56 | SAb | 3 | L | 15.7 | 21.8 | 2, 12, 20, 21 | |
| NGC 7552 | 23 16 10.8 | 42 35 05 | SAc | 2 | H | 22.3 | 21.7 | 4 | |
| NGC 7793 | 23 57 49.8 | 32 35 28 | SAd | 7 | H | 3.2 | 18.2 | 5 |
| Observation | Exposure | Source | Source | Bkg/Src | Broad | Broad | Net | Net | Net | Hardness | |||
|---|---|---|---|---|---|---|---|---|---|---|---|---|---|
| Object | OBSID | Date | Time (ks) | CCD | RA | DEC | RatioaaThe ratio of the area of the background extraction region to the area of the source extraction region. | Source | Bkg | Broad | Hard | Soft | Ratio |
| NGC 0024 | 9547 | 13. October 2008 | 43.22 | 7 | 19.60 | 42 | 7 | 6 | 4 | ||||
| NGC 0628 | 2057 | 19. June 2001 | 43.2 | 7 | 01:36:41.74 | 15:47:01.19 | 19.73 | 97 | 42 | 95 | 22 | 73 | -0.529 |
| NGC 0855 | 9550 | 3. October 2008 | 58.73 | 7 | 02:14:03.50 | 27:52:38.40 | 18.92 | 108 | 98 | 103 | 33 | 69 | -0.349 |
| NGC 0925 | 7104 | 23. November 2005 | 2.24 | 7 | 02:27:16.87 | 33:34:45.30 | 20.91 | 13 | 4 | 13 | 0 | 13 | |
| NGC 1097**These galaxies have multiple observations; we present here only the results from the longest and/or most recent data sets. | 2339 | 28. January 2001 | 4 | 7 | 02:46:18.97 | -30:16:28.98 | 20.21 | 1263 | 382 | 1244 | 209 | 1035 | -0.663 |
| NGC 1291**These galaxies have multiple observations; we present here only the results from the longest and/or most recent data sets. | 795 | 18. July 2001 | 37.27 | 7 | 03:17:18.59 | -41:06:28.72 | 17.40 | 1102 | 430 | 1077 | 421 | 656 | -0.218 |
| NGC 1316 | 2022 | 17. April 2001 | 25.85 | 7 | 03:22:41.69 | -37:12:28.71 | 16.81 | 702 | 1483 | 614 | 57 | 557 | -0.814 |
| NGC 1404 | 4174 | 28. May 2003 | 43.46 | 3 | 03:38:51.93 | -35:35:39.06 | 19.79 | 938 | 2782 | 797 | 38 | 759 | -0.904 |
| NGC 1482 | 2932 | 5. February 2002 | 24.72 | 7 | 03:54:39.32 | -20:30:09.53 | 19.66 | 417 | 899 | 372 | 172 | 200 | -0.077 |
| NGC 1705 | 3930 | 12. September 2003 | 45.31 | 7 | 20.94 | 76 | 9 | 4 | 8 | ||||
| NGC 2403 | 4628 | 23. August 2004 | 46.21 | 7 | 20.94 | 42 | 4 | 2 | 3 | ||||
| M81 DwA | 9535 | 24. August 2008 | 25.92 | 7 | 20.94 | 14 | 2 | 2 | 2 | ||||
| DDO 053 | 9538 | 3. February 2008 | 19.02 | 7 | 20.94 | 21 | 3 | 2 | 2 | ||||
| NGC 2798 | 10567 | 24. January 2009 | 5.11 | 7 | 09:17:22.74 | 42:00:00.12 | 21.00 | 76 | 64 | 73 | 7 | 66 | -0.82 |
| NGC 2841 | 6096 | 18. December 2004 | 26.95 | 7 | 09:22:02.68 | 50:58:35.78 | 19.75 | 230 | 193 | 220 | 36 | 184 | -0.672 |
| NGC 2915 | 9534 | 10. April 2008 | 15.36 | 7 | 20.94 | 17 | 8 | 5 | 6 | ||||
| Ho I | 9539 | 22. June 2008 | 25.92 | 7 | 20.94 | 21 | 4 | 2 | 4 | ||||
| NGC 2976 | 9542 | 24. March 2008 | 9.82 | 7 | 09:47:15.35 | 67:55:00.10 | 21.00 | 7 | 17 | 6 | 5 | 1 | |
| NGC 3031**These galaxies have multiple observations; we present here only the results from the longest and/or most recent data sets. | 735 | 7. May 2000 | 49.07 | 7 | 09:55:33.37 | 69:03:53.49 | 20.94 | 4349 | 4421 | 4099 | 1413 | 2686 | -0.311 |
| NGC 3034 **These galaxies have multiple observations; we present here only the results from the longest and/or most recent data sets. | 8190 | 2. June 2007 | 48.99 | 7 | 14.20 | 13967 | 138 | 71 | 118 | ||||
| Ho IX | 9540 | 24. August 2008 | 25.72 | 7 | 20.94 | 32 | 6 | 3 | 5 | ||||
| M81 DwB | 9536 | 7. July 2008 | 24.93 | 7 | 20.60 | 24 | 7 | 4 | 6 | ||||
| NGC 3190**These galaxies have multiple observations; we present here only the results from the longest and/or most recent data sets. | 2760 | 14. March 2002 | 19.81 | 7 | 10:18:05.63 | 21:49:56.39 | 21.00 | 225 | 98 | 220 | 75 | 145 | -0.317 |
| NGC 3184 | 804 | 8. January 2000 | 37.38 | 7 | 10:18:16.85 | 41:25:26.06 | 19.99 | 99 | 61 | 96 | 8 | 88 | -0.837 |
| NGC 3198 | 9551 | 5. February 2008 | 61.63 | 7 | 10:19:54.95 | 45:32:58.68 | 19.24 | 112 | 73 | 108 | 25 | 83 | -0.535 |
| IC 2574**These galaxies have multiple observations; we present here only the results from the longest and/or most recent data sets. | 9541 | 30. June 2008 | 10.78 | 3 | 20.94 | 6 | 2 | 1 | 1 | ||||
| Mrk 33 | 9519 | 1. February 2008 | 18.25 | 7 | 10:32:32.01 | 54:24:02.16 | 22.40 | 103 | 70 | 100 | 18 | 82 | -0.640 |
| NGC 3351**These galaxies have multiple observations; we present here only the results from the longest and/or most recent data sets. | 5931 | 1. July 2005 | 39.55 | 7 | 17.67 | 572 | 33 | 6 | 32 | ||||
| NGC 3521**These galaxies have multiple observations; we present here only the results from the longest and/or most recent data sets. | 9552 | 28. January 2008 | 69.69 | 3 | 11:05:48.51 | -00:02:09.50 | 16.64 | 302 | 159 | 292 | 74 | 218 | -0.492 |
| NGC 3621 | 9278 | 6. March 2008 | 19.45 | 7 | 11:18:16.50 | -32:48:50.59 | 20.00 | 23 | 39 | 21 | 3 | 19 | -0.76 |
| NGC 3627 | 9548 | 3. November 1999 | 49.54 | 7 | 11:20:15.00 | 12:59:30.40 | 15.95 | 266 | 234 | 251 | 57 | 195 | -0.549 |
| NGC 3938 | 7862 | 16. October 2008 | 4.89 | 7 | 19.82 | 21 | 3 | 2 | 2 | ||||
| NGC 4125 | 2071 | 9. September 2001 | 62.97 | 7 | 12:08:05.95 | 65:10:27.45 | 16.86 | 310 | 920 | 255 | 20 | 235 | -0.841 |
| NGC 4236 | 9543 | 20. February 2008 | 10.87 | 3 | 20.89 | 9 | 2 | 2 | 1 | ||||
| NGC 4254 | 7863 | 21. November 2007 | 5.07 | 7 | 18.47 | 30 | 5 | 2 | 4 | ||||
| NGC 4321**These galaxies have multiple observations; we present here only the results from the longest and/or most recent data sets. | 6727 | 18. February 2006 | 37.55 | 7 | 12:22:54.98 | 15:49:20.18 | 19.83 | 168 | 629 | 136 | 7 | 129 | -0.898 |
| NGC 4450 | 3997 | 30. April 2003 | 1.59 | 7 | 12:28:29.59 | 17:05:05.81 | 21.00 | 223 | 12 | 222 | 34 | 188 | -0.695 |
| NGC 4552 | 2072 | 22. April 2001 | 53.79 | 7 | 12:35:39.81 | 12:33:23.05 | 18.68 | 1856 | 3372 | 1675 | 157 | 1518 | -0.812 |
| NGC 4559**These galaxies have multiple observations; we present here only the results from the longest and/or most recent data sets. | 2027 | 4. June 2001 | 8.87 | 7 | 20.94 | 38 | 5 | 2 | 5 | ||||
| NGC 4569 | 5911 | 13. November 2005 | 31.29 | 7 | 12:36:49.81 | 13:09:46.09 | 20.45 | 681 | 259 | 668 | 84 | 584 | -0.748 |
| NGC 4579 | 807 | 2. May 2000 | 29.95 | 7 | 12:37:43.52 | 11:49:05.61 | 18.62 | 19026 | 1637 | 18938 | 4316 | 14622 | -0.544 |
| NGC 4594**These galaxies have multiple observations; we present here only the results from the longest and/or most recent data sets. | 9533 | 2. December 2008 | 79.74 | 3 | 12:39:59.47 | -11:37:22.13 | 13.34 | 5154 | 454 | 5120 | 1460 | 3660 | -0.430 |
| NGC 4625 | 9549 | 5. March 2008 | 54.85 | 7 | 18.87 | 76 | 10 | 7 | 8 | ||||
| NGC 4631 | 797 | 16. April 2000 | 57.32 | 7 | 19.30 | 97 | 10 | 7 | 7 | ||||
| NGC 4725**These galaxies have multiple observations; we present here only the results from the longest and/or most recent data sets. | 2976 | 2. December 2002 | 24.64 | 7 | 12:50:26.59 | 25:30:02.82 | 21.00 | 257 | 114 | 252 | 7 | 244 | -0.941 |
| NGC 4736**These galaxies have multiple observations; we present here only the results from the longest and/or most recent data sets. | 808 | 13. May 2000 | 43.72 | 7 | 12:50:53.07 | 41:07:12.99 | 14.03 | 3851 | 1354 | 3754 | 428 | 3327 | -0.772 |
| DDO 154 | 9544 | 3. April 2008 | 59.2 | 7 | 20.94 | 64 | 6 | 4 | 5 | ||||
| NGC 4826 | 411 | 27. March 2000 | 1.8 | 7 | 12:56:43.60 | 21:40:57.98 | 20.62 | 22 | 38 | 20 | 0 | 20 | |
| DDO 165 | 9537 | 8. February 2009 | 0 | 7 | 20.94 | 12 | 2 | 1 | 2 | ||||
| NGC 5033 | 412 | 28. April 2000 | 2.9 | 7 | 13:13:27.47 | 36:35:38.15 | 21.00 | 1148 | 74 | 1144 | 346 | 799 | -0.396 |
| NGC 5055 | 2197 | 27. August 2001 | 28 | 7 | 13:15:49.28 | 42:01:45.77 | 18.70 | 370 | 252 | 357 | 78 | 278 | -0.562 |
| NGC 5194**These galaxies have multiple observations; we present here only the results from the longest and/or most recent data sets. | 3932 | 7. August 2003 | 41.02 | 7 | 13:29:52.71 | 47:11:42.98 | 17.17 | 915 | 1462 | 830 | 76 | 754 | -0.818 |
| NGC 5195 | 414 | 23. January 2000 | 1.14 | 7 | 13:29:59.49 | 47:15:57.86 | 21.00 | 12 | 16 | 11 | 2 | 9 | -0.64 |
| NGC 5408**These galaxies have multiple observations; we present here only the results from the longest and/or most recent data sets. | 4558 | 29. January 2005 | 4.1 | 7 | 20.94 | 14 | 2 | 1 | 2 | ||||
| NGC 5474 | 9546 | 3. December 2007 | 29.76 | 7 | 20.94 | 37 | 4 | 3 | 3 | ||||
| NGC 5866 | 2879 | 14. November 2002 | 30.26 | 7 | 15:06:29.58 | 55:45:48.48 | 18.51 | 40 | 242 | 27 | 19 | 8 | 0.389 |
| IC 4710**These galaxies have multiple observations; we present here only the results from the longest and/or most recent data sets. | 9570 | 25. June 2008 | 30.36 | 7 | 20.91 | 34 | 6 | 5 | 3 | ||||
| NGC 6822 | 2925 | 4. November 2002 | 20.21 | 3 | 21.25 | 5 | 1 | 1 | 0 | ||||
| NGC 6946**These galaxies have multiple observations; we present here only the results from the longest and/or most recent data sets. | 1043 | 7. September 2001 | 58.29 | 7 | 20:34:52.31 | 60:09:14.39 | 18.77 | 549 | 239 | 536 | 100 | 436 | -0.628 |
| NGC 7331 | 2198 | 27. January 2001 | 27.9 | 7 | 22:37:04.00 | 34:24:55.53 | 17.11 | 152 | 291 | 135 | 29 | 106 | -0.577 |
| NGC 7552 | 7848 | 31. March 2007 | 5.08 | 7 | 23:16:10.66 | -42:35:03.64 | 21.00 | 207 | 238 | 196 | 13 | 183 | -0.87 |
| NGC 7793 | 3954 | 6. September 2003 | 46.41 | 7 | 20.94 | 30 | 8 | 4 | 7 |
| 0.3-8 keV | 0.3-8 keV | ||
|---|---|---|---|
| Count rate | Flux | log | |
| Object | (10-3 counts s-1) | (10-14 erg s-1 cm-2) | (erg s-1) |
| NGC 0024 | 2 | 0.12 | 36.97 |
| NGC 0628 | 22 2 | 1.48 0.15 | 38.33 0.04 |
| NGC 0855 | 18 2 | 1.18 0.12 | 38.21 0.03 |
| NGC 0925 | 57 16 | 3.85 1.08 | 38.67 0.12 |
| NGC 1097 | 3109 88 | 208.5 5.91 | 40.85 0.01 |
| NGC 1291 | 289 9 | 19.38 0.59 | 39.34 0.01 |
| NGC 1316 | 237 10 | 15.92 0.64 | 40.12 0.02 |
| NGC 1404 | 183 6 | 20.57 0.73 | 40.19 0.02 |
| NGC 1482 | 150 8 | 10.09 0.52 | 39.77 0.02 |
| NGC 1705 | 2 | 0.13 | 36.72 |
| NGC 2403 | 1 | 0.06 | 35.96 |
| M81 DwA | 1 | 0.06 | 35.97 |
| DDO 053 | 2 | 0.11 | 36.19 |
| NGC 2798 | 143 17 | 9.58 1.12 | 39.84 0.05 |
| NGC 2841 | 82 6 | 5.49 0.37 | 38.8 0.03 |
| NGC 2915 | 5 | 0.35 | 36.48 |
| Ho I | 2 | 0.11 | 36.21 |
| NGC 2976 | 6 3 | 0.42 0.17 | 36.79 0.17 |
| NGC 3031 | 835 13 | 57.62 0.90 | 38.93 0.01 |
| NGC 3034 | 28 | 1.89 | 37.44 |
| Ho IX | 2 | 0.15 | 36.33 |
| M81 DwB | 3 | 0.18 | 36.43 |
| NGC 3190 | 111 7 | 7.46 0.50 | 39.43 0.03 |
| NGC 3184 | 26 3 | 1.73 0.18 | 38.18 0.04 |
| NGC 3198 | 18 2 | 1.18 0.11 | 38.13 0.04 |
| IC 2574 | 1 | 0.17 | 36.38 |
| Mrk 33 | 48 5 | 3.84 0.38 | 39.26 0.05 |
| NGC 3351 | 8 | 0.55 | 37.76 |
| NGC 3521 | 42 2 | 4.56 0.27 | 38.64 0.03 |
| NGC 3621 | 11 2 | 0.81 0.18 | 37.57 0.09 |
| NGC 3627 | 51 3 | 3.40 0.21 | 38.51 0.03 |
| NGC 3938 | 6 | 0.42 | 37.88 |
| NGC 4125 | 41 3 | 2.72 0.17 | 39.17 0.03 |
| NGC 4236 | 2 | 0.20 | 36.47 0 |
| NGC 4254 | 9 | 0.62 | 38.47 |
| NGC 4321 | 36 3 | 2.43 0.21 | 39.07 0.04 |
| NGC 4450 | 1395 94 | 93.51 6.27 | 40.65 0.03 |
| NGC 4552 | 312 8 | 20.88 0.51 | 40 0.01 |
| NGC 4559 | 6 | 0.38 | 37.79 |
| NGC 4569 | 214 8 | 14.31 0.55 | 39.84 0.02 |
| NGC 4579 | 6323 46 | 423.80 3.08 | 41.31 0 |
| NGC 4594 | 642 9 | 69.87 0.98 | 40.2 0.01 |
| NGC 4625 | 2 | 0.13 | 37.14 |
| NGC 4631 | 2 | 0.12 | 37.05 |
| NGC 4725 | 102 6 | 6.86 0.43 | 39.38 0.03 |
| NGC 4736 | 859 14 | 57.66 0.94 | 39.29 0.01 |
| DDO 154 | 1 | 0.07 | 36.38 |
| NGC 4826 | 112 25 | 8.34 1.86 | 38.5 0.1 |
| DDO 165 | 2 | 0.11 | 36.22 |
| NGC 5033 | 3944 117 | 265.0 7.86 | 40.75 0.01 |
| NGC 5055 | 127 7 | 8.55 0.45 | 38.84 0.02 |
| NGC 5194 | 202 7 | 13.57 0.47 | 39.04 0.02 |
| NGC 5195 | 99 29 | 7.37 2.20 | 38.38 0.13 |
| NGC 5408 | 6 | 0.40 | 36.99 |
| NGC 5474 | 1 | 0.09 | 36.71 |
| NGC 5866 | 9 2 | 0.60 0.11 | 38.05 0.08 |
| IC 4710 | 2 | 0.13 | 37.04 |
| NGC 6822 | 1 | 0.08 | 34.51 |
| NGC 6946 | 92 4 | 6.75 0.29 | 38.39 0.02 |
| NGC 7331 | 48 4 | 3.28 0.28 | 38.99 0.04 |
| NGC 7552 | 385 28 | 28.70 2.05 | 40.23 0.03 |
| NGC 7793 | 2 | 0.11 | 36.13 |
| Wavelength/ | Spearman | Pearson | |||
|---|---|---|---|---|---|
| Band | Intercept | Coefficient | Coefficient | aaProbability that there is in fact no correlation between the two parameters | |
| 3.6 m | 0.365 | 28.75 | 0.67 | 0.65 | 0.1% |
| 4.5 m | 0.360 | 28.68 | 0.70 | 0.66 | 0.1% |
| 5.8 m | 0.295 | 31.28 | 0.61 | 0.59 | 0.1% |
| 8 m | 0.212 | 34.58 | 0.36 | 0.44 | 1% |
| 24 m | 0.243 | 32.94 | 0.28 | 0.38 | 10% |
| 70 m | 0.218 | 34.62 | 0.27 | 0.27 | 10% |
| 160 m | 0.249 | 33.52 | 0.27 | 0.27 | 10% |
| Band (global) | 0.372 | 29.25 | 0.64 | 0.63 | 0.1% |
| Band (global) | 0.386 | 28.6 | 0.66 | 0.64 | 0.1% |
| Band (global) | 0.388 | 28.35 | 0.66 | 0.65 | 0.1% |
| Band (nuclear) | 0.643 | 17.83 | 0.77 | 0.77 | 0.1% |
| Band (nuclear) | 0.632 | 18.59 | 0.76 | 0.76 | 0.1% |
| Band (nuclear) | 0.661 | 17.58 | 0.78 | 0.74 | 0.1% |