∎
22email: dd@space.mit.edu
Kinematics of Supernova Remnants: Status of X-Ray Observations
Abstract
A supernova (SN) explosion drives stellar debris into the circumstellar material (CSM) filling a region on a scale of parsecs with X-ray emitting plasma. The velocities involved in supernova remnants (SNRs), thousands of km s-1, can be directly measured with medium and high-resolution X-ray spectrometers and add an important dimension to our understanding of the last stages of the progenitor, the explosion mechanism, and the physics of strong shocks. After touching on the ingredients of SNR kinematics, I present a summary of the still-growing measurement results from SNR X-ray observations. Given the advances in 2D/3D hydrodynamics, data analysis techniques, and especially X-ray instrumentation, it is clear that our view of SNRs will continue to deepen in the decades ahead.
Keywords:
supernova remnants supernovae X-ray spectroscopy X-ray instrumentationpacs:
98.38.Mz 98.58.Mj 97.60.Bw 95.85.Nv 95.75.Fg 95.55.Ka1 Introduction
In an instant, the relative stability and compact extent ( cm) of a white dwarf or the core of a massive star are dramatically transformed, by a thermonuclear or core-collapse supernova (SN) explosion, respectively. A cosmic moment later (hundreds of years), the expanding SN debris, the “ejecta”, has interacted with the pre-explosion circumstellar medium (CSM) and fills a region over a scale of order parsecs (1 pc = 3.086 cm). The “outputs” of the SN explosion may include a neutron star (NS) or black hole (BH), as well as newly synthesized elements and their dispersal into the interstellar medium (ISM). The velocities involved in these supernova remnants (SNRs) are several thousands of km s-1, making them inherently dynamic objects. Hence, measuring the spatial-velocity properties of SNRs adds an important third dimension to our view of them. Because the bulk of the SNR material, closely connected to the global hydrodynamics, is generally heated well above a million degrees there is considerable emission in the X-ray band and X-ray data play a unique role in understanding the SNR.
Of course, there is a tremendous amount of information on SNRs and their kinetics provided by non-X-ray means. The kinetic energy of the SN explosion is turned into radiation across the electromagnetic (E/M) band: radio, sub-mm, IR, NIR, optical, UV, EUV, X-ray, -ray, and on up to over 1 TeV; for example, see the figures in Araya & Cui (2010). Emission mechanisms include synchrotron, thermal lines and bremsstralung, and high-energy non-thermal components (Reynolds, 2008b). Non-linear shock acceleration also leads to particle acceleration at SNRs and generation of cosmic rays (CRs, Vink et al., 2010). Multi-wavelength observations bring out the full complexity of SNRs. As an early example, the SNR Doppler velocities from optical measurements were much slower than the shock speeds needed to create the (then) newly observed thermal X-rays, this led to the suggestion of density variations of 5–10 times within the CSM (Bychkov & Pikel’ner, 1975). This was the beginning of an on going difference of kinematics seen in various wavelengths and among different components of an SNR. The instrumentation and techniques in non-X-ray bands are often ahead of current X-ray capabilities, for example, optical H measurements of Balmer-dominated shocks directly measure the post-shock proton thermal velocity.
Besides E/M radiation and emission of high-energy particles, the SNe process has been observed through neutrinos (SN 1987A, Hirata et al., 1987) and in future we expect their gravitational waves (GWs) to be detected, e.g., with Advanced LIGO (Ott, 2009; Yakunin et al., 2010). The study of SNe/SNRs also ties into other areas of astrophysics including: the late stages of massive stars and nucleosynthesis (Thielemann et al., 2010), the formation of black holes and neutron stars, pulsar wind nebulae (PWN, Slane, 2008), cosmology through the use of thermonuclear SNe (“Type Ia’s”) as standard candles, gamma-ray burst sources (GRBs) as a sub-class of Type Ibc SNe (Woosley & Bloom, 2006), and GRB remnants (Ramirez-Ruiz & MacFadyen, 2010).
The aims of this article are to touch on the key ingredients in SNR kinematics (§2), including the collisionless shock and basic SNR structure, and then to summarize the direct X-ray kinematic measurements that have been made to-date on SNe/SNRs (§3). I conclude with a brief look at future X-ray instrumentation capabilities in the context of SNRs (§4).
2 Ingredients of SNR Kinematics
2.1 The Collisionless Shock
A key ingredient in SNR dynamics is the strong (high Mach number) shock which is “collisionless” in that the effect of the shock is carried out through E/M fields generated collectively by the plasma rather than through discrete particle–particle collisions (Ghavamian, Laming & Rakowski, 2007). A further characterization of the shock system is given by the synonymous terms “adiabatic” and “non-radiative” to indicate that no significant energy leaves the system. In contrast, a “radiative” shock describes the case where significant, catastrophic cooling takes place through E/M emission (generally into the optical), and a “cosmic-ray (CR) modified” shock (Decourchelle, Ellison & Ballet, 2000; Vink et al., 2010) indicates that significant energy is leaving the system through highly accelerated particles.
The main results from the kinematic point of view are the expressions for the post-shock bulk velocity and temperature in terms of the shock velocity, the speed of the shock front as it moves upstream into the unshocked, stationary medium (e.g., the CSM). Assuming a usual equation of state, the shocked material picks up a velocity:
| (1) |
where is the shock compression ratio. The temperature of particles of mass in the shocked material just behind (or “downstream” of) the shock is given by:
| (2) |
implying a very low post-shock electron-to-proton temperature ratio, . However, there is strong evidence that additional electron heating occurs at collisionless shocks with ranging from 0.01 to 1.0 as decreases from 4000 to 400 km s-1 (Ghavamian, Laming & Rakowski, 2007).
In time, particle (“Coulomb”) collisions in the post-shock plasma will bring the temperature of all species, including the free electrons, to an equilibrium value:
| (3) |
where is the mean mass per particle in the plasma. Likewise, post-shock ions will be further ionized through electron collisions producing a non-equilibrium ionization (NEI) evolution in the plasma state (Hamilton et al., 1983; Borkowski et al., 2001a; Smith & Hughes, 2010). The NEI state may be approximately and conveniently expressed in terms of the temperature and the ionization age, , at locations within the plasma; these values can be used to calculate the expected X-ray emission (Borkowski et al., 2001a; Dwarkadas, Dewey & Bauer, 2010).
From a kinetic observable point of view, we are interested in the rms thermal motion along one dimension (e.g., the line-of-sight) which, immediately post-shock, is given by:
| (4) |
independent of . Once temperature equilibration has been established among the plasma species, different ions will then have different thermal velocity dispersions:
| (5) |
and the thermal broadening then depends on the mass of the ion emitting the line. Note that the factor is generally less than 0.25 for N and heavier elements in solar-abundance plasmas. The efficient production of cosmic rays at the shock may produce an even greater effect on the gas heating: “to the point where thermal X-ray emission is no longer expected” (Drury et al., 2009). The value of is then reduced from the unmodified value given in eq. (3) by a factor (Vink et al., 2010), which has been included in the equation above.
This thermal Doppler broadening can be compared with the broadening that the bulk velocity introduces. Assuming emission from a complete thin spherical shell, we get a lineshape that is uniform from to ; with a high-resolution spectrometer this shape may be resolved and the “blue-velocity at zero intensity” (BVZI) measures directly (Chugai & Danziger, 1994). At lower resolution it is useful to express this as an equivalent line broadening. Using the result that a uniform distribution from to has an rms (i.e. one sigma) value of , we get the effective bulk velocity broadening from the whole shell as equivalent to a Gaussian with:
| (6) |
(Note that under these assumptions, we can say that the FWHM is equal to the shock velocity to reasonable accuracy.) Compared with the thermal broadening, eq. (5), we see that the bulk broadening will generally dominate the global linewidth. Of course, if the analysis is spatially resolved then the bulk term can be reduced by using data near the SNR rim. Likewise, for data restricted to the center of the SNR the bulk contribution is enhanced, with . These effects seem to be seen in Tycho observations, §3.2 below.
2.2 SNR Structure
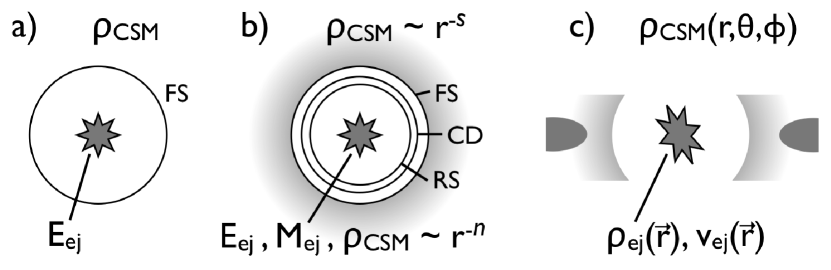
As a start, we can consider an SNR to be an idealized explosion which sends an expanding shock front into a medium, Figure 1a. Sedov (1959) gives the radius of an “intense explosion”, e.g, an atomic bomb explosion in New Mexico, as a function of time as:
| (7) |
Here the constant of proportionality is given for a strong, adiabatic shock into a medium that has typical cosmic elemental abundances. Setting to 1051 erg s-1, 1 amu cm-3 (1 amu 1.66 g), and 1000 yr, gives 8.5 pc or an angular diameter of 70 ” at the LMC (50 kpc). For further application of the Sedov solution to SNRs and their X-ray emission see Hamilton et al. (1983) and Borkowski et al. (2001a).
Implicit in the simple Sedov solution is the assumption that the mass of the shocked material is only due to (or is at least dominated by) the mass of the “swept up” ambient medium. In the case of SNRs, one can consider the Sedov solution as the late-time limit when the swept-up CSM mass exceeds the SN ejecta mass and the SNR evolution retains only vestiges of the initial ejecta mass and its distribution. Earlier in the ejecta-CSM interaction, the characteristics of the ejected material must be considered.
Self-similar solutions to describe this initial stage of SNR interaction were independently derived by Chevalier (1982) and Nadyozhin (1985). At this next level of fidelity, Figure 1b, the density of the material ejected in the SN explosion can be described as a decreasing power-law with radius. This ejecta behavior for core-collapse SN 111The power-law profile is useful for modeling Type Ia’s, however an exponential profile may be more realistic for these (Dwarkadas & Chevalier, 1998; Dwarkadas, 2000). has been corroborated by analytic (Chevalier & Soker, 1989) and numerical calculations; realistic values of the power-law index are expected between about 9 and 11 (Matzner & McKee, 1999). Because the expansion is homologous, , the density can also be expressed as a power-law with velocity: . Since a power-law cannot be continued all the way to the origin, as it would result in infinite mass and energy, the density below a certain velocity is simply assumed to be constant 222Another possibility is to transition to a more shallow power-law at small radii (Chevalier & Fransson, 1994); the constant-density case here is then a subset of this with the inner index, , set to 0.. With this assumption, the requirement of finite mass and energy then gives the constraint . The parameters of the ejecta profile are directly related to the ejecta mass and explosion energy, see eq. (2.1) of Chevalier & Liang (1989).
The interaction of this power-law ejecta density profile with an ambient medium whose density is also a power-law with radius, , leads to the formation of the standard double-shocked structure, Figure 1b. The outer, forward shock (FS) advances into the ambient medium, which could be a constant-density interstellar medium () as expected for Type Ia SNe, or a steady wind from the progenitor star () in the case of a core-collapse SN. We assume that so that the shock velocity is the same as the observed FS motion: . A reverse shock (RS) is formed that moves back into the ejecta in a Lagrangian sense. At the RS, the upstream (unshocked) ejecta has been freely expanding and the observed velocity of the location of the RS, , is not the shock velocity, , of §2.1; instead we have: .
A contact discontinuity (CD) separates the shocked ejecta from the shocked surrounding medium. The entire shocked structure expands outwards, with the ratios of the radii of the FS and RS to the radius of the CD remaining constant. The self-similar solution for the radius of the contact discontinuity has been shown to increase as (Chevalier, 1982; Chevalier & Fransson, 1994). Note that for and , the exponent will always be larger than in the generalized Sedov case, .
This analytic framework has assumed an adiabatic evolution, i.e., with no additional energy sinks beyond the expansion. However, it is able to accomodate additional energy terms, as examples: i) Nymark, Fransson & Kozma (2006) consider the case of a radiative RS, where the radiative cooling is relevant and a cool dense shell forms at the CD, and ii) Decourchelle, Ellison & Ballet (2000) show the effect on the kinematics of including cosmic-ray generation, which changes the relative locations of the RS, CD, and FS.
The self-similar solution eventually breaks down, for example when the RS reaches the plateau of the ejecta distribution. The solution then deviates from the self-similar one and the expansion parameter changes, decreasing towards the limiting Sedov value. In practice this happens only when the FS has swept-up a mass equal to several times the mass of the ejected material (Dwarkadas & Chevalier, 1998).
2.3 Rayleigh-Taylor & Kelvin-Helmholtz Instabilities
The idealized 1D symmetric picture of the previous section suffers from several further complications: the decelerating contact discontinuity is always Rayleigh-Taylor (R-T) unstable. The contact discontinuity is decelerated by the continual sweeping up of the ambient medium by the FS. The deceleration of the shocked ejecta by the shocked ambient medium leads to conditions favoring the rise of the R-T instability at the contact discontinuity. R-T fingers of ejecta can be seen penetrating the shocked ambient medium in numerical simulations (Chevalier, Blondin & Emmering, 1992; Dwarkadas, 2000). The tips of these fingers usually show bulbous structures due to shear flow around the heads, leading to the onset and growth of Kelvin-Helmholtz instabilities. This can lead to mixing of heavy-metal ejecta into the shocked ambient material, thus increasing its metallicity and temperature, which will be reflected in the X-ray emission.
Studies have shown that in a self-similar case, the R-T fingers also grow self-similarly. Under adiabatic conditions, whether the expansion is self-similar or not, the length of the fingers generally does not exceed more than half the length of the shocked ambient medium. However, while the growth rate of the instability does not depend on the shock compression, , the width of the shocked region does. In remnants undergoing efficient particle acceleration the width of the shock region can decrease to almost half of the case with no particle acceleration (Decourchelle, Ellison & Ballet, 2000), and therefore the R-T fingers can reach almost all the way to the FS (Blondin & Ellison, 2001), further complicating the dynamics and kinematics.
2.4 Shock-Cloud Interactions
One other generic ingredient in the SNR interaction is the presence of density enhancements, particularly within the CSM. Early on, the role of these dense “clouds” in the CSM was posited to help explain the observation of both optical emission due to low temperatures (slow, radiative shocks) as well as X-ray emission due to higher velocities and temperatures (McKee & Cowie, 1975; Bychkov & Pikel’ner, 1975; Stone & Norman, 1992; Chugai & Danziger, 1994). In particular this was invoked for the case of the young oxygen-rich SNRs which showed bright [O III] optical emission along with strong X-ray emission (Sutherland & Dopita, 1995b).
One helpful aspect of the shock-cloud interactions is that the fraction of material needed to be in clouds is often small and need not greatly disturb the overall hydrodynamics. It is therefore possible to focus on just the shock-cloud interation as a sub-problem of its own (Sgro, 1975; Klein, McKee & Colella, 1994). Using to represent the density ratio of the unshocked cloud to the ambient density, the “cloud crushing” time scale is given by the time for the transmitted shock to travel a cloud radius :
| (8) |
where is the shock speed in the ambient (non-cloud) medium. Of particular interest here is the kinematics of the cloud throughout the interaction and the resulting state(s) of the cloud material after the interaction, ending in some combination of evaporated and condensed (radiative) components. Thermal conduction can affect the process and enhance the likelyhood of some or all of the cloud evaporating (Orlando et al., 2005). Studies of the effect of both the geometry and the abruptness of the cloud boundaries are being made, e.g., Miceli et al. (2006) look at the case of an elliptical cloud. Looking towards supporting more detailed observations, a diagnostic that can be applied to the imaged X-ray emisssion from the remains of a shocked cloud is presented in Orlando et al. (2010).
What about real shocked clouds? Klein et al. (2003) show images of a laboratory shock-cloud interaction which does resemble the hydro simulations; these results are invoked to explain a feature seen in a Chandra Puppis A observation (Hwang et al., 2005) at much larger scales. Another example is the modeling of part of the Cygnus Loop with a combination of a smoothly-varying enhanced-density region which contains discrete higher-density internal clumps (Patnaude & Fesen, 2005).
3 Observations
There is a large variety seen in the X-ray images of SNRs, certainly more than is predicted by simple 1D self-similar models. This variety is so great that even the fundamental difference between core-collapse and Type Ia SNe is often blurred at the SNR stage; though we are making progress in assessing this key characteristic from X-ray SNR data directly (Lopez et al., 2009).
Following some general comments on X-ray kinematic measurement, the sections below summarize the direct kinematic measurements that have been made to-date on supernova remnants, both Type Ia, Table 1, and core collapse, Table 2. Because of this measurement criteria, only a fraction of the 60 Galactic and 30 Magellanic cloud SNRs observed by Chandra 333See the Chandra SNR Catalog at http://hea-www.cfa.harvard.edu/ChandraSNR/. are mentioned here. Please consult the cited works and their references for context, previous work, and interpretation of the results.
3.1 Implicit and Direct X-ray Kinematics
The emission of X-rays from SNRs is in itself an indication of the underlying kinematics. In the case of thermal emission the spectral fitting parameters, and , are closely related to the hydrodynamics and one can effectively constrain the kinematics under model assumptions even without explicitly measuring the velocity of the X-ray plasma. As a simple example Gonzalez & Safi-Harb (2003) apply a Sedov model to G292’s X-ray emission. In a more complex analysis, Laming & Hwang (2003) present measurements of fitted and values for a coherent set of knots in Cas A and match the - pattern with model predictions to constrain kinematics. There are many SNR X-ray studies of this “implicit kinematics” type and a list of them, never mind their review, is well beyond this author.
The kinematics of SNRs can be directly measured in the X-ray through Doppler velocity effects in their spectra, via and/or , and through proper motions seen in imaging observations taken at multiple epochs, generally giving . These measurements provide complementary information to the parameters of spectral fits.
Doppler Measurements
Doppler, or “radial”, velocity measurements have been common in the optical for well over a century. In the X-ray band the first measurement of SNR velocities was made spectroscopically using the Einstein Focal-Plane Crystal Spectrometer (FPCS) observing Cas A (Markert et al., 1983). Currently the high spectral resolution of the gratings on XMM-Newton and Chandra as well as the improved stability of CCD instruments, e.g., on Suzaku, are providing Doppler measurements on many more SNRs. The Doppler measurement requires a narrow spectral feature (a line or edge) and hence is most applicable to sources with thermal emission lines. Measuring Doppler velocities and line profiles to an accuracy of 100 km s-1 or less requires some of the highest spectral resolving powers, , shown on Paerels’ plot (Paerels, this vol.).
Caveat: Imposter Velocities via Ionization State
Although Doppler measurements can be very “clean”, it is possible to get erroneous results when the lines being measured are not fully resolved. For example, in Fe-K measurements of Cas A (DeLaney et al., 2010) and N103B (van der Heyden, 2002), it is likely that the Fe-K line complex centroid varies not only with velocity but with temperature and ionization age as well.
Proper Motion Measurements
Because proper motion measurements require both spatial resolution and a long time baseline, these measurements came later and the first ones included data from Einstein and ROSAT (Hughes, 1999; Hughes et al., 2000b). In recent years, Chandra’s sub-arcsecond resolution coupled to its 10-year lifetime is providing X-ray proper motion measurements of many SNRs.
A useful way of putting a proper motion measurement into a dynamic context is with the expansion parameter: the power-law index in the expression , where is the time since the SN explosion. This has the useful interpretation of converting fractional changes in the SNR age to fractional changes in the SNR radius: . For example, for free expansion we have and for an interacting, decelerating dynamics: . Another way to view it, especially for non-monotonic density profiles, is as the ratio of the current velocity to the historical average velocity: .
Caveat: Feature evolution
One complexity with proper motion is that unlike the case of ballistic optical knots, say, X-ray features are likely to be evolving as well as moving in time and this needs to be considered in proper motion measurements. The measured proper motion is the “motion” of the brightness distribution between two epochs - if the feature has evolved in time then the velocity measured may not be the actual transverse motion of the structure or material. This may be more important for measuring shocked ejecta or CSM clumps, say, as opposed to the narrow non-thermal FS structures.
3.2 “Type Ia” X-Ray Observations
Type Ia SNRs that have direct X-ray kinematic measurements are listed in Table 1 and discussed briefly in turn in the following paragraphs. Note that Type Ia SNe per se have not been detected in X-rays with an early-time ( 10 d) upper limit of erg s-1 (Hughes et al., 2007).
G1.9+0.3
This is the youngest known Galactic SNR, and it is still growing in both X-ray size as well as in flux. The diameter increased by 16 % 3% in 22 years between radio (1985) and X-ray (2007) measurements, as confirmed by recent radio and X-ray re-observations (Reynolds et al., 2008a; Borkowski et al., 2010). Using an SNR diameter expansion from 84 to 97.5 arc seconds gives the FS velocity shown in Table 1; detailed X-ray proper motion analyses between the 2007 and 2009 X-ray epochs are ongoing. Fitting the spectrum of the “north rim”, Borkowski et al. (2010) used a flat-top (thin shell) model giving km s-1, which is expressed as the equivalent Gaussian value in the table.
| SNR Name | (km s-1) | (km s-1) | Dia.(”) | Dist. (kpc) | Age (yr) |
|---|---|---|---|---|---|
| G1.9+0.3 | 8100 2900 (N rim) | 12 400 | 98 | 8.5 | 100 |
| Kepler | — | 2200; 3900 | 210 (N-S) | 4 1 | 406 |
| N103B | 350 ( keV) | — | 30 | 50 (LMC) | 1000 – 2000 |
| SN 1006 | 1775 250 (NW knot) | 5000 (NE) | 1800 | 2.2 | 1004 |
| SNR 0509-67.5 | 4900 420 (Fe-L, O) | 6700 | 32 | 50 (LMC) | 400 |
| SNR 0519-69.0 | 1873 50 | — | 33 | 50 (LMC) | 600 200 |
| Tycho | 2600 (Fe-K) | 2200–4400 | 500 | 2.3 0.8 | 438 |
| SN 2002bo | Upper limit: 1.8e37 erg s-1, 0.5-2 keV | 0 | 22 Mpc | at 9.3 d | |
Kepler (SN 1604, G4.5+6.8)
Hughes (1999) used Einstein and ROSAT data to measure an average expansion rate of the Kepler X-ray images of 0.239 % , giving an expansion parameter value of with an error of order 0.10. Note that the result will be weighted toward the brighter regions, additionally, this global image-fitting measurement is sensitive to the “feature evolution” caveat mentioned above.
Chandra observations of Kepler were made in 2000, 2004, and 2006 and allow a variety of X-ray proper motion measurements. In the case of narrow FS features, Katsuda et al. (2008b) measured the motion of the outer rim using small rectangular regions at selected azimuths; the values vary between 0.08 to 0.25 % , with smaller values to the north. The shock fronts are roughly circular with radii of 93 (N) and 120 (S) arcseconds and expansion parameters of order 0.5 (N) and 0.7 (S). These values give the FS velocities shown in the table using the given distance.
Vink (2008) used the Chandra data to make whole-remnant expansion measurements in distinct energy ranges and six azimuthal sectors. The N-S difference in expansion parameter is also seen, giving values of 0.35 (N) and 0.6 (S). Vink (2008) also measures the expansion rate for a narrow filament in the east, getting a value of 0.176 0.007 % ; this is in good agreement with the coresponding measurements of Katsuda et al. (2008b) which give 0.17 0.015 (Reg-4, Reg-5). Hence the difference in expansion parameters is likely due to the difference in the component that is being measured: the FS versus the ejecta.
N103B
Given its small size and presumed large age (Lewis et al., 2003), proper motion measurements in the X-ray will require time baselines of many decades to be significant. Observed with both XMM-Newton and Chandra gratings, N103B has so far produced only upper limits to a Doppler velocity blur: the RGS spectrum did not reqire any additional broadening beyond the spatial contribution (van der Heyden, 2002), suggesting a limit of order 350 km s-1 for the lines below 1 keV.
SN 1006 (G327.6+14.6)
XMM-Newton observed the bright metal-rich knot on the northwest rim of SN 1006, and the RGS data show a dramatic thermal Doppler broadening of the O VII triplet with FWHM 4200 km s-1 (Vink, et al., 2003). Ninety degrees away, the largely non-thermal NE limb shows a measured proper motion of the FS of 0.48 ” (Katsuda et al., 2009).
SNR 0509-67.5
SNR 0519-69.0
Vink (2006a) shows a global velocity broadening of km s-1 in the O VIII Ly- line. Recent analysis by Kosenko, Helder & Vink (2010) gives a Doppler broadening of 1873 50 km s-1 in the RGS spectrum. They also infer an age of 450 years from the X-ray derived CSM density and shock radii, in reasonable agreement with an age of 600 years based on light echoes.
Tycho (SN 1572, G120.1+1.4)
Chandra data have provided beautiful images and detailed spatial-spectral measurements of Tycho (Warren et al., 2005), a much studied Type Ia SNR. ASCA data showed the emission lines to be broad, possibly as large as 7500 km s-1 FWHM (Hwang, Hughes & Petre, 1998). Line broadening is seen in Si, S, and Fe-K lines using the excellent resolution of the Suzaku XIS CCDs. As expected for a bulk-plus-thermal combination, the spatially resolved FWHM shows both a decrease with radius and an excess above instrumental at the rim (Furuzawa et al., 2009). The center data suggest that the Fe-K-emitting shell is expanding with an average 3000 km s-1; the width at the rim corrected for possible ionization-state effects gives 1900 500 km s-1. These values have been appropriately combined to get the expected full-SNR given in the table. The intermediate mass elements (Si, S, Ar) show expansion velocities 20% greater than Fe (Hayato et al., 2010); this is in rough agreement with a homologous dynamics and the expected/observed layering of the Type Ia structure, with Fe toward the interior and Si, S, and Ar at larger radii. X-ray proper motion measurements were made using Einstein and ROSAT data (Hughes, 2000c) and most recently with Chandra data over a 7 year baseline (Katsuda et al., 2010a). The values vary with azimuth, in the range 0.2–0.4 arcseconds yr-1.
3.3 Core-Collapse X-Ray Observations
In constrast to the Type Ia SNRs, core-collapse SNRs seem to show greater asymmetry: in their X-ray line emission (Lopez et al., 2009), in the presence of fast moving outer optical knots of ejecta, and at their earliest stages as SNe (Wang & Wheeler, 2008). Most of the CC SNRs listed in Table 2 are members of the “oxygen-rich” class, e.g., showing high velocity [O III] lines in the optical (Sutherland & Dopita, 1995b). This emission traces the ejecta dynamics and is therefore relevant to the global X-ray dynamics as well.
Cassiopeia A (G111.7-2.1)
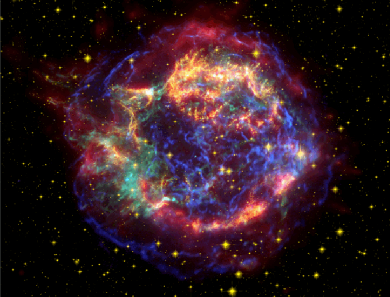
Cas A has been extensively studied because it is nearby (3.4 kpc) and young ( 330 yr), has complex structure, and is bright across the E/M spectrum. The brightest emission at all wavebands in Cas A is concentrated onto the 200 ” diameter Bright Ring, Figure 2 (left), where ejecta from the explosion are radiating after crossing through and being compressed and heated by the RS (Morse et al., 2004; Patnaude & Fesen, 2007). In a few locations, the position of the RS itself has been identified just inside of the Bright Ring from the rapid turn-on of optical ejecta (Morse et al., 2004).
The FS of Cas A is well defined in Chandra images by a thin ring of tangential X-ray filaments at a radius of 153 ” (319 yr, Gotthelf et al., 2001; DeLaney & Rudnick, 2003; Hwang et al., 2004). There are also many of these nonthermal filaments projected across the center of Cas A (blue in Figure 2, left). The nature and location of these filaments is not yet clear – they may simply be projected FS filaments (DeLaney et al., 2004; Patnaude & Fesen, 2009), or more intriguingly, they have been modeled as occuring at the RS as well (Helder & Vink, 2008).
While most of the observed ejecta are concentrated on the Bright Ring, optical ejecta are also identified at and beyond the FS (Kamper & van den Bergh, 1976; Thorstensen, Fesen & van den Bergh, 2001; Fesen, 2001, 2006a). Located mostly between 120 ” to 300 ” from the center of expansion (Hammell & Fesen, 2008), the distribution is aspherical showing jets of Si-rich and S-rich ejecta extending out to the largest distances in the northeast and southwest. The optical knots are rapidly expanding, 0.3 % (an expansion parameter ), with proper motions of 1000s of km s-1 on the Bright Ring and up to 14,000 km s-1 for the optical ejecta at the tip of the jets (Fesen et al, 2006b). These measurements of the optical ejecta give an explosion date of A.D. 168119.
Spectral variations in the X-ray-emitting ejecta have been mapped by many past and present X-ray missions (Ohashi, this vol.). The first mappings with the Einstein X-ray Observatory (Markert et al., 1983) and ASCA (Holt et al., 1994) showed large-scale asymmetries in Doppler structure and lead to a simple inclined-ring model of the kinematics and 3D structure. These asymmetries were confirmed with XMM-Newton (Willingale et al., 2002) and with the Chandra X-ray Observatory (Hwang et al., 2001). Willingale et al. (2002) found that the Si-rich ejecta forms the same general set of ring structures as the optical emission. Analyses using Chandra High Energy Transmission Grating (HETG) data measure the velocities of individual Si-rich knots, with sizes of a few arcseconds, showing velocities in the range of 3000 to 4000 km s-1 (Lazendic et al., 2006). These knot measurements confirmed that the X-ray Doppler expansion rate agrees with the X-ray proper motion rate, 0.2 % on average (Koralesky et al., 1998; Vink, et al., 1998; DeLaney et al., 2004). Perhaps somewhat surprisingly, the expansion rate of the FS is about the same as the X-ray ejecta (DeLaney & Rudnick, 2003; Patnaude & Fesen, 2009).
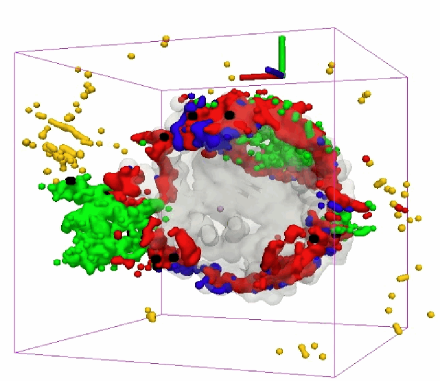
The most recent work by DeLaney et al. (2010) combines Chandra (ACIS Fe-K data and HETG Si data) with Spitzer long-slit spectral imaging (in forbidden lines of Ne, Ar, and Si). These components are seen in 3D in Figure 2 and include a garnish of outer optical knots as well. Spitzer has also been used to map the center IR emission at high spectral resolution (Isensee et al., 2010). The gray material in Figure 2 identifies Si ejecta that have not yet reached the RS and thus are unshocked. When seen in 3D, the gray material is located on two sheets – one front and one back – and the entire ejecta distribution is flattened, however the RS is roughly spherical. The Bright Ring of Cas A is simply the intersection point between the flattened ejecta and the spherical RS. The Fe-rich emission is concentrated in three main areas to the north, southeast, and west. Hughes et al. (2000a) suggest an overturning in the explosion in the southeast, with the Fe emission extending out to the FS. However, there are no unshocked Si ejecta immediately interior to the Fe-rich regions; this may indicate that no overturning of the ejecta has occured. Instead, the whole ejecta column along that radius may have been displaced outward with the layer ordering preserved (DeLaney et al., 2010).
The small-scale structures in Cas A evolve on time scales of a few years to a few decades with ejecta knots and nonthermal filaments appearing, increasing in brightness, and then fading from view (Patnaude & Fesen, 2009; van den Bergh & Kamper, 1985). Additionally, the X-ray ejecta are observed in Cas A with a range of ionization states and densities (Lazendic et al., 2006), these values have implications for the further plasma evolution of the features and we may be able to directly measure the plasma-state changes in future observations.
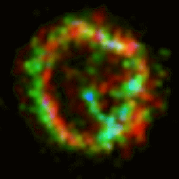
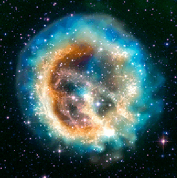
E0102 (1E 0102.2-7219)
Chandra imaging of E0102 (Figure 3, right-most) clearly shows the outer blast wave and bright inner rings of H- and He-like O and Ne emission (Gaetz et al., 2000). A proper motion measurement in the X-ray was made using ROSAT, Einstein, and Chandra data (Hughes et al., 2000b), giving 0.10 % 0.025% yr-1 and the FS velocity in Table 2. The shock temperature from eq. (3) is keV, and, as mentioned in §2.1, we expect to be below this value. Hughes et al. (2000b) estimate 2.5 keV as a lower limit based on Coulomb collisions and the fitted ionization age; this is greater than the keV seen in the blastwave region and suggests that some energy must be going into cosmic rays at the shock (Decourchelle, Ellison & Ballet, 2000). Recent E0102 optical proper motion measurements (Finkelstein et al., 2006) suggest an age of order 2000 years.
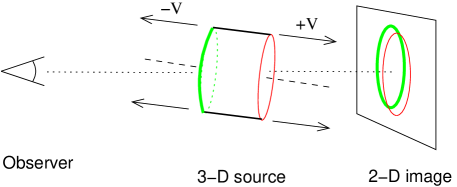
Clear effects of line-of-sight velocities on the order of 1000 km s-1 are seen in grating observations of E0102 (Canizares et al., 2001; Rasmussen et al., 2001; Flanagan et al., 2004). Spatial-spectral fitting of the Ne X line images suggests a cylinder geometry for the X-ray emission, Figure 3. Optical Fabry-Perot and long-slit observations of the bright [O III] 5007 Å line have shown similarly-high velocities and suggest a more complex 3D geometry, e.g., see the references and results presented in Vogt & Dopita (2010). E0102’s spatial-velocity structure is certainly non-spherical, likely axisymmetric, and worthy of further study.
| SNR Name | X-ray Result(s) (km s-1) | (km s-1) | Dia. (”) | Dist. (kpc) | Age (yr) |
| Cas A | : 3000 to 4000 | 5100 | 306 | 3.4 | 329 |
| E0102 | 1000 | 6200 1500 | 44 | 60 (SMC) | 2000 |
| G292.0+1.8 | 1500; 730 | — | 530 | 6 | 3000 |
| N132D | 1000; 600 | — | 93 115 | 50 (LMC) | 3200 |
| Puppis A | 1700, 3400 | — | 3300 | 2.2 | 4000 |
| RCW 86 | 2200 | 5900 2000 | 2400 | 2.5 | 1825 |
| SNR 0540-69.3 | 2400 | — | 65 | 50 (LMC) | 760 – 1660 |
| SNR 4449-1 | — | — | 0.05 | 3800 | 50 – 100 |
| SN 1987A | (Neutrinos!) | ( Radio : ) | 50 (LMC) | 0 | |
| 1991.6 | — | (38 000) | (1.3) | 4.5 | |
| 2003.9 | 2300 | 7500 (4700) | 1.48 | 17 | |
| 2010 | 350150 [‘07] | 1600 600 | 1.56 | 23 | |
| SN 1996cr | 4000 | — | 0.01 | 3700 (CG) | 14 |
G292.0+1.8 (MSH 11-54)
This intriguing SNR includes a pulsar wind nebula and is likely the remains of a 30–40 solar-mass star (Park et al., 2002; Gonzalez & Safi-Harb, 2003; Park et al., 2007). The radial variation seen in the temperature and emission measure near the FS prefer models that explode into an density profile, e.g., into the previous RSG-phase wind medium (Lee et al., 2010).
Although G292 is a very large SNR it does have a bright equatorial belt which has allowed some XMM-Newton RGS spectroscopy: line broadening is seen for the Ne X line with 1500 km s-1, however, only an upper limit (of 730 km s-1) was placed on broadening in the O lines (Vink et al., 2004). The working hypothesis is that the O is largely from shocked moderate-density CSM in the belt, while the Ne is from moving ejecta. Optical velocity measurements in [O III] show fast moving knots within a shell with km s-1 and confirm the low velocity of the bar material (Ghavamian, Hughes & Williams, 2005). Proper motion measurements of outer optical filaments provide a good age estimate and show a bi-polar/conical structure (Plunkett, 2009; Winkler et al., 2009) which is similar to a 3D model proposed for 3C 58 (G130.7+3.1) (Fesen et al., 2008).
N132D
Another beautifully and deeply imaged SNR (Borkowski et al., 2007), N132D has a roughly circular boundary ( 45 arcseconds) with a “blow out” in the NE quadrant. Early X-ray observations of N132D suggested the explosion took place in a low-density cavity of a Wolf-Rayet progenitor (Hughes, 1987). Based on optical spectroscopy of the high-velocity optical emission (Lasker, 1980), km s-1, Sutherland & Dopita (1995a) proposed a complex 3-D axisymmetric “structural model” of the SNR. Further groundbased and HST observations added more “trees” to the N132D forest, including photoionized precursor emission (Morse et al., 1995, 1996), but no clear 3D model has emerged to directly explain the data.
In terms of X-ray spectroscopy, Einstein FPCS data corrected for spatial-spectral effects (Hwang et al., 1993) suggested a global O VIII width in the range of 1000–2000 km s-1 FWHM; this is in reasonable agreement with the velocities seen in the optical. The RGS spectrum of N132D (Behar et al., 2001) resolved many lines, especially of Fe, as well as the O VII triplet. Given the large size, the HETG suffers from spatial-spectral confusion (Dewey, 2002), especially given the many Fe lines; although HETG gives a relatively clean monochromatic image in the O VIII line (Canizares et al., 2001). Focussing on individual knots with the HETG, none of those measured show Doppler velocities above 1000 km s-1 (DeLaney et al., 2007), somewhat surprising given the high optical velocities. Most recently the COS on HST observed an O-rich region (2.5” diameter) of N132D in the far-UV lines of O III, O IV, and O V, showing velocity components at 200 and 800 km s-1 (France et al., 2009). There is certainly much more to measure and model in N132D.
Puppis A (G260.4-3.4)
Given its large diameter, 1 degree, it’s hard to get a full view of Puppis A: the X-ray reference image for Puppis A is still a ROSAT HRI mosaic that was presented in the paper that confirmed it harbored an unresolved central stellar remnant, RX J0822–4300 (Petre et al., 1996). This image is usefully combined with radio data as presented in Castelletti et al. (2006). Puppis A shows a roughly rectangular shape with sharp edges along the NE and NW. The bright eastern knot (BEK) is a prominent feature, likely the interaction of the SNR shock with an interstellar cloud, and was the target of a Chandra observation (Hwang et al., 2005). A recent mosaic of XMM-Newton and Chandra observations covers almost all of the SNR giving a three-color image (Katsuda et al., 2010b), and a Suzaku mosaic dataset was used to construct line images and parameter maps covering most of the remnant (Hwang et al., 2008).
The observation of fast moving oxygen filaments in the optical puts Puppis A in the O-rich category (Winkler & Kirshner, 1985). Given its large size, its bright O, Ne, and Fe XVII lines are still best resolved by the Einstein FPCS using almost 300 ks of data (Winkler et al., 1981), although the implications of the measured fluxes have evolved over the decades. Observations with XMM-Newton show Doppler shifts for fast moving X-ray knots, -1700 and -3400 km s-1, at locations near the [O III] “omega” filament (Katsuda et al., 2008a). One expects that continued X-ray and optical measurements of this SNR will bring out its full 3D structure.
RCW 86 (SN 185, G315.4-2.3, MSH 14-63)
This large SNR is well imaged in an XMM-Newton mosaic (Vink, et al., 2006b) and shows both thermal and non-thermal emission: detailed studies have been carried out in the bright southwest “knee” region (Borkowski et al., 2001b; Ueno et al., 2007) and along the E-NE-N rims (Vink, et al., 2006b). A concise summary of RCW 86 and its observations is given in Aharonian et al. (2009) where its imaging in very high energy ( GeV) -rays is presented.
In the southwest, analysis of Suzaku data shows emission in the Fe-K range from low-ionization Fe-rich plasma at 6.4 and 7.1 keV; the 6.4 keV line is clearly broadened with 47 eV although the mechanism is not clear and may involve explosion within a cavity (Ueno et al., 2007). In the northeast, a Chandra X-ray proper motion measurement over 3 years gives a value of 0.5 0.17 ” yr-1 indicating a high shock velociy inspite of the lower post-shock temperatures measured: the conclusion is that 50 % of the post-shock pressure here is due to cosmic rays (Helder et al., 2009; Vink et al., 2010).
SNR 0540-69.3
As in the case of the Crab, the pulsar PSR B0540-69.3 (Serafimovich et al., 2004) and the pulsar wind nebula (PWN) of SNR 0540-69.3 are the eye-catchers in X-ray images, e.g., see the deep Chadra observation of Park et al. (2010). A ring of [O III] emission with radius 3 arcseconds had been seen from ground-based observations and is clear in HST images (Morse et al., 2006). Linewidths in the optical give shell expansion velocities of order 1500 km s-1 (Kirshner et al., 1989; Morse et al., 2006). An observation using the XMM-Newton RGS showed emission lines, including O VIII, from the western side of the SNR, with an assigned Doppler shift of 2370 km s-1 (van der Heyden et al., 2001). No Chandra gratings observations have been made of ‘0540 to target these thermal emissions because of the long exposures required.
SNR 4449-1 (NGC 4449 SNR)
Although no direct X-ray kinematic measurements have been made of this SNR in NGC 4449 it is included here because of its O-rich character, showing velocities 3500 km s-1. A Chandra X-ray spectrum of SNR 4449-1 shows lines of O, Ne, Mg and Si roughly similar to those of G292 (Patnaude & Fesen, 2003). Ground-based and HST optical images and spectra presented by Milisavljevic & Fesen (2008) suggest that the SNe is interacting with dense CSM from the progenitor, or perhaps with wind-loss from nearby stars. Their line profiles show discrete “minor peaks” around 1600 km s-1; this may suggest “a possible ring or jet distribution”. Combining the maximum optical expansion velocity of 6500 km s-1 with a VLBI-measured radius gives an age of 50 – 100 years (Bietenholz et al., 2010); additionally the asymmetric VLBI image suggests a barrel shape seen in projection, reminiscent of the E0102 cartoon, Figure 3.
3.4 CC SNe observations - The early years
A large fraction of core-collapse SNe show X-ray emission within the first 1000 days, with an that decreases in time (Schlegel, 1995; Immler & Lewin, 2003). This behavior can be modeled as the interaction of the ejecta with a CSM due to the progenitor’s late-phase wind, , often producing a radiative RS and associated cooling region (Fransson et al., 1996; Nymark, Fransson & Kozma, 2006). A well studied example is SN 1993J (in M81, 4 Mpc) which so far has data covering 10 days to 15 years since the explosion (Chandra et al., 2009).
A very illuminating look at the transition from SNe to SNRs is seen in Figure 2 of Immler & Kuntz (2005). This shows SNe observed at ages less than 30 years having ’s generally in the range to erg s-1 and decreasing with time. SNRs with ages 300 to 3000 years are seen to have values in the to erg s-1 range. The figure makes clear the gap in our observations of core-collapse SNe/SNR at ages of 30 to 300 years, which we can expect to fill in with observations, e.g., SNR 4449-1, and patience.
Two SNe outliers in this picture are SN 1987A and SN 1996cr which each show an increasing X-ray flux at 5 years post-explosion. In these cases it appears that the CSM consists of a low density region and then farther out in radius there is dense, structured CSM from the progenitor. In this section we take a look at SN 1987A and its “wild cousin”, SN 1996cr, summarizing their kinematics as seen in high resolution X-ray spectra.
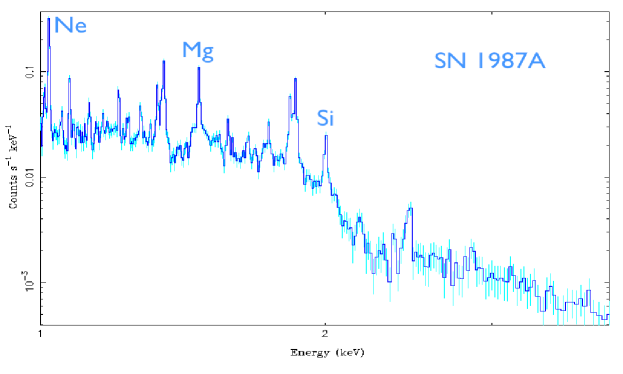
SN 1987A
For an introduction, see the article by McCray (2007) in the conference proceedings from SN 1987A’s 20th birthday. The UV flash of the SN caused the CSM around ‘87A to glow, showing its triple-ring structure. Initial expansion of the FS took place in low density CSM at high velocity (Gaensler et al., 2007) until 1992. At this point the FS encountered denser CSM slowing the shock and giving increased radio and X-ray emission; this phase is dominated by interaction of the FS with an extended H II region with 100 cm-3 (Chevalier & Dwarkadas, 1995). The X-ray emission was dominated by a very broad component seen with the Chandra HETG (Michael et al., 2002). Spectra taken with the XMM-Newton RGS in May 2003 are near the end of this H II phase (Sturm et al., 2010).
In 2004 the FS reached protrusions around the equatorial ring having 104 cm-3 : the soft X-ray emission increased more quickly as the X-ray diameter growth slowed. A full X-ray light curve exists with initial X-ray observations by ROSAT and continuing into the current era with a gap of just under 2 years (Haberl et al., 2006).
Doppler motion of the shocked ring material was measured through clever observations with the Chandra LETG (Zhekov et al., 2005) which indicated lower-than-expected bulk velocities, confirmed with higher-resolution HETG observations (Dewey et al., 2008). The X-ray image of ‘87A has been observed at 6 month intervals with Chandra (Burrows et al., 2000; Park et al., 2006) and recent image analyses give expansion velocities based on model fits to the images (Racusin et al., 2009), see Table 2. Observations of ‘87A continue to be carried out in all wavebands as we work to understand and predict the evolution of this wonderful system.
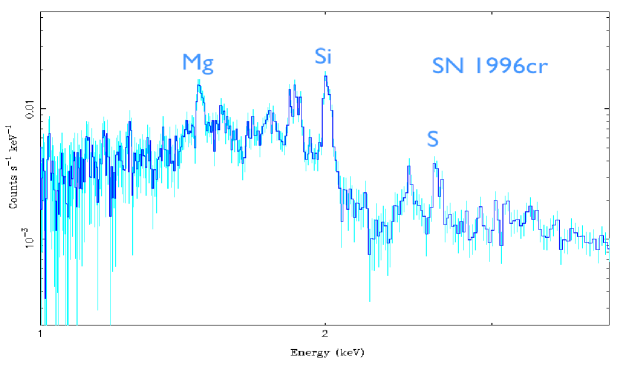
SN 1996cr
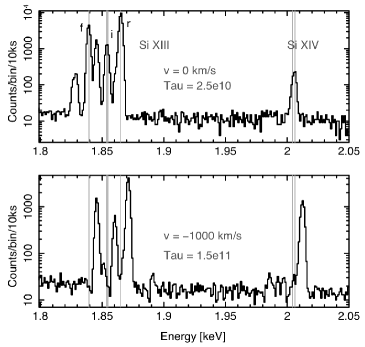
Initially identified as a ULX in the Circinus Galaxy, archival data showed SN 1996cr was non-detected in X-rays at 1000 days yet brightened to erg s-1 (0.5-8 keV) after 10 years (Bauer et al., 2008). A 1-D hydro model of the ejecta-CSM interation was created and produces good agreement with the measured X-ray light curves and spectra across multiple epochs (Dwarkadas, Dewey & Bauer, 2010). SN 1996cr was most likely a massive star, solar masses, which went from an RSG to a brief W-R phase before exploding within its pc wind-blown shell. Doppler line broadening is clearly seen in the HETG data, Figure 4, bottom panel, with widths that are in good agreement with velocities in the hydro-model. Further analysis of the HETG observations should allow detailed line-shape fitting of a handful of bright Si and Fe lines to help constrain the emission geometry.
4 Future X-Ray Obsevatories and SNRs
A major advance in SNR observations will be made as spectral imaging with high resolution non-dispersive detectors becomes available, Figure 5; for further details see Ohashi (this vol.). This new capability will be welcome in the X-ray domain and will allow studies of Galactic and Magallanic cloud SNRs with 3D detail exceeding our current astounding view of Cas A (DeLaney et al., 2010).
There is also a continued need for X-ray grating spectrometers in the low-energy range, 0.3 to 1.0 keV, see Paerels (this vol.). The CAT gratings (Heilmann et al., 2009) represent a promising technology improvement with the weight and alignment advantages of a transmission grating like the HETG (Canizares et al., 2005) along with the higher efficiency of a reflection grating, e.g. the XMM-Newton RGS. Such a grating instrument complements the microcalorimeters by measuring velocities and thermal Doppler broadening for low-Z and Fe-L ions. Although optimized for a point source (SNe, GRBs), the spatial extent of a somewhat extended source can be included in the spectral analysis as has been demonstrated with XMM-Newton and Chandra grating data (Rasmussen et al., 2001; Dewey, 2002; Vink, et al., 2003).
Future kinematic measurements in all wavebands, including GWs and neutrinos, will be combined with multi-dimensional simulations, modeling, and analyses (e.g., Dewey & Noble, 2009; Steffen et al., 2010) to provide a rich picture of SNe/SNRs in the decades ahead.
Acknowledgements.
I deeply appreciate receiving suggestions and input from Vikram V. Dwarkadas, especially regarding §2. I thank Tracey DeLaney for input, helpful discussions, and an advance copy of DeLaney et al. (2010). Thanks to colleagues Vikram Dwarkadas and Franz Bauer for ongoing stimulating discussions. Support for this work was provided by NASA/USA through the Smithsonian Astrophysical Observatory (SAO) contract SV3-73016 to MIT for Support of the Chandra X-Ray Center, which is operated by SAO for and on behalf of NASA under contract NAS8-03060.References
- Aharonian et al. (2009) Aharonian, F., et al. Astrophys. J. 692, 1500 (2009).
- Araya & Cui (2010) Araya, M. & Cui, W. Astrophys. J. 720, 20 (2010).
- Bauer et al. (2008) Bauer, F.E., et al. Astrophys. J. 688, 1210 (2008).
- Behar et al. (2001) Behar, E., et al. A&A 365, L242 (2001).
- Bietenholz et al. (2010) Bietenholz, M.F., et al. Mon. Not. R. Astron. Soc. accepted (arXiv:1007.3953) (2010).
- Blondin & Ellison (2001) Blondin, J.M. & Ellison, D.C. Astrophys. J. 560, 244 (2001).
- Borkowski et al. (2001a) Borkowski, K.J., Lyerly, W.J. & Reynolds, S.P. Astrophys. J. 548, 820 (2001a).
- Borkowski et al. (2001b) Borkowski, K.J., et al. Astrophys. J. 550, 334 (2001b).
- Borkowski et al. (2007) Borkowski, K.J., Hendrick, S.P. & Reynolds, S.P. Astrophys. J. Let. 671, L45 (2007).
- Borkowski et al. (2010) Borkowski, K.J., et al. Astrophys. J. Let., submitted (arXiv:1006.3552) (2010).
- Burrows et al. (2000) Burrows, D.N., et al. Astrophys. J. Let. 543, L149 (2000).
- Bychkov & Pikel’ner (1975) Bychkov, K.V. & Pikel’ner, S.B. Sov. Astron. Lett. 1(1), 14 (1975).
- Canizares et al. (2001) Canizares, C.R., et al. AIP Conf. Proc. 565, 213 (arXiv:astro-ph/0105060) (2001)
- Canizares et al. (2005) Canizares, C.R., et al. Publ. Astron. Soc. of the Pacific 117, 1144 (2005)
- Castelletti et al. (2006) Castelletti, G., et al. A&A 459 535, (2006)
- Chandra et al. (2009) Chandra, P., et al. Astrophys. J. 699 388, (2009)
- Chevalier (1982) Chevalier, R. A. Astrophys. J. 258 790, (1982)
- Chevalier & Liang (1989) Chevalier, R.A. & Liang, E.P. Astrophys. J. 344 332, (1989)
- Chevalier & Soker (1989) Chevalier, R.A. & Soker, N. Astrophys. J. 341 867, (1989)
- Chevalier, Blondin & Emmering (1992) Chevalier, R.A., Blondin, J.M. & Emmering, R.T. Astrophys. J. 392 118, (1992)
- Chevalier & Fransson (1994) Chevalier, R.A. & Fransson, C. Astrophys. J. 420 268, (1994)
- Chevalier & Dwarkadas (1995) Chevalier, R.A. & Dwarkadas, V.V. Astrophys. J. Let. 452 L45, (1995)
- Chugai & Danziger (1994) Chugai, N.N. & Danziger, I.J. Mon. Not. R. Astron. Soc. 268 173, (1994)
- Davis et al. (2010) Davis, J.E., et al. Bull. Am. Astron. Soc. 41, 721 (2010).
- Decourchelle, Ellison & Ballet (2000) Decourchelle, A., Ellison, D.C. & Ballet, J. Astrophys. J. 543, L57 (2000).
- DeLaney & Rudnick (2003) DeLaney, T. & Rudnick, L. Astrophys. J. 589, 818 (2003).
- DeLaney et al. (2004) DeLaney, T., Rudnick, L., Fesen, R. A., Jones, T. W., Petre, R. & Morse, J. A. Astrophys. J. 613, 343 (2004).
- DeLaney et al. (2007) DeLaney, T., et al., at 8 Years of Science with Chandra444http://cxc.harvard.edu/symposium_2007/proceedings/posters//065_DeLaney.pdf (2007).
- DeLaney et al. (2010) DeLaney, T., et al. Astrophys. J. accepted (arXiv:1011.3858) (2010).
- Dewey (2002) Dewey, D. in High Resolution X-Ray Spectroscopy with XMM-Newton and Chandra, G. Branduardi-Raymont (ed.), Electronic contribution 14 (2002).
- Dewey et al. (2008) Dewey, D., et al. Astrophys. J. Let. 676, L131 (2008).
- Dewey & Noble (2009) Dewey, D. & Noble, M.S. ADASS XVIII, ASP Conf. Series 411, 234 (2009).
- Drury et al. (2009) Drury, L.O’C., et al. A&A 496, 1 (2009).
- Dwarkadas & Chevalier (1998) Dwarkadas, V.V. & Chevalier, R.A. Astrophys. J. 497, 807 (1998).
- Dwarkadas (2000) Dwarkadas, V.V. Astrophys. J. 541, 418 (2000).
- Dwarkadas, Dewey & Bauer (2010) Dwarkadas, V.V., Dewey, D. & Bauer, F. Mon. Not. R. Astron. Soc. 407, 812 (2010).
- Fesen (2001) Fesen, R.A. Astrophys. J. Sup. Ser. 133, 161 (2001).
- Fesen (2006a) Fesen, R.A., et al. Astrophys. J. 636, 859 (2006a).
- Fesen et al (2006b) Fesen, R.A., et al. Astrophys. J. 645, 283 (2006b).
- Fesen et al. (2008) Fesen, R., et al. Astrophys. J. Sup. Ser. 174, 379 (2008).
- Finkelstein et al. (2006) Finkelstein, S.L., et al. Astrophys. J. 641, 919 (2006).
- Flanagan et al. (2004) Flanagan, K.A., et al. Astrophys. J. 605, 230 (2004).
- France et al. (2009) France, K., et al. Astrophys. J. Let. 707, L27 (2009).
- Fransson et al. (1996) Fransson, C., Lundqvist, P. & Chevalier, R.A. Astrophys. J. 461, 993 (1996).
- Furuzawa et al. (2009) Furuzawa, A., et al. Astrophys. J. Let. 693, L61 (2009).
- Gaensler et al. (2007) Gaensler, B.M., et al. in Supernova 1987A: 20 Years After: Supernovae and Gamma-Ray Bursters AIP Conf. Proc. 937, 86 (2007).
- Gaetz et al. (2000) Gaetz, T.J., et al. Astrophys. J. Let. 534, L47 (2000).
- Ghavamian, Hughes & Williams (2005) Ghavamian, P., Hughes, J.P. & Williams, T.B. Astrophys. J. 635, 365 (2005).
- Ghavamian, Laming & Rakowski (2007) Ghavamian, P., Laming, J.M. & Rakowski, C.E. Astrophys. J. 654, L69 (2007).
- Gonzalez & Safi-Harb (2003) Gonzalez, M. & Safi-Harb, S. Astrophys. J. Let. 583, L91 (2003).
- Gotthelf et al. (2001) Gotthelf, E.V., Koralesky, B., Rudnick, L., Jones, T.W., Hwang, U. & Petre, R. 2001, Astrophys. J., 552, L39
- Haberl et al. (2006) Haberl, F., Geppert, U., Aschenbach, B. & Hasinger, G. A&A 460, 811 (2006).
- Hamilton et al. (1983) Hamilton, A.J.S., Sarazin, C.L. & Chevalier, R.A. Astrophys. J. Sup. Ser. 51, 115 (1983).
- Hammell & Fesen (2008) Hammell, M.C. & Fesen, R.A. Astrophys. J. Sup. Ser. 179, 195 (2008).
- Hayato et al. (2010) Hayato, A., et al. Astrophys. J. accepted (arXiv:1009.6031) (2010).
- Heilmann et al. (2009) Heilmann, R.K., et al. Proc. of SPIE 7437, 74370G-1 (2009).
- Helder & Vink (2008) Helder, E.A. & Vink, J. Astrophys. J. 686, 1094 (2008).
- Helder et al. (2009) Helder, E.A., et al. Science 325, 719 (2009).
- Helder et al. (2010) Helder, E.A., Kosenko, D. & Vink, J. Astrophys. J. Let. 719, L140 (2010).
- Hirata et al. (1987) Hirata, K., et al. Phys. Rev. Let. 58, L140 (1490).
- Holt et al. (1994) Holt, S.S., et al. Publ. Astron. Soc. Japan 46, L151 (1994).
- Hughes (1987) Hughes, J.P. Astrophys. J. 314, 103 (1987).
- Hughes (1999) Hughes, J.P. Astrophys. J. 527, 298 (1999).
- Hughes et al. (2000a) Hughes, J.P., et al. Astrophys. J. Let. 528, L109 (2000a).
- Hughes et al. (2000b) Hughes, J.P., Rakowski, C.E. & Decourchelle, A. Astrophys. J. Let. 543, L61 (2000b).
- Hughes (2000c) Hughes, J.P. Astrophys. J. Let. 545, L53 (2000c).
- Hughes et al. (2007) Hughes, J.P., et al. Astrophys. J. 670, 1260 (2007).
- Hwang et al. (1993) Hwang, U., et al. Astrophys. J. 414, 219 (1993).
- Hwang, Hughes & Petre (1998) Hwang, U., Hughes, J.P. & Petre, R. Astrophys. J. 497, 833 (1998).
- Hwang et al. (2001) Hwang, U., et al. Astrophys. J. Let. 560, L175 (2001).
- Hwang et al. (2004) Hwang, U., et al. Astrophys. J. 615, L117 (2004).
- Hwang et al. (2005) Hwang, U., Flanagan, K.A. & Petre, R. Astrophys. J. 635, 355 (2005).
- Hwang et al. (2008) Hwang, U., Petre, R. & Flanagan, K.A. Astrophys. J. 676, 378 (2008).
- Immler & Lewin (2003) Immler, S. & Lewin, W.H.G. in “Supernovae and Gamma-Ray Bursts”, edited by K. W. Weiler (Springer-Verlag) Lecture Notes in Physics 598, 91 (arXiv:astro-ph/0202231) (2003).
- Immler & Kuntz (2005) Immler, S. & Kuntz, K.D. Astrophys. J. Let. 632, L99 (2005).
- Isensee et al. (2010) Isensee, K., et al. Astrophys. J., accepted (arXiv:1006.0918) (2010).
- Kamper & van den Bergh (1976) Kamper, K. & van den Bergh, S. Astrophys. J. Sup. Ser. 32, 351 (1976).
- Katsuda et al. (2008a) Katsuda, S., et al. Astrophys. J. 678, 297 (2008a).
- Katsuda et al. (2008b) Katsuda, S., et al. Astrophys. J. 689, 225 (2008b).
- Katsuda et al. (2009) Katsuda, S., et al. Astrophys. J. Let. 692, L105 (2009).
- Katsuda et al. (2010a) Katsuda, S., et al. Astrophys. J. 709, 1387 (2010a).
- Katsuda et al. (2010b) Katsuda, S., et al. Astrophys. J. 714, 1725 (2010b).
- Kirshner et al. (1989) Kirshner, R.P., et al. Astrophys. J. 342, 260 (1989).
- Klein, McKee & Colella (1994) Klein, R.I., McKee, C.F. & Colella, P. Astrophys. J. 420, 213 (1994).
- Klein et al. (2003) Klein, R.I., et al. Astrophys. J. 583, 245 (2003).
- Koralesky et al. (1998) Koralesky, B., Rudnick, L., Gotthelf, E.V., and Keohane, J.W. Astrophys. J. Let. 505, L27 (1998).
- Kosenko et al. (2008) Kosenko, D., et al. A&A 490, 223 (2008).
- Kosenko, Helder & Vink (2010) Kosenko, D., Helder, E.A. & Vink, J. A&A 519, A11 (2010).
- Laming & Hwang (2003) Laming, J.M. & Hwang, U. Astrophys. J. 597, 347 (2003).
- Lasker (1980) Lasker, B.M. Astrophys. J. 237, 765 (1980).
- Lazendic et al. (2006) Lazendic, J.S., Dewey, D., Schultz, N.S. & Canizares, C. R. Astrophys. J. 651, 250 (2006).
- Lee et al. (2010) Lee, J.-J., et al. Astrophys. J. 711, 861 (2010).
- Lewis et al. (2003) Lewis, K.T., et al. Astrophys. J. 582, 770 (2003).
- Lopez et al. (2009) Lopez, L.A., et al. Astrophys. J. 706, 106 (2009).
- Markert et al. (1983) Markert, T.H., et al. Astrophys. J. 268, 134 (1983).
- Matzner & McKee (1999) Matzner, C.D. & McKee, C.F. Astrophys. J. 510, 379 (1999).
- McCray (2007) McCray, R. in Supernova 1987A: 20 Years After: Supernovae and Gamma-Ray Bursters AIP Conf. Proc. 937, 3 (2007).
- McKee & Cowie (1975) McKee, C.F. & Cowie, L.L. Astrophys. J. 195, 715 (1975).
- Miceli et al. (2006) Miceli, M., et al. A&A 458, 213 (2006).
- Michael et al. (2002) Michael, E., et al. Astrophys. J. 574, 166 (2002).
- Milisavljevic & Fesen (2008) Milisavljevic, D. & Fesen, R.A. Astrophys. J. 677, 306 (2008).
- Morse et al. (1995) Morse, J.A., Winkler, P.F. & Kirshner, R.P. Astron. J. 109 (5), 2104 (1995).
- Morse et al. (1996) Morse, J.A., et al. Astron. J. 112 (2), 509 (1996).
- Morse et al. (2004) Morse, J. A., et al. Astrophys. J. 614 727 (2004).
- Morse et al. (2006) Morse, J.A., et al. Astrophys. J. 644, 188 (2006).
- Nadyozhin (1985) Nadyozhin, D.K. Astrophysics & Space Science 112, 225, (1985).
- Nymark, Fransson & Kozma (2006) Nymark, T.K., Fransson, C. & Kozma, C. A&A 449, 171 (2006).
- Ohashi (this vol.) Ohashi, T. Space Sci. Rev. this same conference/volume, TBD (2010).
- Orlando et al. (2005) Orlando, S., et al. A&A 444, 505 (2005).
- Orlando et al. (2010) Orlando, S., et al. A&A 514, 29 (2010).
- Ott (2009) Ott, C.D. Class. Quantum Grav. 26, 063001 (2009).
- Paerels (this vol.) Paerels, F. Space Sci. Rev. this same conference/volume, TBD (2010).
- Park et al. (2002) Park, S., et al. Astrophys. J. Let. 564, L39 (2002).
- Park et al. (2006) Park, S., et al. Astrophys. J. 646, 1001 (2006).
- Park et al. (2007) Park, S., et al. Astrophys. J. Let. 670, L121 (2007).
- Park et al. (2010) Park, S., et al. Astrophys. J. 710, 948 (2010).
- Patnaude & Fesen (2003) Patnaude, D.J. & Fesen, R.A. Astrophys. J. 587, 221 (2003).
- Patnaude & Fesen (2005) Patnaude, D.J. & Fesen, R.A. Astrophys. J. 633, 240 (2005).
- Patnaude & Fesen (2007) Patnaude, D.J. & Fesen, R.A. Astron. J. 133, 147 (2007).
- Patnaude & Fesen (2009) Patnaude, D.J. & Fesen, R.A. Astrophys. J. 697, 535 (2009).
- Petre et al. (1996) Petre, R., Becker, C.M. & Winkler, P.F. Astrophys. J. 465, L43 (1996).
- Plunkett (2009) Plunkett, A.L., Winkler, P.F. & Long, K.S. A talk at SNR & PWN in the Chandra Era555http://cxc.harvard.edu/cdo/snr09/pres/Plunkett_Adele.pdf (2009).
- Racusin et al. (2009) Racusin, J.L., et al. Astrophys. J. 703, 1752 (2009).
- Ramirez-Ruiz & MacFadyen (2010) Ramirez-Ruiz, E. & MacFadyen, I.A. Astrophys. J. 716, 1028 (2010).
- Rasmussen et al. (2001) Rasmussen, A.P., et al. A&A 365, L231 (2001).
- Reynolds et al. (2008a) Reynolds, S.P., et al. Astrophys. J. Let. 680, L41 (2008a).
- Reynolds (2008b) Reynolds, S.P. Annu. Rev. Astro. Astrophys. 46, 89 (2008b).
- Schlegel (1995) Schlegel, E.M. Rep. Prog. Phys. 58, 1375 (1995).
- Sedov (1959) Sedov, L.I. Similarity and Dimensional Methods in Mechanics, New York: Academic Press (1959).
- Serafimovich et al. (2004) Serafimovich, N.I., et al. A&A 425, 1041 (2004).
- Sgro (1975) Sgro, A.G. Astrophys. J. 197, 621 (1975).
- Smith & Hughes (2010) Smith, R.K. & Hughes, J.P. Astrophys. J. 718, 583 (2010).
- Slane (2008) Slane, P. AIP Conf. Proc. 1085, 120 (arXiv:0811.1954) (2008).
- Steffen et al. (2010) Steffen, W., et al. IEEE Trans. on Vis. and Comp. Graphics, accepted (arXiv:1003.2012) (2010).
- Stone & Norman (1992) Stone, J.M. & Norman, M.L. Astrophys. J. Let. 390, L17 (1992).
- Sturm et al. (2010) Sturm, R., et al. A&A 515, A5 (2010).
- Sutherland & Dopita (1995a) Sutherland, R.S. & Dopita, M.A. Astrophys. J. 439, 365 (1995a).
- Sutherland & Dopita (1995b) Sutherland, R.S. & Dopita, M.A. Astrophys. J. 439, 381 (1995b).
- Thielemann et al. (2010) Thielemann, F.-K., et al., a chapter in ”Astronomy with Radioactivities”, Lect. Notes in Phys., Vol. 812, Springer (arXiv:1008.2144) (2010).
- Thorstensen, Fesen & van den Bergh (2001) Thorstensen, J.R., Fesen, R.A. & van den Bergh, S. Astrophys. J. 122, 297 (2001).
- Ueno et al. (2007) Ueno, M., et al. Publ. Astron. Soc. Japan 59, (SP1) 171 (2007).
- van den Bergh & Kamper (1985) van den Bergh, S. & Kamper, K. Astrophys. J. 293, 537 (1985).
- van der Heyden et al. (2001) van der Heyden, K.J., et al. A&A 365, L254 (2001).
- van der Heyden (2002) van der Heyden, K.J., et al. A&A 392, 955 (2002).
- Vink, et al. (1998) Vink, J., Bloemen, H., Kaastra, J.S. & Bleeker, J.A.M. A&A 339, 201 (1998).
- Vink, et al. (2003) Vink, J., et al. Astrophys. J. Let. 587, L31 (2003).
- Vink et al. (2004) Vink, J., et al. Nuclear Phys. B (Proc. Suppl.) 132, 62 (2004). High-res SNRs: 0509, 0519, SN 1006, Cas A, RCW 86
- Vink (2006a) Vink, J. in Proc. X-Ray Universe 2005, ESA SP 604, 319 (2006a).
- Vink, et al. (2006b) Vink, J., et al. Astrophys. J. Let. 648, L33 (2006b).
- Vink (2008) Vink, J. Astrophys. J. 689, 231 (2008).
- Vink et al. (2010) Vink, J., et al. Astrophys. J., accepted (arXiv:1008.4367) (2010).
- Vogt & Dopita (2010) Vogt, F. & Dopita, M.A. Astrophys. J. 721, 597 (2010).
- Wang & Wheeler (2008) Wang, L. & Wheeler, J.C. Annu. Rev. Astro. Astrophys. 46, 433 (2008).
- Warren et al. (2005) Warren, J.S., et al. Astrophys. J. 634, 376 (2005).
- Willingale et al. (2002) Willingale, R., et al. A&A 381, 1039 (2002).
- Winkler et al. (1981) Winkler, P.F., et al. Astrophys. J. Let. 246, L27 (1981).
- Winkler & Kirshner (1985) Winkler, P.F. & Kirshner, R.P. Astrophys. J. 299, 981 (1985).
- Winkler et al. (2009) Winkler, P.F., et al. Astrophys. J. 692, 1489 (2009).
- Woosley & Bloom (2006) Woosley, S.E. & Bloom, J.S. Annu. Rev. Astro. Astrophys. 44, 507 (2006).
- Yakunin et al. (2010) Yakunin, K.N., et al. (arXiv:1005.0779) (2010).
- Zhekov et al. (2005) Zhekov, S.A., et al. Astrophys. J. Let. 628, L127 (2005).