The black holes of radio galaxies during the “Quasar Era”: Masses, accretion rates, and evolutionary stage ††thanks: Based on observations collected at the Very Large Telescope of ESO. Program IDs 070.A-0545, 070.A-0229, 076.A-0684, 079.A-0617, 081.A-0468,381.A-0541, 082.A-0825, 083.A-0445, 085.A-0897
We present an analysis of the AGN broad-line regions of 6 powerful radio galaxies at z2 (HzRGs), which is part of a study of a sample of 50 HzRGs with rest-frame optical imaging spectroscopy obtained at the VLT. In 6 galaxies we detect luminous ((H)few erg s-1), spatially unresolved, broad (FWHM 10,000 km s-1) H line emission from the nucleus (HBLRs), consistent with broad-line regions of supermassive black holes with masses of few and accretion luminosities of a few percent of the Eddington luminosity. In two galaxies we also detect HBLRs, suggesting relatively low extinction of A1 mag, which agrees with constraints from X-ray observations. Overall, we find HBLRs in 20% of the galaxies where H is observed. By relating black hole and bulge mass, we find a possible offset towards higher black-hole masses of at most dex relative to nearby galaxies at a given host mass, although each individual galaxy is within the scatter of the local relationship. If not entirely from systematic effects, this would then suggest that the masses of the host galaxies have increased by at most a factor since z relative to the black-hole masses, perhaps through accretion of satellite galaxies or because of a time lag between star formation in the host galaxy and AGN fueling. We also compare the radiative and mechanical energy output (from jets) of our targets with predictions of recent models of “synthesis” or “grand unified” AGN feedback, which postulate that AGN with similar radiative and mechanical energy output rates to those found in our HzRGs may be nearing the end of their period of active growth. We discuss evidence that they may reach this stage at the same time as their host galaxies.
Key Words.:
galaxies: high-redshift, galaxies: radio galaxies, galaxies: evolution, galaxies: active, galaxies: nuclei1 Introduction
One of the most remarkable discoveries in extragalactic astronomy in the past decade is the close relationship between the masses of supermassive black holes and several properties of their bulges, such as stellar mass (Magorrian et al., 1998; Häring & Rix, 2004), stellar velocity dispersion (“M- relation” Gebhardt et al., 2000; Ferrarese, 2002; Tremaine et al., 2002; Ferrarese, 2002), and the concentration parameter (Graham et al., 2001). Theoretical arguments suggest that the most fundamental of these may be a relationship that with the binding energy of the bulge (Hopkins et al., 2007; Younger et al., 2008) or perhaps with the dark-matter halo (Booth & Schaye, 2010).
A popular way to interpret these relationships is by postulating that supermassive black holes may regulate their own growth, as well as that of their host galaxies, by coupling a small fraction of their energy output to the surrounding gas. This heats and unbinds significant fractions of the gas, by inhibiting star formation (“AGN feedback”, e.g. Silk & Rees, 1998; Springel et al., 2005; Bower et al., 2006; Croton et al., 2006; Cattaneo et al., 2007; Ciotti & Ostriker, 2007; Sijacki et al., 2007; Merloni & Heinz, 2008; Ciotti et al., 2009; Fanidakis et al., 2009). The scaling relations of black hole mass with the bulge parameters are a major observational constraint to gauging the “efficiency” of this process, the fraction of the energy output of the AGN that is being injected into the interstellar medium of the host galaxy (typically a few0.1%, e.g. Di Matteo et al., 2005; Merloni & Heinz, 2008; Shankar et al., 2009; Körding et al., 2008).
A large number of observational studies have been dedicated to finding direct observational constraints for the (co-)evolution of black holes and their host galaxies across cosmic time (e.g., Shields et al., 2003; Walter et al., 2004; McLure et al., 2006; Peng et al., 2006; Shields et al., 2006; Woo et al., 2006; Treu et al., 2007; Alexander et al., 2008; Coppin et al., 2008; Shen et al., 2008; Wang et al., 2010). Amongst those, studies of AGN at redshifts z2 are particularly interesting, since these redshifts correspond to the epoch when powerful AGN were most abundant (Pei, 1995) and when massive galaxies evolved most quickly (e.g., Caputi et al., 2006). However, since we know little about the underlying physics of how AGN interact with their environments and whether feedback occurs in AGN and host galaxies of all types at these redshifts, it is difficult to link black-hole properties and feedback directly. This is particularly true in light of recent galaxy evolution models, which postulate that supermassive black holes may interact with their environments at different stages of their evolution in different ways, where thermal feedback may dominate at some epochs, and mechanical feedback may at others (Churazov et al., 2005; Croton et al., 2006; Sijacki et al., 2007; Merloni & Heinz, 2008; Fanidakis et al., 2009; Ciotti et al., 2009).
Using integral-field spectroscopy of the ionized emission-line gas in high-redshift radio galaxies at z2 we recently identified energetic, kpc-scale outflows of ionized gas corresponding to significant fractions of their interstellar medium (a few M⊙; Nesvadba et al., 2006, 2007, 2008b). These ionized gas masses are comparable to the cold molecular gas masses in these galaxies (e.g., Papadopoulos et al., 2000; De Breuck et al., 2003, 2005; Nesvadba et al., 2009), suggesting that a significant fraction of the interstellar medium participates in the outflows. Outflow velocities are of order of the escape velocity of massive galaxies. These may be the observational signatures of energetic AGN-driven winds, making the black holes of HzRGs particularly interesting targets.
Unfortunately, nuclear broad-line regions (BLRs) in HzRGs are very rarely observed, because the central regions are obscured in these type II AGN. This has significantly hampered observational efforts to characterize their black-hole properties. Most notably, at redshifts z2, BLRs have only been anecdotally reported for 4 HzRGs (Röttgering et al., 1997; Larkin et al., 2000; Nesvadba et al., 2006; Humphrey et al., 2007), and their black-hole properties have not yet been fully discussed. McLure et al. (2006) studied the redshift evolution of the black-hole bulge mass relationship for powerful radio-loud AGN out to z2 (with 6 radio galaxies at 1.5z2.0 and one quasar at z=2.0), but relied on the BLRs of quasars for the black-hole properties and on radio galaxies for the host properties, assuming that the only difference between radio-loud quasars and radio galaxies in a given redshift range was in their orientation. This has not yet been proven for high-redshift AGN, where evolutionary effects may be at least as important (e.g. Hopkins et al., 2006).
Here we discuss the properties of supermassive black holes in 6 powerful radio galaxies at z2-2.5 (HzRGs), in which we detect broad H line emission with FWHM10,000 km s-1 originating in a compact region near the nucleus. The similarity to broad-line quasars suggests this is nuclear broad-line emission from the AGN. The emission lines are luminous, but less so than in powerful, optically selected quasars, making it possible to study AGN and host properties for the same objects. We discuss black-hole masses and accretion rates, and use the stellar mass estimates of Seymour et al. (2007) to place these galaxies on the black-hole bulge mass relationship. We also compare radiative and mechanical energy output rates with predictions from recent AGN feedback models (Churazov et al., 2005; Sijacki et al., 2007; Merloni & Heinz, 2008; Fanidakis et al., 2009), which suggest that black holes with similar properties as those in our targets may be in a critical transition phase from radiatively efficient to radiatively inefficient accretion.
Throughout the paper we adopt a flat H0= 70 km s-1 Mpc-1 concordance cosmology with and 0.7.
2 Observations and sample selection
All data were taken with the near-infrared integral-field spectrograph SINFONI (Tecza et al., 2000; Bonnet et al., 2004) at the Very Large Telescope of ESO in the H and K bands. SINFONI is an image slicer giving a field of view of 8″8″ with a pixel scale of 250 mas in the seeing-limited mode. These observations are part of an ongoing survey of HzRGs at z2. Our sample currently consists of 50 powerful radio galaxies at z2, which were selected according to radio power and radio size. All targets have steep-spectrum radio sources. They include a significant fraction of the known radio galaxies with confirmed redshifts at z2 observable from the VLT and at suitable redshifts for near-infrared observations. All are type-2 AGN, classified by narrow rest-frame UV emission lines and a high HeII/CIV line ratio. The results of the full survey will be discussed in a series of upcoming papers. Here we focus on the nuclear properties of the 6 galaxies that have broad H line emission with properties consistent with originating in AGN broad-line regions. We defer a full analysis of the spatially-extended line emission to a subsequent paper, but emphasize that the present galaxies are consistent with having outflows very similar to those described by Nesvadba et al. (2006, 2007, 2008b).
Most data were obtained with the HK grating giving a spectral resolving power R1500 and a spectral coverage between 1.45m and 2.4m. Total on-source exposure times were between 45 min and 6 hrs per source. MRC1138-262 was observed in the H and the K band individually, with R and 4000, respectively, and with on-source exposure times of 75 and 140 min, respectively (The data of MRC1138-262 have previously been described by Nesvadba et al., 2006, but without a dedicated analysis of its nuclear properties.) We reduced all data sets with our custom data reduction software, which is optimized to study high-redshift galaxies. For details of the data reduction procedure, see, e.g., Nesvadba et al. (2006, 2008a). Data were calibrated using nearby bright stars observed at similar air masses to the targets at the beginning or end of each observation. We used the same stars to monitor the size of the seeing disk with SINFONI and the same setup as for the data. Typically, the seeing was between 0.5″ and 1.5″, corresponding to a spatial resolution of 412 kpc at a redshift z2.5.
Three of our sources have already been known to have broad nuclear H line emission, but their black-hole properties have not yet been discussed in the literature. Larkin et al. (2000) discovered a broad nuclear H line in MRC2025-218 at z2.6. Nesvadba et al. (2006) identified a broad H emission line in MRC1138-262 at z=2.2. Humphrey et al. (2007) report on the discovery of broad nuclear H emission in MRC1558003 at z=2.5. For MRC1558003 and MRC2025218 our measurements are consistent with the previous results. For TXS1113-178, Röttgering et al. (1997) find a broad CIV component consistent with the FWHM of our H line measurement. Eales & Rawlings (1996) report the detection of a “broad” H line in MRC0156-252; however, their spectrum has low signal-to-noise and they give an FWHM estimate of about 4000 km s-1. This is consistent with the integrated extended, spatially-resolved line emission in our data, and significantly narrower than the FWHM12500 km s-1 we find for the broad line. In the following we use our new measurements, adopting the results published in Nesvadba et al. (2006) for MRC1138-252. A few broad lines were previously detected in radio galaxies at lower redshifts, z (Economou et al., 1995; Willott et al., 2000).
3 Results
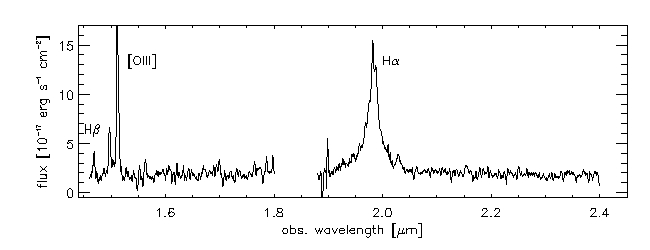
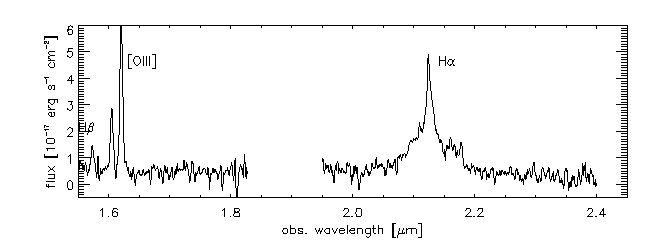
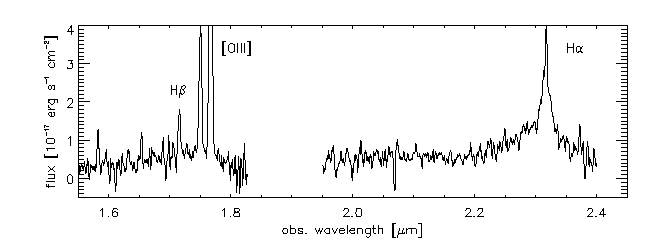
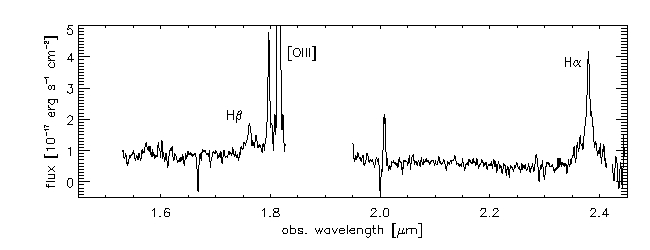
Figure 1 shows the integrated spectra of our targets centered on the position of the brightest continuum emission. Spectra were extracted from 2″2″ box apertures (corresponding to about twice the FWHM of the seeing disk). Broad emission-line components are apparent in all six galaxies, and are superimposed by luminous, narrow components of H and [NII]6548,6583. MRC1017-220 is at a redshift where the red wing of the broad line falls into a spectral region with very low atmospheric transmission between the H and the K band, so that we only detected the blue wing of the broad line and the line center, but missed most of the red wing.
Owing to the relatively broad widths of the narrow lines of typically FWHM800 km s-1, [NII] and the narrow H component are blended in all galaxies. The kinematics of these lines is consistent with those in the extended emission-line regions, suggesting they are part of the same outflows as seen in projection along the same line of sight as the AGN. We will discuss the extended line emission in a forthcoming paper.
3.1 Broad H line emission
To derive emission-line properties, we removed the continuum emission and fitted all broad and narrow line components with a set of weighted Gaussian profiles. To distinguish between broad and narrow components, we attributed zero weights to wavelengths where the narrow components (or night-sky lines) dominate111For MRC1017-220 we only fitted the blue wing, so that we are not able to account for line asymmetries. By analogy with the other targets, and given the large astrophysical uncertainties, we do not think that this has a major impact on the results.. We subtracted the broad components, and fitted the residuals with lines whose redshifts and line widths were tied to the values observed in [OIII]5007. Nesvadba et al. (2008b) find that, in the extended emission-line regions of HzRGs, all bright, narrow emission lines typically have very uniform kinematic properties, at least to the precision of the observations, and we find the same in the present analysis.
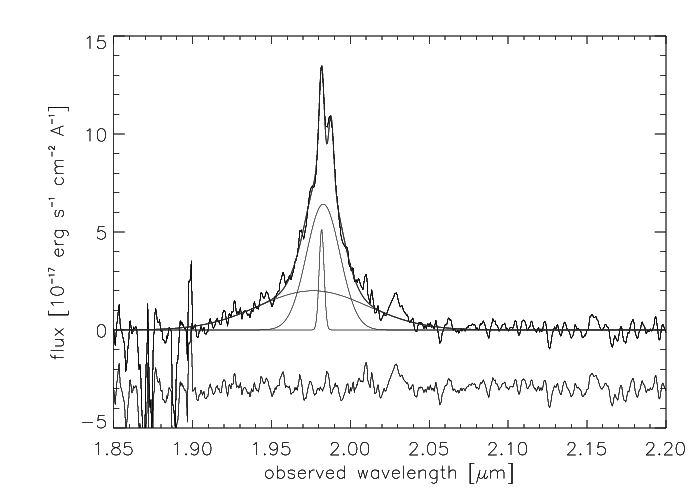
Broad H lines typically have fluxes erg s-1 cm-2 and FWHMs10000-14000 km s-1. Values for individual targets are given in Table 1. We did not correct for Galactic foreground extinction, which is negligible at the observed near-infrared wavelengths. One broad and one narrow component were sufficient for all galaxies except MRC0156-252, for which we needed an additional H component of intermediate width, FWHM=7480 km s-1 and an integrated line flux of erg s-1 cm-2 (Figure 2).
All data sets are deep enough that we would have detected H lines with similar luminosity and width, which suggests that HzRGs with HBLRs may have different AGN properties or may be more highly extincted than other HzRGs. To quantify this we measured the r.m.s. at the spectral position of H in each of the cubes where H falls into the band, but was not detected. We find a typical r.m.s. of a few erg s-1 cm-2, and up to erg s-1 cm-2 for the shallowest data sets. We used Monte Carlo simulations to estimate 3 limits on the integrated flux of these lines, assuming two line widths which are representative of the measured widths. For 1000 iterations, we can exclude line fluxes brighter than erg s-1 cm-2 and erg s-1 cm-2 at 3 significance for line widths of FWHM9500 km s-1 and FWHM12500 km s-1, respectively. This is about an order of magnitude fainter than the fluxes of the detected broad H lines.
3.2 Broad H line emission and extinction
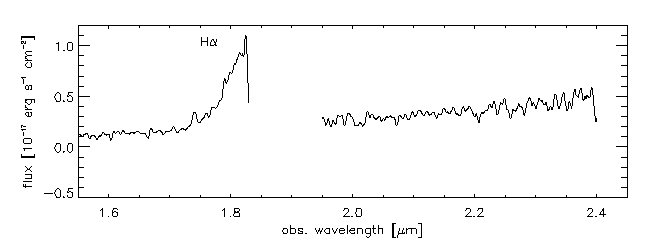
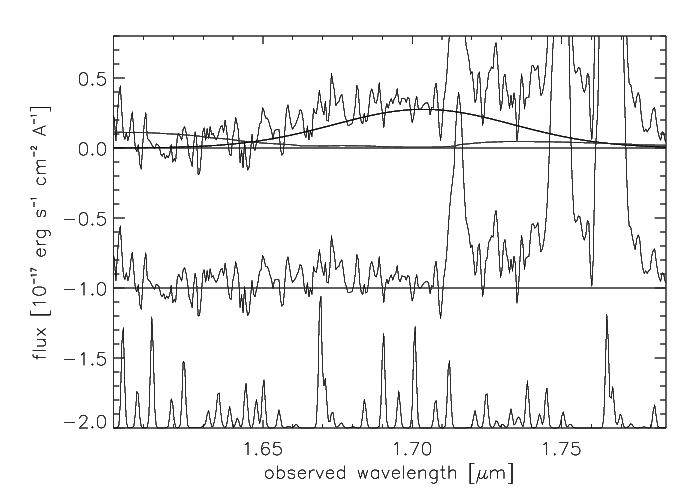
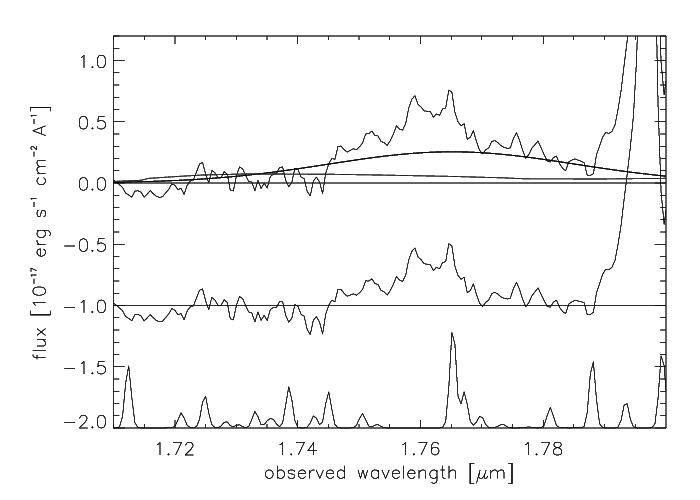
In the two galaxies with the deepest observations we also detected a broad H component in the H-band. Figure 3 shows the broad H line emission in MRC0156-252 and MRC1558-003. TXS1113-178 and MRC1138-262 have more shallow data which are not sufficient for probing H line emission in a similar way. In MRC0156-252 and MRC1017-220, H falls outside the near-infrared atmospheric windows.
Although the broad H lines are not intrinsically faint, they are difficult to detect due to their large widths compared to the resolution, imperfections in the night-sky line subtraction, superimposed narrow-line components, including [OIII]4959,5007, and the shape of the continuum. We therefore did not fit the redshift and widths of these lines individually, but used the values found for H to identify the lines and to estimate their fluxes. In Figure 3 we show the expected H profile for both galaxies. By scaling this spectrum we derive H/H flux ratios of F(H)/F(H)4-5 for both galaxies. By comparing our spectra with the FeII quasar template of Iwamuro et al. (2002) we can rule out strong FeII contamination at the wavelength of H.
For an intrinsic line ratio of H/H3.1 and a galactic extinction law, the observed H/H ratios correspond to an extinction of A1 mag. Dong et al. (2008) report very similar H/H ratios in radio-loud AGN at low redshift, H/H3.4.
Equally low extinctions are also suggested by comparing the observed H and X-ray fluxes. If most of the H line emission is due to photoionization of gas in the central few parsecs of the AGN, then simple energy conservation arguments imply that the H line emission cannot be more luminous than the X-ray emission. In fact, observations of nearby AGN suggest X-ray/H ratios of 3-20 (Ward et al., 1988; Imanishi & Terashima, 2004). X-ray luminosities are available in the literature for two of our sources. Overzier et al. (2005) measure erg s-1 at 2-6 keV for MRC0156-003, and Carilli et al. (2002) find erg s-1 at 2-10 keV for MRC1138-262. These X-ray and H luminosities given in Table 2 imply a ratio of X-ray to H emission of for both sources. This is within the range of values suggested by Ward et al. (1988) and Imanishi & Terashima (2004), and is fully consistent with relatively low extinction along the line of sight into the AGN. Alexander et al. (2008) give similar arguments for submillimeter-selected quasars and point out that this also suggests that scattering is unlikely to play a large role for the observed H line fluxes. The same applies to our HzRGs.
The same comparison for two HzRGs with similar X-ray and near-infrared data (Overzier et al., 2005; Nesvadba et al., 2008b) suggests that the HBLRs of HzRGs may generally suffer much higher extinction. Overzier et al. (2005) measure erg s-1 for MRC0406-244 at z=2.4 and erg s-1 for TXS0828+193 at z=2.6. (Nesvadba et al., 2008b) did not reveal any HBLRs but allow us to place upper limits on their observed H luminosity of erg s-1. This corresponds to much smaller fractions of their X-ray luminosity, 1/20 for MRC0406-244 and 1/100 for TXS0828+193. It may indicate that extinction depends strongly on the individual sightline into the AGN. This is plausible if the spatial distribution of the obscuring material is inhomogeneous and clumpy.
4 The supermassive black holes of HzRGs
4.1 The frequency of HBLRs in HzRGs
Previous discoveries of HBLRs in HzRGs have only been anecdotal (Larkin et al., 2000; Nesvadba et al., 2006; Humphrey et al., 2007, see also Economou et al. 1995; Willott et al. 2000 at somewhat lower redshifts, z1.5). Although we did not select a complete sample in the usual statistical sense, our targets include a significant fraction of the known HzRGs at these redshifts, and may therefore allow a rough assessment of how frequent HBLRs may be among the most powerful radio galaxies known at z2. Having 27 targets at redshifts where HBLRs fall into the atmospheric windows and adding 4 HzRGs at similar redshifts of Humphrey et al. (2007) which are not in our sample, we find that HBLRs were detected in 6/31 possible cases, corresponding to 20% of our sample.
4.2 The nature of HBLRs
HzRGs typically have luminous, extended line emission with complex kinematics. For example, Nesvadba et al. (2006, 2007, 2008b) find line widths of up to FWHM4000 km s-1 in the integrated spectra of HzRGs, which are due to spatially extended gas with large velocity gradients and line widths, and could mimic a BLR (see the example of MRC0156-262,§2). In our targets the H emission-line morphology shows a luminous, nuclear, and compact H emission-line component in addition to the more diffuse extended (and narrower) line emission. These broad components have no equivalent in [OIII]5007, unlike the emission from the diffuse gas, where the spectral profiles of H and [OIII]5007 are typically very similar (Nesvadba et al., 2007, 2008b). The absence of broad components of forbidden lines is among the prime characteristics of BLRs where the electron densities are high enough that forbidden levels are collisionally de-excited.
We take this as evidence that the HBLRs of our targets indeed trace gas in the vicinity of the supermassive black hole, and adopt the common interpretation that this gas is approximately in virial equilibrium and is an adequate tracer of the black hole mass. Accretion rates are relatively low in our sources (§4.4) well below the values for which we may expect strong disk winds (Kurosawa & Proga, 2009; Proga & Kallman, 2004).
4.3 Virial mass estimates
A number of recipes have been proposed to estimate black-hole masses from the line widths and luminosities (e.g., McLure & Jarvis, 2002; Vestergaard, 2002; Onken et al., 2004; Peterson et al., 2004; Vestergaard & Peterson, 2006), among which we choose the approach of Greene & Ho (2005) which relies on the properties of the H line only. This is the obvious method of choice, because H is the only line that is well detected in our targets.
Greene & Ho (2005) give a simple scaling for black-hole mass, , as a function of the FWHM and luminosity of the H line, , where FWHM3 and H luminosity are given in units of km s-1 and erg s-1. With this scaling and the luminosities and FWHMs given in Table 1, we find a relatively narrow range of black-hole masses of a few M⊙ and up to M⊙. Results for individual galaxies are given in Table 2.
Applying a method calibrated for quasars to radio galaxies can potentially introduce important systematic uncertainties, in particular owing to inclination and extinction. Section 3.2 suggests that extinction does not likely play a major role. Greene & Ho (2005) find an average observed ratio of H/H3.5, whereas we find H/H4. Since black-hole mass depends only weakly on the H luminosity, this difference is negligible.
Orientation is perhaps a bigger concern, if our radio galaxies are on average more strongly inclined relative to the line of sight than quasars ( e.g., Antonucci, 1993). Greene & Ho (2005) do not find any significant difference between radio-quiet and radio-loud quasars, but it is likely that their radio-loud sample consisted mostly of flat-spectrum quasars (although they do not comment on the radio spectral index).
Jarvis & McLure (2002) compare quasars with flat and steep-spectrum radio sources and find on average a factor 1.3 broader lines in steep-spectrum quasars similar to our HzRGs, which would correspond to a bias towards higher masses by a factor 1.8. Of course we cannot exclude that HzRGs may on average be even more strongly inclined than steep-spectrum radio-loud quasars. If, for example, the BLR in such a quasar had an inclination of 45∘ relative to the line of sight, and that of a radio galaxy an inclination of 80∘, then we would expect to overestimate the black hole mass by another factor , which is not very different from other astrophysical uncertainties (see also, e.g., Collin et al., 2006).
Orientations near the line of sight are also disfavored by relatively uniform and moderate fractions of the luminosity of the radio core relative to the lobes of 0.7% to 10% (Carilli et al., 1997; Pentericci et al., 2000), which suggest orientations between 45∘ and 60∘ (e.g.. Carilli et al., 1997). This also suggests that orientation probably does not introduce a major bias. Moreover, it is not clear whether the unified model is appropriate for high-redshift AGN, since evolutionary effects may at least play as large a role at high redshift (e.g. Hopkins et al., 2006, see also §6.). When necessary in the following we state both mass estimates, the one with and the one without inclination correction.
4.4 Eddington luminosities, radiative and mechanical luminosities
The accretion luminosity of a black hole is the second fundamental parameter we estimate from our data, by relating the bolometric luminosity with the maximally possible accretion luminosity for a spherically symmetric flow (Eddington luminosity). The Eddington luminosity, , of a SMBH scales with black-hole mass as erg s-1 (Rees, 1984). In Table 2 we list the Eddington luminosities corresponding to the black-hole masses estimated in §4.3.
The bolometric luminosity can be estimated from our data. Greene & Ho (2005) calibrated the broad H luminosity as a function of the continuum luminosity at 5100 Å, , and we adopt to translate the continuum luminosity at 5100 Å to the bolometric luminosity (Kaspi et al., 2000). With the black-hole properties listed in Table 2, we find accretion luminosities of 0.020.07 (0.040.14 for inclination-corrected black-hole masses, §4.3). This result is not dominated by extinction. H/H line ratios are not much higher than those of quasars (Greene & Ho, 2005), and Eddington luminosity and bolometric luminosity only weakly depend on with powers of 0.55 and 0.86, respectively. Therefore extinction is unlikely to lower the Eddington ratios by more than %.
4.5 Kinetic luminosity of the radio source
In §6 we rely on the radiative and mechanical energy output rates of the supermassive black holes. This requires constraining the kinetic jet luminosity, which is inherently difficult, because the observed radio luminosity is not a good tracer of the energy content of the relativistic jet plasma. Consequently, jet kinetic powers are only known at an order-of-magnitude level or worse (e.g., Bicknell, 1995). We adopt two different methods to estimate the kinetic power in our sources. Both methods rely on low-frequency fluxes, which we estimate from extrapolating along the power law of the radio synchrotron emission based on multi-frequency observations listed in the NED extragalactic data base.
First, we use the calibration of Bîrzan et al. (2008), who estimated the energy necessary to inflate cavities in the diffuse hot gas of massive galaxy clusters. This is a very direct empirical estimate of the jet kinetic power, but was derived for radio sources that are 2-3 orders of magnitude less powerful than those in our targets. Second, we rely on the results of Willott et al. (1999), who propose a scaling of the kinetic power as a function of the monochromatic radio flux at 151 MHz, erg s-1. Here indicates the measured flux density at 151 MHz in units of W Hz-1 sr-1, and is a correction factor which includes the most salient astrophysical uncertainties. It is likely in the range 120, and we adopt a value of 10, following the arguments given in Cattaneo et al. (2009).
5 Black-hole bulge mass relationship
The scaling relationships of black holes and bulges are important tracers of the (possibly self-)regulated growth of black holes and galaxies across cosmic time. Accordingly, much observational effort has been invested in tracing the redshift evolution of these relationships (e.g., Shields et al., 2003, 2006; Woo et al., 2006; Peng et al., 2006; Treu et al., 2007; Shen et al., 2008), although sometimes with contradictory results. Overall these observations advocate a relatively mild redshift evolution of a few tenths of dex out to moderate redshifts (z1).
We now compare our HzRGs with the local relationship, relying on our black-hole mass estimates (§4.3) and the photometric mass estimates of Seymour et al. (2007). Seymour et al. estimated masses or upper limits for 70 HzRGs with Spitzer rest-frame near-infrared observations, constraining the relative contribution of the stellar component and dust at different temperatures. Photometric estimates of stellar masses are relatively robust for a range of star-formation histories, but poorly constrained ages and initial mass functions cause systematic uncertainties of factors of up to about 2-3 for plausible ages between few yrs and about yrs. 5 of our galaxies are included in the sample of Seymour et al. (2007). For TXS1113-178, which is not part of this sample, we use the average mass of the Seymour et al. sample, M⊙. We prefer to use this average mass rather than the K-bands magnitude derived from our SINFONI cube, because the latter may be significantly contaminated by the AGN, whereas the Seymour et al. observations are near the rest-frame H-band where the stellar contribution to the overall spectral energy distribution is maximal. Moreover, the HzRGs of Seymour et al. (2007) span a narrow mass range overall, not much greater than the uncertainties in the mass estimates of individual galaxies. In the following we also assume that these are spheroid-dominated systems, consistent with the morphological studies of van Breugel et al. (1998) and Pentericci et al. (2001), and plausible for high stellar masses of few M⊙.
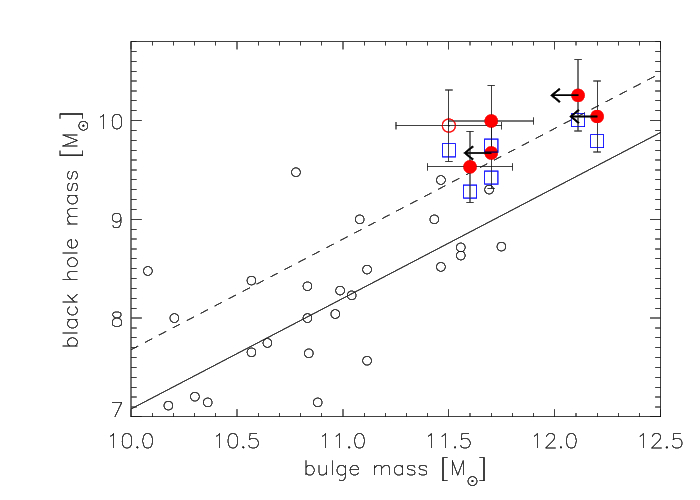
In Figure 4 we show the black-hole bulge mass relationship of our HzRGs and compare it with the relationship for nearby galaxies derived by Häring & Rix (2004). Arrows mark galaxies for which Seymour et al. (2007) give upper limits on the stellar mass. A new, ongoing analysis of the Seymour et al. sample suggests that these upper limits are at most 20%-50% larger than the actual masses. This is negligible for our purposes. The sole exception may be MRC1138-262 where the distinction between AGN and stellar continuum is more difficult due to the particularly powerful AGN. This analysis is based on IRAC and MIPS 24m and 60m photometry for all targets and includes a more systematic analysis of the dust emission (De Breuck et al. in prep.)
We focus in the following on the ensemble properties of our sample, but each individual galaxy falls within the scatter of the local relationship (Figure 4). This illustrates that HzRGs have at most about 4 larger black-hole masses for a given bulge mass than expected from the local relationship (a factor 2 if we use inclination-corrected black-hole mass estimates, see §4.3). This is broadly consistent with the redshift evolution of radio-loud AGN found by McLure et al. (2006), if we extrapolate to the redshifts of our sources. McLure et al. used the observed K-band magnitudes of radio galaxies to estimate bulge masses and steep-spectrum quasars out to z1.52.0, and predict an offset from the local relationship by 0.6 dex for z2.
The offset we find is significantly less than those reported for other populations of massive, strongly star-forming galaxies at z2, (e.g. Walter et al., 2004; Alexander et al., 2008; Coppin et al., 2008; Wang et al., 2010). The reason could be that we used stellar masses instead of dynamical masses based on the width of CO line emission like the above analyses, or it could indicate evolutionary effects. Redshifts z1-2 are the most rapid phase in the evolution of massive galaxies, which makes observations at these redshifts particularly interesting, in spite of the observational challenges.
The offset of HzRGs relative to the local sequence is formally consistent with observations of the redshift evolution of the M- relationship out to moderate (z0.5) redshifts. Using, e.g., the relationship of Woo et al. (2008), we would expect an offset by a factor . However, it is not clear whether this is indeed an evolutionary effect or caused by selection effects. For example, our HzRGs, which are somewhat more massive than the local sample of Häring & Rix, would fall on the relationship by Häring & Rix (2004), if the latter was somewhat steepened (within their scatter). Alternatively, e.g., Wyithe (2006) propose that black hole and bulge properties could be related through a log-quadratic rather than a log-linear relationship, in which case our targets would show no sign of evolution.
Observational biases may also contribute. For example, following Lauer et al. (2007) we may expect that the intrinsic scatter in the relationship combined with the the steep slope of the high-mass end of the galaxy mass function may bias the relationship for massive galaxies towards higher black hole masses. We argue in §7 that, whether this offset is intrinsic or not, mild offsets of factors 2-4 are not inconsistent with the basic picture where HzRGs are massive galaxies that have completed most of their growth by z2.
6 Low accretion rates of SMBHs in HzRGs
In §4.4 we used our black-hole mass estimates and broad-line luminosities to estimate accretion luminosities for our targets in the range of a few and up to about 10% Eddington. When reaching similar accretion luminosities of a few percent Eddington, Galactic “miniquasars” undergo rapid changes in their accretion properties, with dramatic effects for their X-ray and radio emission (e.g., Nowak, 1995; Maccarone et al., 2003; Körding et al., 2006a, b; Fender et al., 2004). The analogy with these stellar-mass black holes has very recently inspired several authors to propose a fairly complex scenario of “synthesis” (Merloni & Heinz, 2008) or “unified” (Fanidakis et al., 2009) AGN feedback, where an initial, strongly radiative phase with high accretion rates is followed by a later phase with low accretion rates, during which the radio source inhibits gas cooling and accretion through the injection of kinetic energy into the ambient medium (see also, e.g., Sijacki et al., 2007). Churazov et al. (2005) proposes that this may be accompanied by episodes of highly unstable accretion, rapid “radio flaring”, and powerful radio activity. Merloni & Heinz (2008) use the local black-hole mass function and X-ray constraints on the radiative energy output of AGN to quantify the accretion and feedback history of AGN within this scenario in a semi-empirical way.
The HzRGs of our sample have luminous ( erg s-1) AGN as well as very short-lived (a few yrs; Blundell & Rawlings, 1999), powerful radio sources of up to W Hz-1 at 500 MHz (Miley & De Breuck, 2008), and they show the signatures of fast, AGN-driven kpc-scale outflows of significant fractions of their interstellar medium (Nesvadba et al., 2006, 2008b). These are several of the characteristics expected for the ’flaring’ phase between radiative and kinetic feedback in the ’synthesis’ models, and the low accretion rates of their black holes could be another. Churazov et al. (2005) postulate that during this phase, kinetic feedback and gas heating become more efficient as accretion rates drop further, until AGN and host galaxy reach a state where very low accretion rates can efficiently balance gas cooling (Croton et al., 2006). This may be the case in nearby, massive, early-type galaxies with radio sources (Best et al., 2006; Hardcastle et al., 2007) where star formation is significantly less efficient than in ordinary star-forming galaxies (Nesvadba et al., 2010).
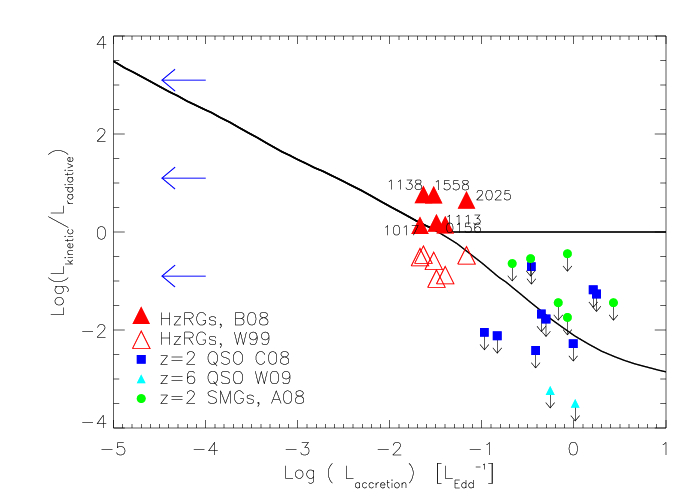
For a more quantitative comparison we show the ratio of kinetic to radiative energy output (derived in §4.5 and §4.4, respectively) in Figure 5 as a function of accretion luminosity. We adopted this Figure from Merloni & Heinz (2008, their Figure 1.), and use the kinetic luminosities derived with the relationship of Willott et al. (1999) and Bîrzan et al. (2008),respectively. For accretion luminosities above the critical value, the line splits to accommodate radio-quiet (lower branch) and radio-loud (upper branch) AGN. All of our targets are in the critical accretion regime, and have ratios of kinetic-to-radiative power that are near the values suggested by Merloni & Heinz (2008).
Figure 5 also shows other populations of powerful AGN in massive, intensely star-forming galaxies at z2, like submillimeter galaxies with BLR measurements (Alexander et al., 2008), and quasars at redshift z2 and z6, respectively (taken from Coppin et al., 2008; Walter et al., 2004; Wang et al., 2010). To estimate the kinetic luminosity of the radio sources in these samples, we used the approach outlined in §4.5 and published radio fluxes, where we assumed a radio spectral index of 0.8. For the high-redshift AGN, this has the character of an upper limit, because the observed faint radio fluxes may be significantly contaminated, or even dominated, by star formation. Unlike the HzRGs, these galaxies do not fall into the critical accretion regime.
Similarly, the black holes in our HzRGs seem to have lower accretion luminosities than equally massive black holes studied in large quasar surveys at z2-3. For example, Kollmeier et al. (2006) find that typical accretion luminosities in their X-ray and infrared-selected quasar sample taken from the AGES survey are a factor 10 higher (but tails of their distribution extend to the same range found for HzRGs). Their selection suggests 70% completeness for black holes with masses and accretion luminosities 0.01 , similar to those in HzRGs, making this comparison robust (but see, e.g. Kelly et al., 2010; Schulze & Wisotzki, 2010, for a discussion of the effects of incompleteness in statistical studies of the accretion history of AGN).
7 Implications for high-redshift galaxy evolution
Observational evidence is growing that the host galaxies of HzRGs may be massive galaxies seen during a late stage of their active formation phase: At all redshifts, radio galaxies are among the brightest galaxies in the K-band, suggesting they are at the upper end of the mass function (De Breuck et al., 2001; Willott et al., 2003, see also Seymour et al. 2007). At redshifts z, most HzRGs are luminous submillimeter emitters with intense star formation, whereas only few galaxies are detected at lower redshifts (Archibald et al., 2001; Reuland et al., 2004). If this is not entirely from selection effects, then it may suggest that HzRGs as an ensemble are transiting from actively star-forming to passively evolving during this epoch, perhaps as a consequence of AGN feedback signaled by the extended outflows of warm ionized gas. It is interesting that this happens during the epoch where the red sequence seems to emerge (Kodama et al., 2007).
The results of §§5 and 6 suggest that the black holes in HzRGs may also be nearing the end of their period of active growth. Compared to submillimeter galaxies and quasars at z2 (Alexander et al., 2008; Coppin et al., 2008; Walter et al., 2004; Wang et al., 2010), they fall remarkably close to the local relationship between black hole and bulge mass, as can be expected if the evolution of black holes and bulges is driven by the same mechanism.
Figure 5 suggests that the accretion rates of HzRGs may have dropped to a critical value where mechanical feedback begins to dominate radiative feedback, unlike the black holes in the above mentioned submillimeter galaxies and quasars, which all have higher accretion rates. It is tempting to speculate that this transition may also have triggered the large-scale outflows of the HzRGs, which may sweep up and heat the ambient cold gas out to scales of 10s of kpc. Integral-field spectroscopy of luminous, infrared-selected quasars with moderate radio sources reveals disturbed gas kinematics, but no evidence of equally strong outflows extending over scales of 10s of kpc (Alexander et al., 2010, Polletta et al., in prep.).
Obviously, radiatively efficient accretion is maintained in HzRGs, with few erg s-1, but outflow rates of a few 100 M⊙ yr-1 of warm ionized gas (ignoring other gas phases Nesvadba et al., 2006, 2008b) suggest that the gas supply for star formation and AGN activity is being depleted rapidly. Broad UV absorption lines in MRC2025-218 (Humphrey et al., 2008), reminiscent of broad absorption lines sometimes observed in quasars, suggest that outflows are also present near the black hole, making it plausible that, after the radio-loud phase, neither the supermassive black holes in HzRGs nor their host galaxies, will have enough “fuel” to maintain much more growth, unless significant amounts of cold gas are supplied, for example through a major merger. The environments of HzRGs are rich in ionized, neutral, and molecular gas (Villar-Martín et al., 2003; van Ojik et al., 1997; Nesvadba et al., 2009), but the analogy with nearby massive galaxy clusters illustrates that much of this gas can be heated by the AGN (see, e.g., McNamara & Nulsen, 2007, and references therein).
Moderate, subsequent bulge growth may occur through accretion of satellite galaxies of HzRGs (Nesvadba et al., 2008b; Hatch et al., 2009). Ram-pressure stripping, tidal effects, and on-going star formation will likely have removed much of the gas in the satellites by the time they merge, in which case galaxy growth would not necessarily lead to black-hole growth (Kazantzidis et al., 2005). This is consistent with structural parameters of nearby massive early-type and cD galaxies (Weinzirl et al., 2009; Schombert, 1987) and could eliminate the small offset of HzRGs from the local black-hole bulge mass relationship (if it is not entirely due to systematic effects), or else change the position of our galaxies by a few dex within the large scatter of this relationship.
8 Summary
We presented an analysis of the black-hole properties in 6 powerful radio galaxies at z2 (HzRGs), which show broad, luminous H line emission that we identify as emission from the AGN broad-line region (HBLR). This study is part of an ongoing, systematic analysis of 50 HzRGs with rest-frame optical integral-field spectroscopy and with the goal of quantifying the role of AGN feedback for galaxy evolution at high redshift. Our main results are as follows.
(1) HBLRs in HzRGs are not rare. 6/31 HzRGs at redshifts where H can be observed show HBLRs, corresponding to 20% of our sample. The broad H lines have emission-line luminosities of a few erg s-1 and line widths of FWHM 10,000 km s-1. Broad H lines in 2 cases and X-ray constraints suggest low extinction (A 1 mag).
(2) We estimate black-hole masses and bolometric luminosities from the H luminosities and line widths, finding masses of a few M⊙ and up to M⊙ which is broadly consistent with the masses of the most massive black holes in the nearby universe. Bolometric luminosities are a few percent of the Eddington luminosity, lower than in other populations of massive, intensely star-forming galaxies and quasars with black holes of similar mass.
(3) Black-hole and stellar masses suggest that HzRGs fall on the black-hole bulge mass relationship for local galaxies, formally with a small offset to lower bulge masses by at most a factor 4. Much of this offset may be from systematic effects; alternatively, it could be explained with an extended phase of accretion of (gas-poor) satellite galaxies.
(4) Relative to the Eddington luminosities, HzRGs have radiative and (through the radio source) mechanical energy output rates that are in the “critical” range expected by recent “unifie”’ AGN feedback scenarios. This could imply that they have reached the end of their period of active growth, if these models are fundamentally correct. We argue that the same is probably true for the host galaxies of HzRGs, suggesting that black hole and host galaxy could be terminating their phase of active growth at the same time.
Acknowledgments
We would like to thank the staff at Paranal for having carried out the observations and the ESO TAC for the generous allocation of observing time. We thank the referee for comments that helped substantially improve the paper. NPHN wishes to thank Elmar Körding for interesting discussions about big and small black holes near and far during a visit in Southampton. NPHN and MDL wish to thank the CNRS for the continuous financial support.
References
- Alexander et al. (2008) Alexander, D. M., Brandt, W. N., Smail, I., et al. 2008, AJ, 135, 1968
- Alexander et al. (2010) Alexander, D. M., Swinbank, A. M., Smail, I., McDermid, R., & Nesvadba, N. P. H. 2010, MNRAS, 57
- Antonucci (1993) Antonucci, R. 1993, ARA&A, 31, 473
- Archibald et al. (2001) Archibald, E. N., Dunlop, J. S., Hughes, D. H., et al. 2001, MNRAS, 323, 417
- Best et al. (2006) Best, P. N., Kaiser, C. R., Heckman, T. M., & Kauffmann, G. 2006, MNRAS, 368, L67
- Bicknell (1995) Bicknell, G. V. 1995, ApJS, 101, 29
- Bîrzan et al. (2008) Bîrzan, L., McNamara, B. R., Nulsen, P. E. J., Carilli, C. L., & Wise, M. W. 2008, ApJ, 686, 859
- Blundell & Rawlings (1999) Blundell, K. M. & Rawlings, S. 1999, Nature, 399, 330
- Bonnet et al. (2004) Bonnet, H., Abuter, R., Baker, A., et al. 2004, The Messenger, 117, 17
- Booth & Schaye (2010) Booth, C. M. & Schaye, J. 2010, MNRAS, 405, L1
- Bower et al. (2006) Bower, R. G., Benson, A. J., Malbon, R., et al. 2006, MNRAS, 370, 645
- Caputi et al. (2006) Caputi, K. I., Dole, H., Lagache, G., et al. 2006, ApJ, 637, 727
- Carilli et al. (2002) Carilli, C. L., Harris, D. E., Pentericci, L., et al. 2002, ApJ, 567, 781
- Carilli et al. (1997) Carilli, C. L., Röttgering, H. J. A., van Ojik, R., Miley, G. K., & van Breugel, W. J. M. 1997, ApJS, 109, 1
- Cattaneo et al. (2007) Cattaneo, A., Blaizot, J., Weinberg, D. H., et al. 2007, MNRAS, 377, 63
- Cattaneo et al. (2009) Cattaneo, A., Faber, S. M., Binney, J., et al. 2009, Nature, 460, 213
- Churazov et al. (2005) Churazov, E., Sazonov, S., Sunyaev, R., et al. 2005, MNRAS, 363, L91
- Ciotti & Ostriker (2007) Ciotti, L. & Ostriker, J. P. 2007, ApJ, 665, 1038
- Ciotti et al. (2009) Ciotti, L., Ostriker, J. P., & Proga, D. 2009, ApJ, 699, 89
- Collin et al. (2006) Collin, S., Kawaguchi, T., Peterson, B. M., & Vestergaard, M. 2006, A&A, 456, 75
- Coppin et al. (2008) Coppin, K. E. K., Swinbank, A. M., Neri, R., et al. 2008, MNRAS, 389, 45
- Croton et al. (2006) Croton, D. J., Springel, V., White, S. D. M., et al. 2006, MNRAS, 365, 11
- De Breuck et al. (2005) De Breuck, C., Downes, D., Neri, R., et al. 2005, A&A, 430, L1
- De Breuck et al. (2003) De Breuck, C., Neri, R., & Omont, A. 2003, New Astronomy Review, 47, 285
- De Breuck et al. (2001) De Breuck, C., van Breugel, W., Röttgering, H., et al. 2001, AJ, 121, 1241
- Di Matteo et al. (2005) Di Matteo, T., Springel, V., & Hernquist, L. 2005, Nature, 433, 604
- Dong et al. (2008) Dong, X., Wang, T., Wang, J., et al. 2008, MNRAS, 383, 581
- Eales & Rawlings (1996) Eales, S. A. & Rawlings, S. 1996, ApJ, 460, 68
- Economou et al. (1995) Economou, F., Lawrence, A., Ward, M. J., & Blanco, P. R. 1995, MNRAS, 272, L5
- Fanidakis et al. (2009) Fanidakis, N., Baugh, C. M., Benson, A. J., et al. 2009, ArXiv e-prints
- Fender et al. (2004) Fender, R. P., Belloni, T. M., & Gallo, E. 2004, MNRAS, 355, 1105
- Ferrarese (2002) Ferrarese, L. 2002, ApJ, 578, 90
- Gebhardt et al. (2000) Gebhardt, K., Bender, R., Bower, G., et al. 2000, ApJ, 539, L13
- Graham et al. (2001) Graham, A. W., Erwin, P., Caon, N., & Trujillo, I. 2001, ApJ, 563, L11
- Greene & Ho (2005) Greene, J. E. & Ho, L. C. 2005, ApJ, 630, 122
- Hardcastle et al. (2007) Hardcastle, M. J., Evans, D. A., & Croston, J. H. 2007, MNRAS, 376, 1849
- Häring & Rix (2004) Häring, N. & Rix, H.-W. 2004, ApJ, 604, L89
- Hatch et al. (2009) Hatch, N. A., Overzier, R. A., Kurk, J. D., et al. 2009, MNRAS, 395, 114
- Hopkins et al. (2006) Hopkins, P. F., Hernquist, L., Cox, T. J., et al. 2006, ApJS, 163, 1
- Hopkins et al. (2007) Hopkins, P. F., Hernquist, L., Cox, T. J., Robertson, B., & Krause, E. 2007, ApJ, 669, 45
- Humphrey et al. (2007) Humphrey, A., Villar-Martín, M., Fosbury, R., et al. 2007, MNRAS, 375, 705
- Humphrey et al. (2008) Humphrey, A., Villar-Martín, M., Vernet, J., et al. 2008, MNRAS, 383, 11
- Imanishi & Terashima (2004) Imanishi, M. & Terashima, Y. 2004, AJ, 127, 758
- Iwamuro et al. (2002) Iwamuro, F., Motohara, K., Maihara, T., et al. 2002, ApJ, 565, 63
- Jarvis & McLure (2002) Jarvis, M. J. & McLure, R. J. 2002, MNRAS, 336, L38
- Kaspi et al. (2000) Kaspi, S., Smith, P. S., Netzer, H., et al. 2000, ApJ, 533, 631
- Kazantzidis et al. (2005) Kazantzidis, S., Mayer, L., Colpi, M., et al. 2005, ApJ, 623, L67
- Kelly et al. (2010) Kelly, B. C., Vestergaard, M., Fan, X., et al. 2010, ApJ, 719, 1315
- Kodama et al. (2007) Kodama, T., Tanaka, I., Kajisawa, M., et al. 2007, MNRAS, 377, 1717
- Kollmeier et al. (2006) Kollmeier, J. A., Onken, C. A., Kochanek, C. S., et al. 2006, ApJ, 648, 128
- Körding et al. (2006a) Körding, E. G., Fender, R. P., & Migliari, S. 2006a, MNRAS, 369, 1451
- Körding et al. (2006b) Körding, E. G., Jester, S., & Fender, R. 2006b, MNRAS, 372, 1366
- Körding et al. (2008) Körding, E. G., Jester, S., & Fender, R. 2008, MNRAS, 383, 277
- Kurosawa & Proga (2009) Kurosawa, R. & Proga, D. 2009, MNRAS, 397, 1791
- Larkin et al. (2000) Larkin, J. E., McLean, I. S., Graham, J. R., et al. 2000, ApJ, 533, L61
- Lauer et al. (2007) Lauer, T. R., Tremaine, S., Richstone, D., & Faber, S. M. 2007, ApJ, 670, 249
- Maccarone et al. (2003) Maccarone, T. J., Gallo, E., & Fender, R. 2003, MNRAS, 345, L19
- Magorrian et al. (1998) Magorrian, J., Tremaine, S., Richstone, D., et al. 1998, AJ, 115, 2285
- McLure & Jarvis (2002) McLure, R. J. & Jarvis, M. J. 2002, MNRAS, 337, 109
- McLure et al. (2006) McLure, R. J., Jarvis, M. J., Targett, T. A., Dunlop, J. S., & Best, P. N. 2006, MNRAS, 368, 1395
- McNamara & Nulsen (2007) McNamara, B. R. & Nulsen, P. E. J. 2007, ARA&A, 45, 117
- Merloni & Heinz (2008) Merloni, A. & Heinz, S. 2008, MNRAS, 388, 1011
- Miley & De Breuck (2008) Miley, G. & De Breuck, C. 2008, A&A Rev., 1
- Nesvadba et al. (2010) Nesvadba, N., Boulanger, F., Salome, P., et al. 2010, A&A, accepted
- Nesvadba et al. (2008a) Nesvadba, N. P. H., Lehnert, M. D., Davies, R. I., Verma, A., & Eisenhauer, F. 2008a, A&A, 479, 67
- Nesvadba et al. (2007) Nesvadba, N. P. H., Lehnert, M. D., De Breuck, C., Gilbert, A., & van Breugel, W. 2007, A&A, 475, 145
- Nesvadba et al. (2008b) Nesvadba, N. P. H., Lehnert, M. D., De Breuck, C., Gilbert, A. M., & van Breugel, W. 2008b, A&A, 491, 407
- Nesvadba et al. (2006) Nesvadba, N. P. H., Lehnert, M. D., Eisenhauer, F., et al. 2006, ApJ, 650, 693
- Nesvadba et al. (2009) Nesvadba, N. P. H., Neri, R., De Breuck, C., et al. 2009, MNRAS, 395, L16
- Nowak (1995) Nowak, M. A. 1995, PASP, 107, 1207
- Onken et al. (2004) Onken, C. A., Ferrarese, L., Merritt, D., et al. 2004, ApJ, 615, 645
- Overzier et al. (2005) Overzier, R. A., Harris, D. E., Carilli, C. L., et al. 2005, A&A, 433, 87
- Papadopoulos et al. (2000) Papadopoulos, P. P., Röttgering, H. J. A., van der Werf, P. P., et al. 2000, ApJ, 528, 626
- Pei (1995) Pei, Y. C. 1995, ApJ, 438, 623
- Peng et al. (2006) Peng, C. Y., Impey, C. D., Rix, H., et al. 2006, ApJ, 649, 616
- Pentericci et al. (2001) Pentericci, L., McCarthy, P. J., Röttgering, H. J. A., et al. 2001, ApJS, 135, 63
- Pentericci et al. (2000) Pentericci, L., Van Reeven, W., Carilli, C. L., Röttgering, H. J. A., & Miley, G. K. 2000, A&AS, 145, 121
- Peterson et al. (2004) Peterson, B. M., Ferrarese, L., Gilbert, K. M., et al. 2004, ApJ, 613, 682
- Proga & Kallman (2004) Proga, D. & Kallman, T. R. 2004, ApJ, 616, 688
- Rees (1984) Rees, M. J. 1984, ARA&A, 22, 471
- Reuland et al. (2004) Reuland, M., Röttgering, H., van Breugel, W., & De Breuck, C. 2004, MNRAS, 353, 377
- Röttgering et al. (1997) Röttgering, H. J. A., van Ojik, R., Miley, G. K., et al. 1997, A&A, 326, 505
- Schombert (1987) Schombert, J. M. 1987, ApJS, 64, 643
- Schulze & Wisotzki (2010) Schulze, A. & Wisotzki, L. 2010, A&A, 516, A87+
- Seymour et al. (2007) Seymour, N., Stern, D., De Breuck, C., et al. 2007, ApJS, 171, 353
- Shankar et al. (2009) Shankar, F., Bernardi, M., & Haiman, Z. 2009, ApJ, 694, 867
- Shen et al. (2008) Shen, Y., Greene, J. E., Strauss, M. A., Richards, G. T., & Schneider, D. P. 2008, ApJ, 680, 169
- Shields et al. (2003) Shields, G. A., Gebhardt, K., Salviander, S., et al. 2003, ApJ, 583, 124
- Shields et al. (2006) Shields, G. A., Menezes, K. L., Massart, C. A., & Vanden Bout, P. 2006, ApJ, 641, 683
- Sijacki et al. (2007) Sijacki, D., Springel, V., Di Matteo, T., & Hernquist, L. 2007, MNRAS, 380, 877
- Silk & Rees (1998) Silk, J. & Rees, M. J. 1998, A&A, 331, L1
- Springel et al. (2005) Springel, V., Di Matteo, T., & Hernquist, L. 2005, MNRAS, 361, 776
- Tecza et al. (2000) Tecza, M., Thatte, N. A., Eisenhauer, F., et al. 2000, in Society of Photo-Optical Instrumentation Engineers (SPIE) Conference Series, Vol. 4008, Society of Photo-Optical Instrumentation Engineers (SPIE) Conference Series, ed. M. Iye & A. F. Moorwood, 1344–1350
- Tremaine et al. (2002) Tremaine, S., Gebhardt, K., Bender, R., et al. 2002, ApJ, 574, 740
- Treu et al. (2007) Treu, T., Woo, J.-H., Malkan, M. A., & Blandford, R. D. 2007, ApJ, 667, 117
- van Breugel et al. (1998) van Breugel, W. J. M., Stanford, S. A., Spinrad, H., Stern, D., & Graham, J. R. 1998, ApJ, 502, 614
- van Ojik et al. (1997) van Ojik, R., Röttgering, H. J. A., Miley, G. K., & Hunstead, R. W. 1997, A&A, 317, 358
- Vestergaard (2002) Vestergaard, M. 2002, ApJ, 571, 733
- Vestergaard & Peterson (2006) Vestergaard, M. & Peterson, B. M. 2006, ApJ, 641, 689
- Villar-Martín et al. (2003) Villar-Martín, M., Vernet, J., di Serego Alighieri, S., et al. 2003, MNRAS, 346, 273
- Walter et al. (2004) Walter, F., Carilli, C., Bertoldi, F., et al. 2004, ApJ, 615, L17
- Wang et al. (2010) Wang, R., Carilli, C. L., Neri, R., et al. 2010, ArXiv e-prints
- Ward et al. (1988) Ward, M. J., Done, C., Fabian, A. C., Tennant, A. F., & Shafer, R. A. 1988, ApJ, 324, 767
- Weinzirl et al. (2009) Weinzirl, T., Jogee, S., Khochfar, S., Burkert, A., & Kormendy, J. 2009, ApJ, 696, 411
- Willott et al. (1999) Willott, C. J., Rawlings, S., Blundell, K. M., & Lacy, M. 1999, MNRAS, 309, 1017
- Willott et al. (2000) Willott, C. J., Rawlings, S., & Jarvis, M. J. 2000, MNRAS, 313, 237
- Willott et al. (2003) Willott, C. J., Rawlings, S., Jarvis, M. J., & Blundell, K. M. 2003, MNRAS, 339, 173
- Woo et al. (2006) Woo, J., Treu, T., Malkan, M. A., & Blandford, R. D. 2006, ApJ, 645, 900
- Woo et al. (2008) Woo, J., Treu, T., Malkan, M. A., & Blandford, R. D. 2008, ApJ, 681, 925
- Wyithe (2006) Wyithe, J. S. B. 2006, MNRAS, 365, 1082
- Younger et al. (2008) Younger, J. D., Hopkins, P. F., Cox, T. J., & Hernquist, L. 2008, ApJ, 686, 815
| Source | Redshift | FWHM(H)222corrected for instrumental resolution | F(H)333for the broad line | F(H)444for the broad line. | AV555V-band extinction of the broad line region. | |
|---|---|---|---|---|---|---|
| km s | erg s | erg s | mag | |||
| MRC0156-252 | 19764.1 | 2.01143 | 12436 | |||
| MRC1017-220 | 18202.9 | 1.77356 | 12006 | |||
| TXS1113-178 | 21253.7 | 2.23851 | 11063 | |||
| MRC1138-262 | 20817.9 | 2.17201 | 14900 | |||
| MRC1558-003 | 23002.5 | 2.50488 | 12425 | 0.9 | ||
| MRC2025-218 | 23829.9 | 2.63094 | 8023.6 | 1.0 |
| Source | (H)666not corrected for extinction | MBH777masses corrected for a putative orientation bias would be factors 2 lower | 888Eddington luminosities corrected for a putative orientation bias would be factors 2 lower. | 999not corrected for extinction | 101010estimated with the relationship of Bîrzan et al. (2008) | 111111estimated with the relationship of Willott et al. (1999) | Mstellar121212from Seymour et al. (2007) |
|---|---|---|---|---|---|---|---|
| erg s | M | erg s | erg s | erg s | erg s | M | |
| MRC0156-252 | 7 | 1.6 | |||||
| MRC1017-220 | 2 | 5 | |||||
| TXS1113-178 | 7 | N/A | |||||
| MRC1138-262 | 3 | 1.2 | |||||
| MRC1558-003 | 2 | 5 | |||||
| MRC2025-218 | 1 | 4 |