OPTICAL MULTICOLOR –OBSERVATIONS OF THE X–RAY STAR V1341 CYG CYG X–2 IN
1986–1992
Sternberg Astronomical Institute, Moscow State University, Universitetskii pr. 13, Moscow, 119992 Russia
2010 A.N. Sazonov
Abstract
We present the results of observations of the low–mass X-ray binary V1341 X–2. Our observations include a total of 2375 individual measurements in four bands on 478 nights in 1986–1992. We tied the comparison and check stars used for the binary to the catalog using their magnitudes. The uncertainty of this procedure was 3 in the and bands and 8–10 for the and bands. In quiescence, the amplitude of the periodic component in the binary’s brightness variations is within ( in ); this is due to the ellipsoidal shape of the optical component, which is distorted with gravitational forces from the X–ray component. Some of the system’s active states (long flares) may be due to instabilities in the accretion disk, and possibly to instabilities of gas flows and other accretion structures. The binary possesses a low–luminosity accretion disk. The light curves reveal no indications of an eclipse near the phases of the upper and lower conjunctions in quiescence or in active states during the observed intervals. We conclude that the optical star in the close binary V1341 X–2 is a red giant rather than a blue straggler. We studied the long-term variability of the binary during the seven years covered by our observations. The optical observations presented in this study are compared to X–ray data from the Ginga observatory for the same time intervals.
1 INTRODUCTION
The X–ray source Cyg X–2 was identified with a variable star, later named V1341 Cyg [1]. Cyg X-2 is a low-mass, close binary system with an accreting neutron star, and is one of the brightest objects of this type in the X-ray.
According to its rapid X-ray variability and spectral behavior, Cyg X–2 belongs to the Z class of X–ray sources [2], characterized by their Z-shaped tracks in the X-ray color–color diagram. The Z-shaped track is traditionally subdivided into the horizontal branch (HB), the normal branch (NB), and flaring branch (FB), which correspond to the upper, middle, and lower parts of the diagram, respectively.
It is generally thought that the position along the Z-shaped track is related to the rate of matter accretion onto the neutron star [2–5], which is reflected in many optical photometric features [6–9].
The orbital period of V1341 Cyg was determined spectroscopically, from the radial velocity of the X-ray binary’s optical component [10, 11]. The orbital period is , the epoch of periastron passage is , the orbital eccentricity is , the semi-amplitude of the radial velocity curve is km/s, and the spectral type of the optical component is F2III–IV.
Until recently, it was believed that the close binary V1341 X-2 is characterized by two physical states with considerably different optical light curves: a quiescent and active state. The system displays two types of activity.
1. Short-term flares, less than a day in duration, when the combined brightness of the binary can increase by in the band and by in the band. Brightness variations within an observing night (about four to six hours of continuous observations) are observed fairly frequently during periods of activity of this type, followed by a period of smooth or rapid fading (over 1.5–2 hours). The star is in quiescence on the nights preceding and following the flare.
2. Long-term flares (some such active states of the binary are probably due to instabilities in the accretion disk), five to ten days in duration (or even longer), when the brightness increases by in the band and by in the band. In these cases, the level of the ellipsoidal light curve quickly increases, stays at its maximum for three to four days, and then smoothly decreases. This kind of activity sometimes occurs cyclically [12], but with cycles sometimes not being observed for two to three months.
The X-ray observations of late 1980s and early 1990s (EXOSAT, OSO-8, HEAO-1, Einstein, Ginga) considerably improved the existing models of X-ray binary systems (see, for example, [7, 13–16]).
The light curves we obtained for the system in 1986–1992 during quiescent states qualitatively agree with the optical light curves of other observers. There is a partial correlation with the X-ray data for the same observing periods [2].
The system contains a low-luminosity accretion disk, similar to those of dwarf novae, and some of the system’s active states (long-term flares) may be due to instabilities of this disk.
It has been suggested that the evolutionary state of the close binary V1341 X-2 makes it a blue straggler [12]. It was adopted in [12] that , and the UV excess was , [17]; Lyuty and Syunyaev [17] also note rapid chaotic brightness variations observed in the band in the range . Data on variations of the spectrum within A5–F2 were presented in [12]. These spectral variations occur with the orbital phase, explained as a result of heating of the optical star’s surface by X-rays from its companion. The periodic components in the light curve of the close binary could be due to the ellipsoidal shape of the optical star (as for the close binary V1357 X–1), the reflection effect, or the heating of part of the optical star’s surface by X–rays from the companion, eclipses (as in the case of V1343 433), or a combination of several of these effects (as for HZ X-1, where both the reflection effect and eclipses are present). In this study, we have used refined values for the mass of the neutron star and the radius of the Keplerian orbit, as well as new estimates of the distance to Cyg X-2 in the relativistic precession model [18], corresponding to the different states of neutron stars according to [19]. Taking into account these serious corrections and the analysis of our many-year photometry, we have good reasons to believe that Cyg X–2 is not a blue straggler.
We present here our long-term, multicolor optical observations of the binary V1341 X–2.
2 OBSERVING TECHNIQUES
Our photoelectric observations of V1341 X–2 were performed in the system. The observations comprise a total of 2375 individual measurements on 478 nights during 1986–1992.
The ultraviolet filter ( Å, 520 Å) is a revised version of the standard filter [20].
Detecting periodicity in the variable’s brightness variations encounters certain difficulties because of the presence of a large-amplitude irregular component in the brightness changes of Cyg X-2.
We monitored the object during a long time interval on each observing night, obtaining observations from near the meridian to an elevation corresponding to an air mass of .
The studies [21, 22] were initially aimed at compiling all the observations taking into account correction coefficients, the response curves of the detecting equipment (reflector photometer), and systematic deviations between long uniform series of observations for each season. The uncertainty in the collected observations varies in the range on different observing nights. There is substantial scatter in the and bands. The scatter in the and bands is somewhat smaller (the F star is quiescent).
Analysis of the light curves for the close binary V 1341 X-2 requires long series of high-quality uniform photoelectric observations in the bands [10, 12, 17, 21], and their comparison to X–ray observations from the same epochs [23, 24].
| Observing season | |||||
|---|---|---|---|---|---|
| July–September 1986, 1987, 1988 | 0.997 | 0.929 | 1.068 | 27 | |
| (AZT-14 reflector (480 mm); Tien Shan | 0.009 | 0.005 | 0.008 | ||
| High-Altitude Observatory, SAI) | |||||
| August–October 1986, 1987, 1988, | 0.013 | 0.962 | 1.102 | 1.088 | 38 |
| 1989, 1990, 1992 (Zeiss-600 reflector; | 0.003 | 0.005 | 0.003 | 0.004 | |
| Crimean Laboratory, SAI) | |||||
| July–September 1986, 1987, 1988, 1990, 1992, | 0.012 | 0.958 | 0.937 | 1.065 | 41 |
| 1994 (Zeiss-600 reflector; Mt. Maidanak | 0.003 | 0.004 | 0.007 | 0.007 | |
| High-Altitude Observatory, SAI) |
The shortest signal integration time during measurements of the binary’s brightness in the , , , and bands was about 60–90 s (for studies of rapid variations). When measuring the comparison stars, the check star, and the sky background, we integrated the signal for about 60–120 s.
During each observing season, we also measured the transformation coefficients between our instrumental photometric system and the system, as it was done in [25]. We determine these using the best photometric nights. We then averaged the coefficients within one observing season and used the mean values to calculate the zero points for each night of the season. The resulting mean values and their uncertainties are collected in Table 1, where denotes the number of nights used to derive them. The same detecting equipment was always used with the Zeiss–600 and AZT–14 reflectors.
To get a richer series of observations for the variable, we observed the comparison star and the sky background each 30–40 minutes, interpolating to the time of observation of the variable star. The particular instrumental system for the observations presented here differs only insignificantly from the standard photometric system, so that the relations between them can be represented with the linear equations
where the transformation coefficients and are unknown.
The light detector was an FEU-79 photomultiplier (with an S-20 multi-alkaline photocathode). We calculated the and transformation coefficients anew each time the photomultiplier was replaced.
It is difficult to specify a standard spectral energy distribution for peculiar stars like V1341 Cyg = Cyg X-2. In such cases, the iterative technique for correcting for atmospheric extinction in fundamental multicolor photometric observations suggested in [26] can be used to reduce broadband measurements to their values outside the atmosphere with uncertainties not exceeding in the band or in the other (, , ) bands for telescopes with a 1000 mm aperture and for air masses up to in the case of high-altitude observatories ( m).
We found the reduction coefficients to the standard photometric system from repeated measurements of standard stars in the SA 107, 108, 111–113 areas [27]. We reduced the comparison and check stars for our close binary to the catalog based on their magnitudes [28] (Table 2). The uncertainties in this reduction were within for the and bands and for the and bands.
3 METHOD USED TO REDUCE THE V1341 Cyg Cyg X-2 SYSTEM TO THE ALMA-ATA CATALOG OF BRIGHT NORTHERN STARS
During all the observing seasons, we performed photoelectric photometry of the binary V1341 Cyg Cyg X-2 in the instrumental photometric system. We had access to the magnitudes of the variable V1341 Cyg measured by other observers only in the bands (for instance, [10, 17]). We encountered certain difficulties during our data reductions related to the transformation of the instrumental system to the Johnson photometric system.
We attempted to reduce our variable close binary to the uniform, high-accuracy photometric catalog using magnitudes from the 2MASS catalog. This requires uniform, high-accuracy local photometric standards from the “ Catalog of Bright Stars of the Northern Sky” (further called the catalog) [29].
We have sufficiently accurate and magnitudes for the variable star, check star, and comparison star from published data. The magnitudes for these stars were taken from the 2MASS catalog.
Let us apply an empirical formula relating the magnitudes in one photometric system to the magnitudes and color indices in the other. Obviously, we need at least one color index for this purpose [30].
We will use several color indices [31, 32], enabling our transformation formulas for the magnitudes to be more precise. In the first stage, we adopt transformation equations from the , , , magnitudes to the magnitudes in other bands in the form of a second-order polynomial in plus a complete cubic polynomial in the three color indices:
mB-mA=a0.V + .(W-B,B-V,V-R),
where A and B are the two catalogs used to select the stars in common for the comparison. We derived this third–order polynomial via a least-square fit.
We obtained the following quantities:
m= mA+f1 .(CI,CI,CI,…),
(where CI are various color indices in the A catalog and is a polynomial of various powers of the color indices, with cross-terms taken into account),
mB= mB-m;
m= m
If
mB¿4 .
for some stars, we excluded these stars from the comparison and again derived the above transformation relation.
The next stage of our calculations is to find the non-linearity equation, which we solve via a least–squares fit:
mB-mA-f1
.(CI,CI,CI,…)=f2
.,m,…).
Finally,
m= mA+f1 .(CI,CI,CI,…)+f2 .,m,…)+f3 .(,).
where , are equatorial coordinates.
The magnitudes for the comparison and check stars, which have similar spectral types, were taken from the Alma–Ata catalog. The observed , , , and values for V1341 Cyg are the differences between the magnitudes of the comparison star and the variable (differential photometry). The uncertainties in the calculated magnitudes of the variable star for the and bands were and , respectively. In these calculations, it is also necessary to take into account systematic errors of the catalogs, which depend, among other factors, on the celestial coordinates of the program stars.
4 OBSERVATIONS
In the results of the observations presented here, each data point on the light curve represents an average of 2–16 individual measurements. For our observations with the Zeiss-600 telescope, the rms errors of a single measurement during times of maximum brightness estimated from the pulse statistics correcting for the background were for , for , for , and for .
We reduced the observations according to a differential scheme. The photometric elements were taken from [10, 33]:
To = 2443161.7 + 9d.8431.E
where is the time of the periastron passage.
| JD2400000+. | n | ||||||
| 1 | 46615.3830 | 0.873 | 15.075 | 15.125 | 14.667 | 14.328 | 06 |
| 2 | 46616.4574 | 0.983 | 15.144 | 15.314 | 14.946 | 14.660 | 08 |
| 3 | 46618.4099 | 0.181 | 14.855 | 15.306 | 14.779 | 14.585 | 06 |
5 REFINED ORBITAL PERIOD
An analysis of the (O–C) data for the seven-year time interval covered by our observations (plus the earlier published data for the past ten years) demonstrates that the primary minimum occurs at phase 0.0 and that the refined orbital period coincides with the earlier value, , within the (), indicating, in turn, that the brightness-variation elements are in agreement with our observations and need no correction. These calculations were done using the code developed by V.P. Goranskii (the WINEF1 software package) and kindly made available to the author for the mathematical reduction of these observations.
6 OBSERVATIONAL DATABASE
The results of our optical observations of the close binary V1341 X-2 are collected in an electronic database available at the address http://lnfm1.sai.msu.ru/sazonov/ Cyg X-2. Table 3 presents a small part of this database to illustrate its structure. The columns of Table 3 contain the (1) heliocentric Julian dates of the observations, (2) orbital phases, , (3)–(6) , , , and magnitudes, and (7) number of individual measurements .
7 OBSERVATION RESULTS
AND THEIR INTERPRETATION
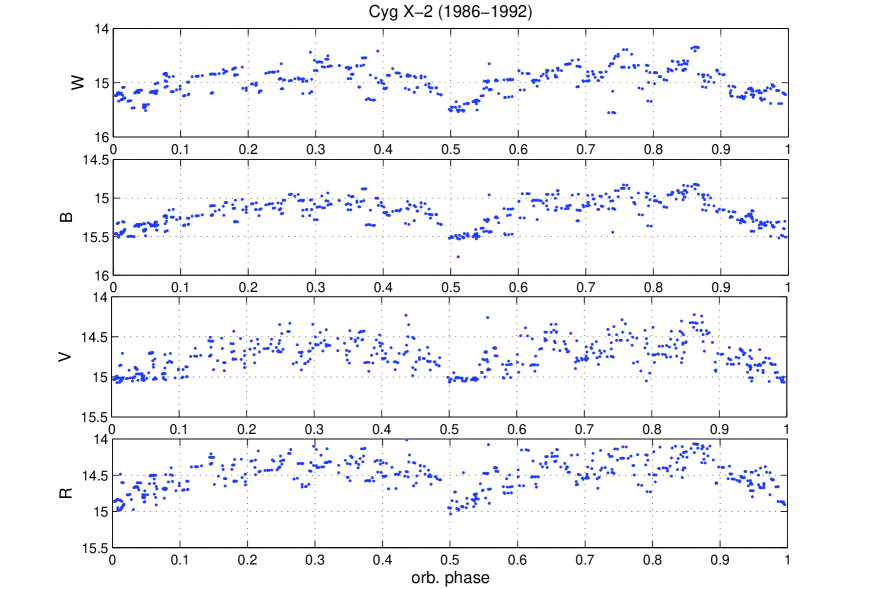
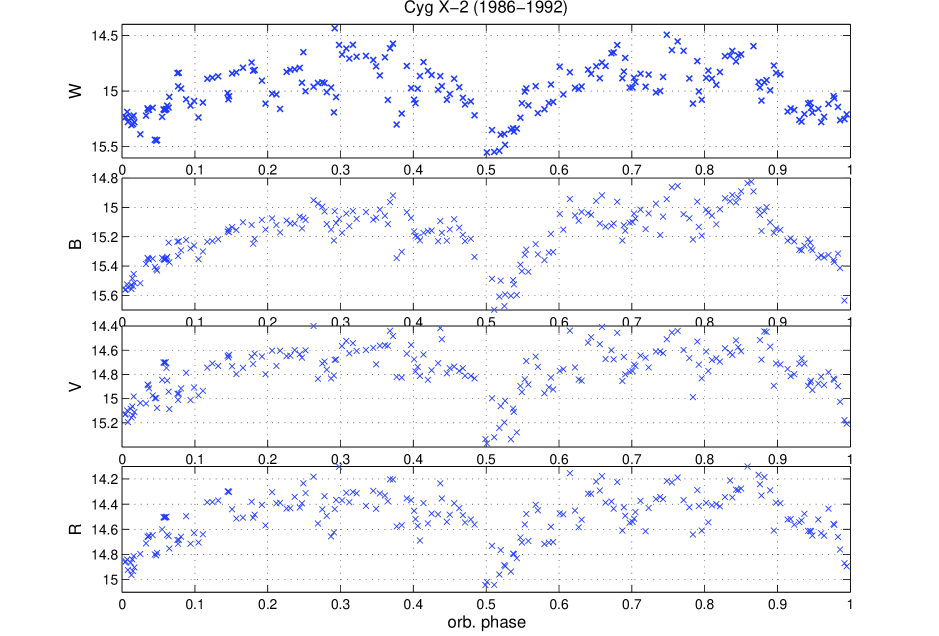
The combined results of our studies of the object in 1986–1992 in the bands are shown in Fig. 1; these consist of 2375 individual measurements on 478 nights.
The optical light curves of the binary in its active and quiescent states differ considerably ”— among other features, in an additional contribution to the brightness from the accretion disk during active or intermediate states of the system. This can be noted from the maximum brightness amplitude near Min II (Fig. 1). The regular, cyclic, small-amplitude flares lasting several days are probably due to interactions of gas flows in the binary that originate from the companion with the outer parts of the accretion disk around the compact relativistic object, as well as to accretion instabilities.
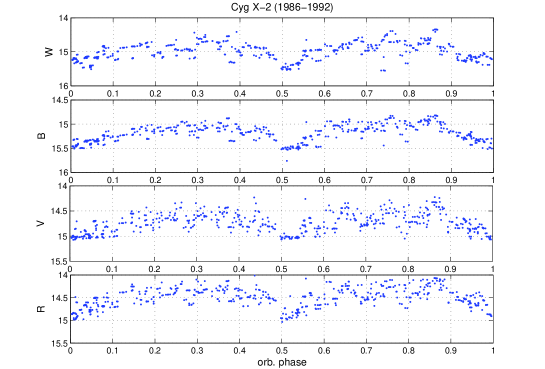
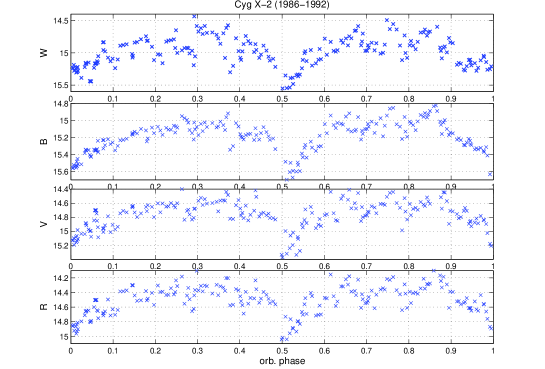
Figure 2 shows the photoelectric light curves of V1341 Cyg averaged in orbital-phase bins with widths of 0.025.
The second type of activity in the system is rapid flares with durations of less than one day; it is natural to relate these to processes in the X-ray source (we observe oscillations rather that the flickering that is characteristic of dwarf novae).
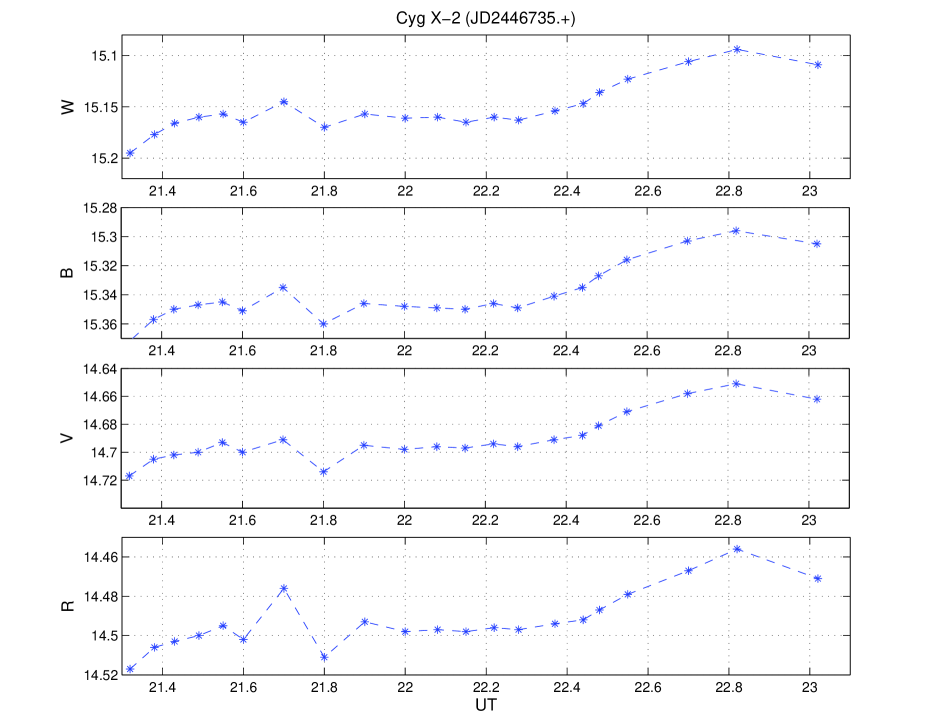
Figure 3 displays a typical example of a rapid flare of the second type, observed for 60 minutes on JD 2446735, when the brightness increased by in , in and , and in . The brightness deviations from the mean are within .
8 REGULAR, ORBITAL BRIGHTNESS VARIATIONS
On average, the amplitude of the regular, orbital brightness variations of the close binary is within in the band, in , in , and in .
It follows from our observations that the variable V1341 Cyg continuously exhibits chaotic variations of its brightness in the ranges (Fig. 1):
in ;
in ;
in ;
in .
The close binary also exhibits optical flares observed over hours with amplitudes in the ranges:
in ;
in ;
in ;
in .
Such flares of the second type were recorded, for instance, on JD 2446619 and JD 2447370.
The scatter of our individual data points around the mean light curve has amplitudes of in , in , in , and in . The amount of scatter depends on the orbital phase. This is especially evident for the -band observation, indicating that ellipsoidal variations are most pronounced in the low, quiescent state of the close binary.
We can see from the observed light curves that the width of the primary minimum (orbital phase 0.5) in the , , , and bands varies approximately between 0.05 and 0.06.
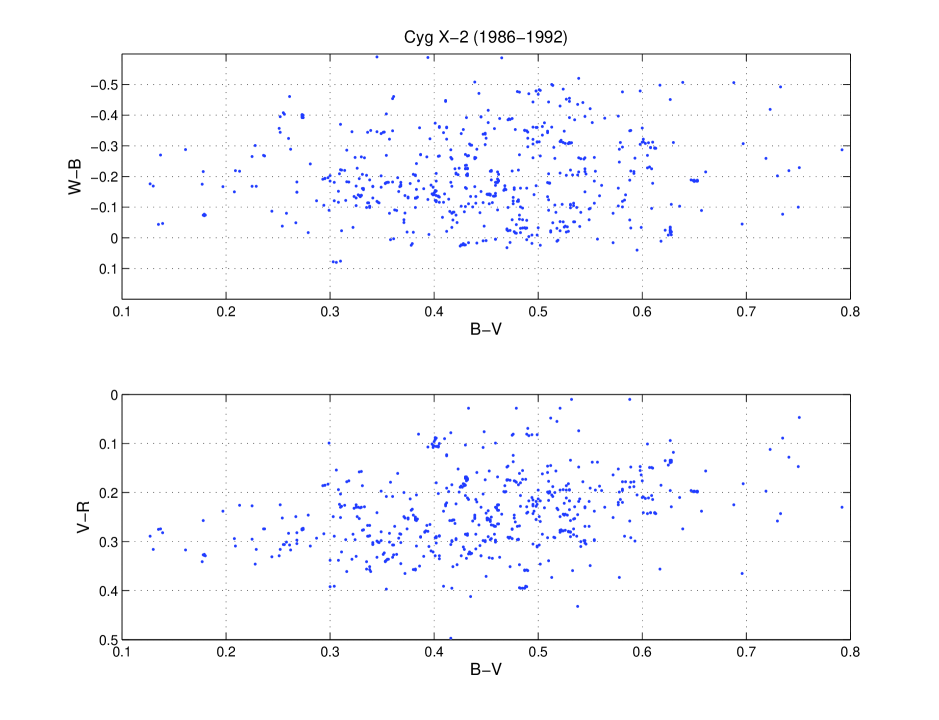
9 ORBITAL VARIATIONS OF THE COLOR INDICES
We find in our analysis of the ellipsoidal light curves of V1341 Cyg in quiescence in all four bands () that broader, less sharp minima are characteristic of orbital phases near (the upper conjunction of the F star, with the binary’s relativistic component in front of it), as compared to phases near (the lower conjunction of the binary, with the normal component in front, characterized by narrower and sharper minima). This pattern was observed in 1986, 1988, and 1991. It is probably due to the considerable eccentricity of the close binary’s orbit.
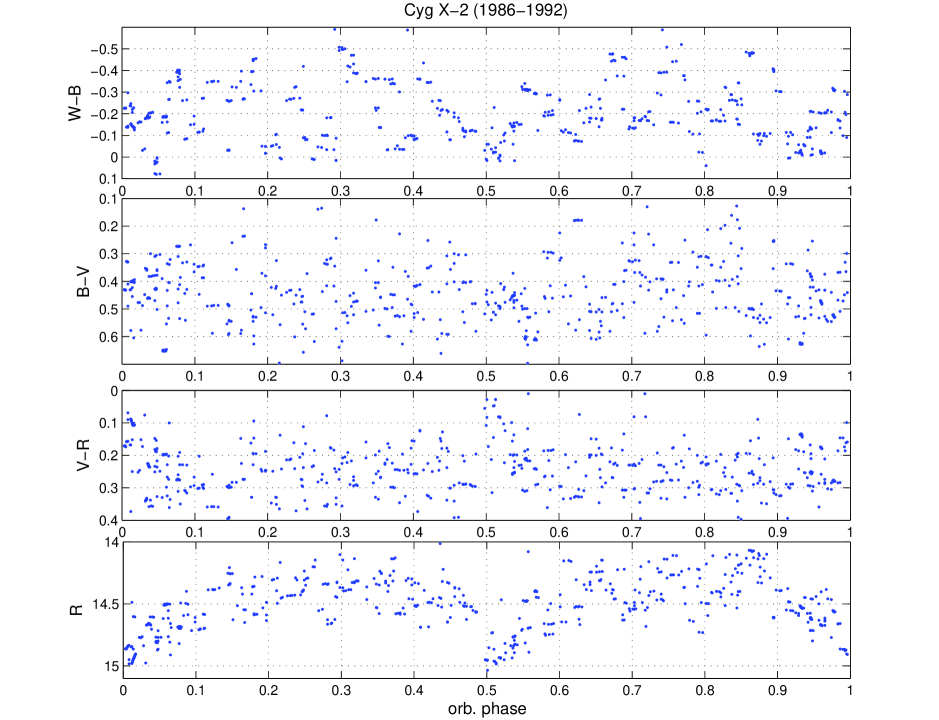
Our observations confirm the earlier findings of other studies of a clear functional dependence of (in our case, ) on the deviation from the quiescent ellipsoidal curve, with only a weak dependence observed for : both color indices decrease with increasing . A similar relation is observed for the color indices and brightnesses plotted as functions of the orbital phase (Fig. 4).
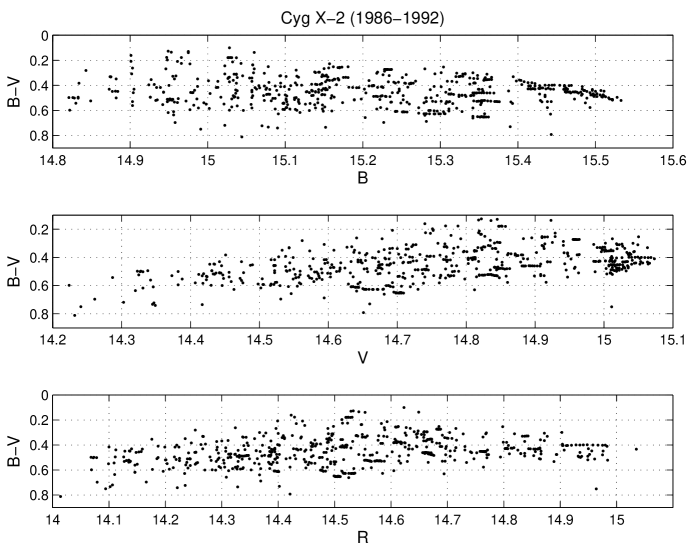
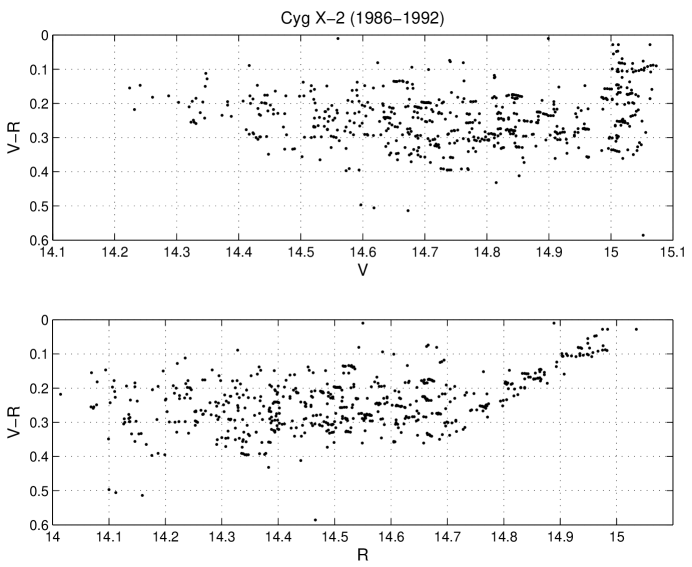
The object becomes redder when it fades in the band, as is visible in the diagram in Fig. 5.
No significant variations of the object’s position were detected in the other color–magnitude diagrams, namely , , , and .
Considerable variations of the , , , and magnitudes with (Fig. 1) and of the and color indices with (Fig. 6) were detected for each of the observing seasons; these are probably due to heating of the F-star’s surface facing the X-ray source (the reflection effect). This effect is manifest as a wave in the color-index diagrams near the primary minimum (the zero orbital phase of the binary). Exceptions occur for the color index in very low states of the object, when the mean brightness of the star becomes about below the mean level of the quiescent light curve for the system.
10 MEAN LIGHT CURVES
FOR THE SYSTEM IN QUIESCENCE
We used the photographic observations with an orbital-phase increment of 0.025 from Table 2 of [12] as a basis for constructing the mean light curve of V1341 Cyg in quiescence. The mean uncertainty of the magnitudes in these orbital-phase bins is . We then selected -band photoelectric observations from among our data that deviated from the mean photographic curve (first translated to an intensity scale, as was done in [12]) by no more than .
The observations in the , , and bands corresponding to the times of the -band observations were properly synchronized. As a result of this averaging, selection of photoelectric data points, and synchronization of the points in the other bands, we obtained the mean light curves for the binary displayed in Fig. 2.
Note that the average dependences of , , and on (Fig. 4) do not show any significant variations due to heating of the side of the binary’s optical component facing the X-ray source (the reflection effect), which could lead to the presence of a wave in the color indices with a minimum near zero phase. The color index does not vary within the errors (Fig. 4).
The dependence of on shows a double wave at the orbital period and an amplitude of . The lowest values of this color index are observed at conjunctions. The same pattern is detected for the original individual observational data points.
Variations of the lower level (the lower envelope of the light curve) in the scatter of the individual points in the light curve are clearly visible. The upper envelope of the light curve for the individual data points depends on the orbital phase. At the upper level of the scatter of the individual points in the band (and, partially, in the band), we can see a clear wave with the orbital period of the binary. The maximum of the wave is at orbital phase 0.85 (Fig. 1). Note that the wave with the orbital period during the system’s active state has no functional relationship to the reflection effect or the appearance of a hot spot on the accretion disk around the relativistic object.
Figure 7 displays the behavior of V1341 Cyg in its quiet and active phases. We also performed similar analyses of the system’s behavior using the technique of Goransky and Lyuty [12], who also calculated the deviations from the ellipsoidal curve, with the subsequent subtraction of the light curve drawn through the distribution maximum of the individual data points from the entire set of observations. We obtained approximately the same result.
11 RAPID VARIATIONS
We also studied rapid variations of the star on time scales s in the bands during its brightness maxima and minima, during two hours of observations (Fig. 3).
The flickering exhibited by the system has a very low amplitude, and is suppressed by the presence of the bright, F-giant secondary component.
Our analysis of rapid variations indicated the presence of brightness variations from the mean within on time scales of 30 s. At those times, the optical component was at its brightness maximum, namely:
1. JD 2447677; , , , at (the 1989 observing season).
2. JD 2448810; , , , at (the 1992 observing season).
Here, the observer sees both components of the close binary in the plane of the sky. Since the time scale is so short (exposure times of 30–40 s in the and bands), we observe chaotic variations with amplitudes up to . It is clear that such rapid variations testify to the presence of a small radiating region, cm in size (for any choice of model for the close binary).
Our comparative analysis of the data in the , , , and bands (Fig. 1) shows that the amplitude of the rapid variations is very strongly dependent on wavelength, and increases with decreasing wavelength, with the variations being largest and sometimes reaching (Fig. 3). These rapid variations can give rise to large scatter in the individual data points for the dependences of on and of on .
It is natural to attribute the rapid variations of the binary to considerable variability of the X-ray flux that heats the outer regions of the accretion disk and a hot spot at the surface of the optical component.
The total amplitude of the system’s irregular brightness variations varies from in the band to in the band. During the maximum brightness, we observed chaotic variations with amplitudes from 0.085m to 0.190m, with the rms uncertainty in the mean brightness being in the band. At epochs of maximum brightness, the amplitude of rapid variations on time scales of 60–90 s was .
The rms uncertainty in the mean in the and bands was at maximum and at minimum brightness (for observations with telescope apertures of at least 1000 mm). The strong scatter in the individual observational data points is most likely due to the presence of rapid brightness fluctuations during a single exposure; the typical duration of the exposures was 8–10 minutes.
Thus, the total amplitudes of the binary’s rapid brightness variations were approximately , , , and .
12 COMPARISON OF THE OPTICAL OBSERVATIONS WITH THE X–RAY DATA FROM THE EXOSAT AND Ginga OBSERVATORIES
X-ray data obtained for the low-mass binary Cyg X-2 in 1987–1991 with the EXOSAT and Ginga observatories were analyzed in [24]. The three sectins, or branches, of the Z-shaped tracks were studied in detail: the horizontal branch (HB), normal branch (NB), and flaring branch (FB) (upper, middle, and lower parts of the diagram, respectively).
Notes that the system exhibited three states in the optical: quiescence, the flaring state, and the active state, which is intermediate between the first two states. The binary spends up to several days in the intermediate state [21, 22]. Optical observations indicate that the system stays in the intermediate state for two to days. The time interval for the binary’s intermediate state varies only slightly from one observing season to another. A small amoung of rapid variability with an amplitude of is also observed in quiescent state of the system.
The position along the Z-shaped track between the HB and FB is related to variations in the rate at which matter is accreted onto the neutron star [4, 5], which are manifest in many photometric features in the optical. For example, the observed oscillations in the system can be explained by motions of gas flows at high velocities in a strong gravitational field, which give rise to oscillations reaching several percent of the total brightness from the system [34].
It is noteworthy in studies of rapid variations in the system that the quasi-periodic oscillations observed in the X-ray could also make a considerable contribution to the optical light curves (Figs. 1, 2).
X-ray observations for time intervals when the close binary was in its high or intermediate states (June 1987, June and October 1988, November 1990, May–June 1991) are presented in [24]. The existence of two states of the system — the high state and intermediate state (for a short time) — also follows from our optical observations, in particular, those covering the time intervals in question. A comparative analysis of the X-ray observations for these time intervals was presented in [7].
There is a weak correlation between the optical and X-ray observations, with the correlation coefficient being . This follows from an analysis of our optical observations and published optical and X-ray data.
13 BRIGHTNESS DEPENDENCE OF COLOR INDICES
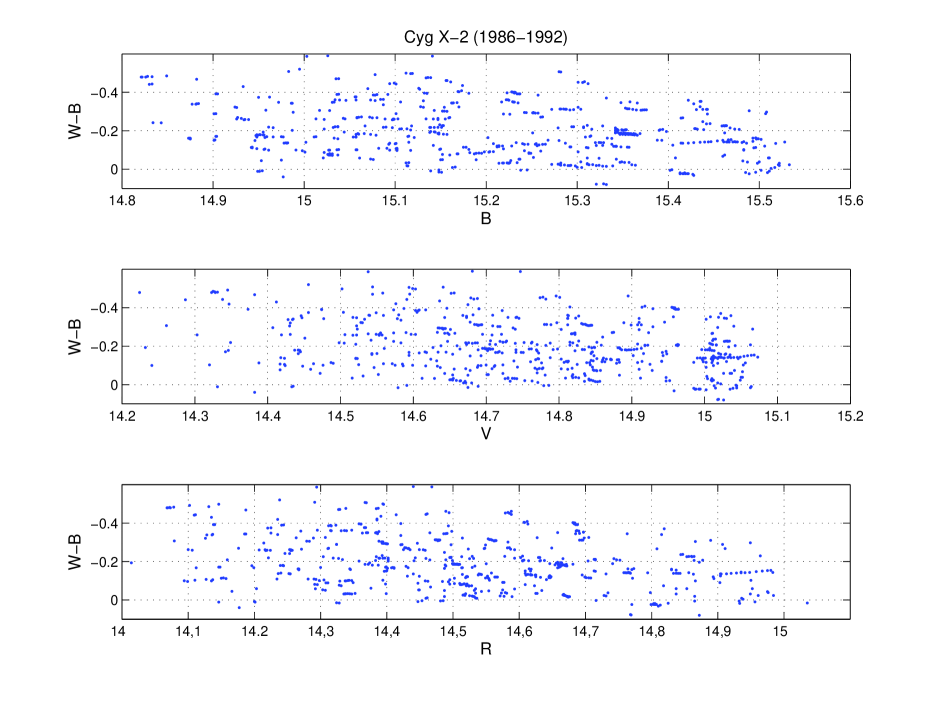
Analyzing the binary’s optical light curves for all the years of our observations, we find firm evidence for a clear dependence of the , , and color indices on the brightnesses in the , , and bands (Fig. 5). All the panels of Fig. 5 display rapid variations during this time, which could lead to the observed strong scatter of the data points in the light curves and color–magnitude diagrams (especially those relating to ).
The amplitude of the variations is about . The orbital variations of the maximum brightness, with amplitudes of , , , and and clear brightness minima at the two conjunctions, is clearly visble in all the bands.
The brightness minimum near phase is narrower: as spectroscopic data show, the F star passes through the periastron of its orbit near the upper conjunction, and the time it spends at these phases is small due to the eccentricity of the binary’s orbit.
Another feature of the system is also noteworthy: we observe a slight UV excess at both conjunctions of the close binary’s components, in both the quiescent and active phases. The color index demonstrates no functional dependence on the phase.
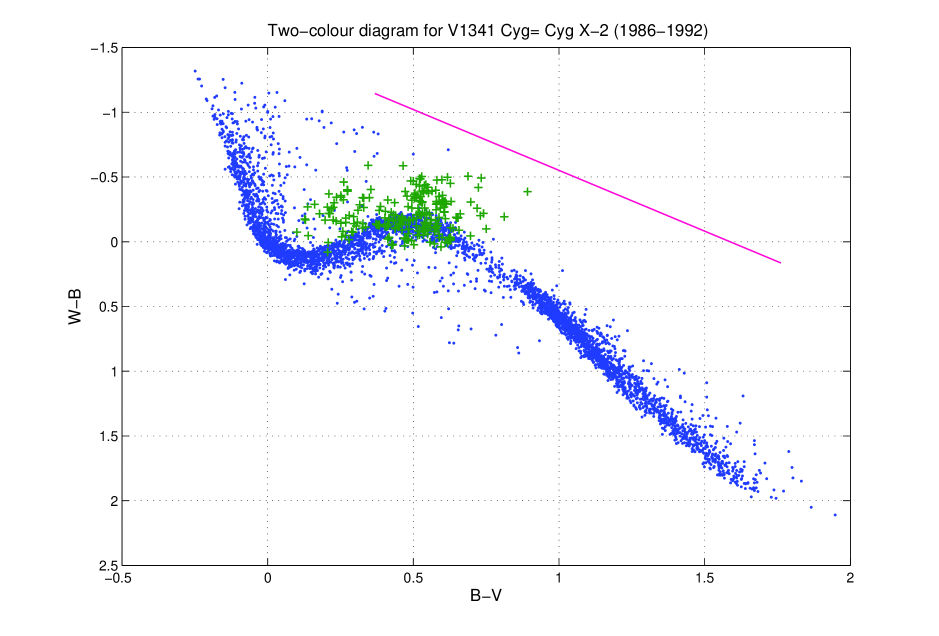
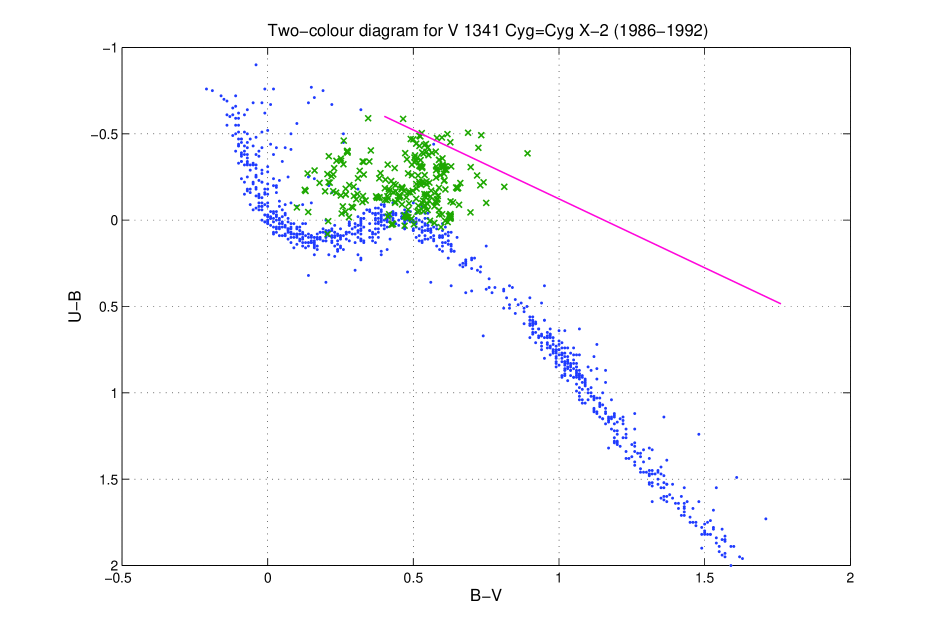
14 EVOLUTIONARY STATUS AND THE POSITION OF V1341 X-2 IN THE TWO-COLOR DIAGRAM
Qualitative estimates of the position and evolutionary status of the system using the – diagram (Fig. 6) must take into account the fact that most of the UV luminosity of V1341 Cyg is probably due to re-radiated X-ray flux [10, 17]. Thus, X-ray variations should give rise to optical variations on the same time scales. This follows from a comparison of available X-ray data and the optical data we have obtained over seven years.
In the re-radiation model, the soft component of the X-ray flux is mainly re-radiated as optical photons and the X-ray radiation is not isotropic. This also follows from several observational results [10] used for our analysis.
Additional evidence supporting the re-radiation model is that the radius of the re-radiating region adopted in our study, cm (the accretion disk the optical component) [35], is close to the size of the binary itself (the component separation is cm).
The nightly-average color indices from our observations (corrected for the adopted interstellar reddening, [36]) can be taken from Figs. 2, 6.
Note that, in its very lowest state, the optical component of V1341 Cyg lies on the sequence of stars with normal metallicity, and is located on the red part of the horizontal branch (Fig. 8).
The main features we would like to emphasize here (and which are important for the entire study) are the following.
1. A very important conclusion drawn in [5], which considerably altered earlier distance estimates for Cyg X-2 based on optical observations (and used in [12]) should be noted: the data in [10] differ by from those in [5] (for example, the distance given is ).
2. The optical component of the close binary V1341 X-2 is (for the adopted ) near the main-sequence turn-off point for globular-cluster stars in the evolutionary two-color diagram, and so is a dwarf or a star near the turn-off to the red-giant branch (Fig. 8).
Taking into account these two features in the interpretation of our seven-year optical observations and using the conclusions of [5] and [12] when analyzing the color indices and comparing the optical and X-ray data, we come into contradiction with the suggestion that the primary component of the binary is a blue straggler.
15 CONTRIBUTION FROM THE ACCRETION DISK
AND ACCRETION
STRUCTURES
TO THE COMBINED LIGHT OF THE BINARY
To qualitatively estimate the contribution of the binary’s accretion disk to the total brightness, we used quantitative data on the position of the object in the two-color diagram during different states of the system (Fig. 8a). Near the primary minimum, Min I, we observe rapid chaotic variations in the band, with amplitudes between 0.085m and 0.190m, with uncertainties of (JD 2447414, JD 2447444).
The primary minimum, Min I, was observed (on average) near orbital phase . During the 1986–1987 observations, Min I was observed near orbital phase . This “floating” of Min I () was detected in our observations between 1986 and 1992.
The binary’s rapid, irregular variations are probably due to variations in the X-ray flux heating the outer parts of the accretion disk and the hot spot on the optical component, as well as variations in the conditions for the matter flow from the optical component through the inner Lagrange point, L1. Contrary to expectations, the earlier simultaneous observations of [23] were not able to detect correlations between variations of the X-ray and optical fluxes [37, 38].
As was noted above, there is some flaring in the UV near orbital phases and (Fig. 1), even when the system is in quiescence. This high-temperature flaring (it is not as prominent in the and bands!) can probably be interpreted in the transition-layer model of [5].
This model considers the motion of a matter clump that is a source of quasi-periodic oscillations (in this case, a “blob” of high-temperature plasma) on the accretion-disk surface, along a Keplerian orbit around the neutron star. Let us assume that the magnetosphere axis and the normal to the accretion-disk surface do not coincide, forming a small angle . Repeatedly passing the slightly oblique magnetosphere, the blob is also influenced by Coriolis forces that contribute to the disruptionn of the plasma clump.
The contribution of the accretion disk to the combined brightness of the binary varies from close to (quiescence) to (the active state).
16 CONCLUSIONS
We have obtained a long-term, uniform set of observations in the , , , and bands, monitoring as long as possible on each observing night. We have used this dataset to distinguish fine photometric effects for the close binary V1341 X-2.
The optical light curves of V1341 X-2 in quiescence during our 1986–1992 observations are in qualitative agreement with the light curves of other studies.
Our observations indicate that the amplitude of the -band ellipsoidal brightness variations during the system’s quiescence is within [21]. For comparison, the amplitude of the ellipsoidal variations from the data of [12] was .
The depths of the minima in the and bands are the same within the errors, 0.3m. The -band minima are deeper by , while those in the band are shallower by .
The close binary V1341 X-2 exhibits both chaotic variations and short-term optical flares, which are probably due to activity of the X-ray source and gas flows in the system.
Simultaneous observations of V1341 X-2 in the X-ray and optical prior to 1987 did not indicate any correlations between brightness variations in the optical and X-ray [39], while such correlations episodically appeared between 1987 and 1991 [7].
Instabilities in the disk accretion or the outer structures in the accretion disk can give rise to changes in the flux gradients in the X-ray and optical, and so an absence of correlations between the optical and X-ray brightness variations. Like the observations of other studies, our observations for the 1986 and 1992 observing seasons partially support this possibility.
Observations of the variable with integration times of 60–90 s (in each band) indicate rapid, irregular brightness variations with amplitudes in the UV and somewhat lower in the other bands.
The system demonstrates the largest-amplitude variations () in the UV in its active stage (the 1987 and 1989 observing seasons); at that time, the brightness varied between and .
The light curves for the 1986–1992 observing seasons (at certain epochs) reveal a narrow minimum of the binary light curve near the phase of the lower conjunction (), in both quiescence and the active state. This somewhat exceeds the primary minimum in its amplitude (Fig. 1).
We confirm the presence of rapid, irregular variations on timescales of about 60–90 s, with the -band amplitude from to and uncertainties . The variations in the other bands are between and , with uncertainties of (for telescope apertures of 1000 mm or more).
Our comparative analysis of our data demonstrates that the amplitudes of the rapid variations strongly depend on the wavelength: they grow with decreasing wavelength and are largest in the band. These rapid, irregular variations are probably due to changes in the X-ray flux heating the outer layers of the accretion disk and the hot spot on the optical component, as well as to conditions for the matter flow from the optical component through the inner Lagrange point L1.
A considerable contribution to the total UV light leaving the system also comes from plasma clumps (“blobs”) whose presence is manifest at optical phases and 0.8. The brightnesses of such luminous plasma clumps are from to , with uncertainties of in the and bands, respectively.
References
- [1]
- [2] R. Giacconi, P. Gorenstein, H. Gursky, et al., Astrophys. J. 148, L129 (1967).
- [3] G. Hasinger and M. Van der Klis, Astron. Astrophys. 225, 79 (1989).
- [4] F. K. Lamb, in Neutron Stars: Theory and Observations, Ed. by J. Ventura and D. Pines, NATO ASI Ser. C, v. 344 (Dordrecht: Kluwer, 1991), p. 445.
- [5] S. I. Kuznetsov, Pis’ma Astron. Zh. 27, 919 (2001) Astron. Lett. 27, 790 (2001).
- [6] S. I. Kuznetsov, Pis’ma Astron. Zh. 28, 88 (2002) Astron. Lett. 28, 73 (2002).
- [7] E. Kuulkers and M. van der Klis, Astron. Astrophys. 314, 567 (1996).
- [8] E. Kuulkers, M. van der Klis, and B. A. Vaughan, Astron. Astrophys. 311, 197 (1996).
- [9] E. Kuulkers, M. van der Klis, T. Oosterbroek, et al., Astron. Astrophys. 289, 795 (1994).
- [10] E. Kuulkers, M. van der Klis, T. Oosterbroek, et al., Mon. Not. R. Astron. Soc. 287, 495 (1997).
- [11] A. P. Cowley, D. Crampton, and J. B. Hutchings, Astrophys. J. 231, 539 (1979).
- [12] D. Crampton and A. P. Cowley, Publ. Astron. Soc. Pacif. 92, 147 (1980).
- [13] V. P. Goransky and V. M. Lyuty, Astron. Zh. 65, 385 (1988) [Sov. Astron. 32, 193 (1988)].
- [14] S. D. Vrtilek, S. M. Kahn, L. E. Grindlay, et al., Astrophys. J. 307, 698 (1986).
- [15] S. D. Vrtilek, J. H. Swank, R. L. Kelly, and S. M. Kahn, Astrophys. J. 329, 276 (1988).
- [16] G. Hasinger, in Physics of Neutron Stars and Black Holes, Ed. by Y. Tanaka (Universal Acad., Tokyo, 1988), p. 97.
- [17] G. Hasinger, M. van der Klis, K. Ebisawa, et al., Astron. Astrophys. 235, 131 (1990)
- [18] V. M. Lyuty and R. A. Syunyaev, Astron. Zh. 53, 511 (1976) [Sov. Astron. 20, 290 (1976)].
- [19] A. Smale, Astrophys. J. 498, L141 (1998).
- [20] M. C. Miller, F. K. Lamb, and D. Psaltis, Astrophys. J. 508, 791 (1998).
- [21] V. L. Straizys, Multicolor Stellar Photometry (Mosklas, Vil’nyus, 1977; Pachart Publ., Tucson, 1992).
- [22] A. N. Sazonov, Astron. tsirk. 1531, 15 (1988).
- [23] A. N. Sazonov, in Proc. of the All-Russ. Astron. Conf. on Close Binary Stars in Modern Astrophysics, Moscow, Sternberg Astron. Inst., 22–24 May, 2006 (GAISh, Moscow, 2006), p. 39.
- [24] S. A. Ilovaisky, C. Chevalier, M. Chevreton, and S. Bonazzola, Astron. Astrophys. 67, 287 (1978).
- [25] R. A. D. Wijnands, M. van der Klis, E. Kuulkers, et al., Astron. Astrophys. 323, 399 (1997).
- [26] L. N. Berdnikov, Perem. zvezdy 22, 369 (1986).
- [27] V. G. Moshkalev and Kh. F. Khaliullin, Astron. Zh. 62, 393 (1985) [Sov. Astron. 29, 227 (1985)].
- [28] T. J. Moffett and G. T. Barnes, Astron. J. 84, 627 (1979).
- [29] A. I. Zakharov and A. V. Mironov, private commun. (2006).
- [30] V. G. Kornilov, I. M. Volkov, A. I. Zakharov et al., Tr. Gos. Astron. In-ta 63, 1 (1991).
- [31] P. Harmanec, Astron. Astrophys. 335, 173 (1998).
- [32] A. V. Mironov and A. I. Zakharov, Astrophys. Spase Sci. 280, 71 (2002).
- [33] A. V. Zakharov, A. V. Mironov, and A. N. Krutyakov, Tr. Gos. Astron. Inst. 70, 289 (2004).
- [34] D. Crampton and A. P. Cowley, IAU Circ. No. 3292 (1978).
- [35] G. Hasinger, in The Origin and Evolution of Neutron stars, Ed. by D. J. Helfand and Z. Huang, IAU Symp. 125, 333 (1987).
- [36] G. M. Beskin, S. I. Neizvestnyi, A. A. Pimonov, et al., Pis’ma Astron. Zh. 5, 271 (1979) [Sov. Astron. Lett. 5, 144 (1979)].
- [37] L. R. Cathey and J. E. Hayes, Astrophys. J. 151, L89 (1976).
- [38] G. Branduardi-Raymont, L. Chiapetti, E. N. Ercan, Astron. Astrophys. 130, 175 (1984).
- [39] G. Hasinger, A. Langmeier, M. Sztajno, and N. White, IAU Circ. No. 4070, (1985).
- [40] S. A. Ilovaisky, C. Chevalier, C. Motch, and E. Janot-Pachrco, IAU Circ. No. 3325 (1979).