Molecular Gas Evolution across a Spiral Arm in M 51
Abstract
We present sensitive and high angular resolution CO(1–0) data obtained by the Combined Array for Research in Millimeter-wave Astronomy (CARMA) observations toward the nearby grand-design spiral galaxy M 51. The angular resolution of corresponds to 30 pc, which is similar to the typical size of Giant Molecular Clouds (GMCs), and the sensitivity is also high enough to detect typical GMCs. Within the field of view centered on a spiral arm, a number of GMC-scale structures are detected as clumps. However, only a few clumps are found to be associated with each Giant Molecular Association (GMA), and more than 90% of the total flux is resolved out in our data. Considering the high sensitivity and resolution of our data, these results indicate that GMAs are not mere confusion of GMCs but plausibly smooth structures. In addition, we have found that the most massive clumps are located downstream of the spiral arm, which suggests that they are at a later stage of molecular cloud evolution across the arm and plausibly are cores of GMAs. By comparing with H and Pa images, most of these cores are found to have nearby star forming regions. We thus propose an evolutionary scenario for the interstellar medium, in which smaller molecular clouds collide to form smooth GMAs at spiral arm regions and then star formation is triggered in the GMA cores. Our new CO data have revealed the internal structure of GMAs at GMC scales, finding the most massive substructures on the downstream side of the arm in close association with the brightest H II regions.
Subject headings:
galaxies: individual (M 51 or NGC 5194) – galaxies: spiral – ISM: clouds – ISM: molecules1. Introduction
As all the stars are formed from the interstellar medium (ISM), the evolution of physical and chemical conditions of ISM is an important clue to understand star formation, its history, and galaxy formation. Spiral galaxies have been studied often with this goal; they are actively forming stars in spiral arms and the sequence of the ISM evolution from molecular gas to young stars can be investigated across the arms. There have been many discussions on the nature of the spiral structure. Lin & Shu (1964) described it as a quasi-stationary structure sustained by density waves, while tidal waves due to interactions with a companion galaxy or shear motions in the galactic disk can also create transient spiral structures (e.g., Toomre & Toomre, 1972).
With its proximity, nearly face-on disk, and grand-design spiral structure, the Whirlpool galaxy, M 51 (catalog NGC 5194) or NGC 5194, has been a popular target for both observational and theoretical studies. Strong streaming motions found in the two spiral arms (Aalto et al., 1999; Shetty et al., 2007) indicate the existence of density waves in this galaxy, while it has been suggested that the spiral structure is not fully stable across time or radius (e.g., Meidt et al., 2008; Dobbs et al., 2010). An interaction with the companion galaxy, NGC 5195, has been thought to enhance or even trigger the prominent spiral structure in the disk of M 51. Molecular gas in this grand-design spiral galaxy traced by dust lanes and CO emission lines has been found upstream of star forming regions traced by H (e.g., Vogel et al., 1988; Rand & Kulkarni, 1990). Tilanus et al. (1988) found similar spatial displacement between non-thermal and thermal radio continuum; spiral arms seen in the non-thermal component are coincident with dust lanes while most of the thermal component peaks agree with H II regions. These offsets, also found in other spiral galaxies, are consistent with the density wave theory and represents the timescale for molecular clouds to form stars (e.g., Roberts, 1969). Variations of physical properties across the arms thus correspond to the evolution of the ISM in spiral galaxies. Egusa et al. (2009) utilized offsets between CO and H to derive a star formation timescale and pattern speed in nearby spiral galaxies.
Given that the typical width of spiral arms is about 500 pc, investigating the ISM evolution across the arms requires images with a high spatial resolution, which has been difficult especially for radio observations. Instead, comparison between arm and interarm regions has been used to diagnose how the spiral structure affects the ISM properties. From the 12CO(1–0) data covering the entire disk of M 51 taken with the Combined Array for Research in Millimeter-wave Astronomy (CARMA) and Nobeyama 45m telescope, Koda et al. (2009, hereafter K09) found that Giant Molecular Associations (GMAs; ; Vogel et al. 1988) are only in arm regions while Giant Molecular Clouds (GMCs; ; Solomon et al. 1979a) are in both arm and interarm regions. On the other hand, bright young stars delineate narrow spiral arms while older stars are distributed more smoothly over a galactic disk (e.g., Sandage, 1961). For M 51, Scoville et al. (2001) cataloged H II regions from a high-resolution H image taken with the Hubble Space Telescope (HST) and found that about half of them are confined to the arm region which occupies only quarter of the disk area. It is thus expected that GMAs play a critical role in massive star formation in the spiral arms.
However, the typical size of GMAs and H II regions are quite different; pc and pc, respectively. Thus, the key to understanding the initiation of massive OB star clusters is the internal structure of GMAs. K09 measured the surface density of GMAs to be similar to that of typical GMCs and suggested that GMAs are not simply overlapping of GMCs but are distinct structures where the entire volume is virtually filled with molecular gas. Nevertheless, the spatial resolution of their data ( pc) is not high enough to resolve GMAs. Since previous CO observations with high spatial resolution similar to the size of GMCs and H II regions have only been done for the central region of galaxies or for dwarf and flocculent spiral galaxies in the Local Group, the internal structure of GMAs in grand-design spiral galaxies has not been investigated before.
To resolve GMAs and detect GMC-scale structures ( pc) in spiral arms, we have carried out new CARMA observations in the CO lines toward M 51 with a very high angular resolution (). In this paper, we present results from our new CO observations and discuss the internal structure of GMAs and the relationship of the brightest substructures to the spiral structure and star forming regions. At the adopted distance of M 51 (8.4 Mpc; Feldmeier et al., 1997), corresponds to 41 pc.
2. Observations and Data Reduction
The CO(1–0) line observations were carried out at CARMA in November through December 2008. This array has six 10 m dishes and nine 6 m dishes and thus provides 105 baselines. The full width at half maximum (FWHM) of the primary beam is about and for the 10 m and 6 m dishes, respectively. The B-array configuration, whose typical angular resolution is at 3 mm, was selected to resolve GMAs and detect GMC-scale structures in M 51. A single pointing was centered on the brightest GMA in the K09 data located about from the galactic center in the south-west direction. The pointing center coordinate is (RA, DEC)=(13:29:50.16, +47:11:28.39) in J2000. We used the hybrid correlator mode (three 62 MHz bands for the source and three 500 MHz bands for the calibrator) in order to achieve high spectral resolution for the source and high sensitivity for the calibrator. Channel width for the source is 0.977 MHz or 2.54 km s-1 at the frequency of 115 GHz. The intermediate frequency (IF) was set to include the 12CO(1–0) line in the upper side band (USB) and 13CO(1–0) in the lower side band (LSB). Data were taken through the standard cal-source cycle with 5 minutes integration on the phase calibrator, 1153+495, which is 16 degrees away from the source, and 15 minutes on source. The passband observations were done at the beginning of each track with a brighter source, and the data were used to calibrate phase and amplitude offsets between narrow and wide bands as well as the normal passband calibration. The total observing time is about 34 hours with five tracks. In terms of the weather condition, the phase rms was –m and the opacity at 230 GHz was , which is typical for 3 mm observations with the B-array configuration.
Data reduction was done with the Multichannel Image Reconstruction, Image Analysis and Display software (MIRIAD; Sault et al., 1995). The flux of the phase calibrator was derived to be 0.81 Jy at 114.75 GHz (USB) and 0.74 Jy at 110.02 GHz (LSB) from the comparison with bright quasars whose flux had been derived from other observations with planets. The uncertainty in the flux calibration is estimated to be 15% ( Jy). The synthesized beam from the natural weighting is for USB and for LSB, corresponding to pc pc at the distance of M 51. The noise rms () measured at central in emission-free channels of the dirty map is 12 mJy beam-1 or 2.5 K for USB and 7.2 mJy beam-1 or 1.5 K for LSB, with the channel width of 5.08 km s-1 as Hanning smoothing was applied. The baseline length ranges 23.9 k to 362 k, which corresponds to to in angular resolution or 360 pc to 24 pc. Given that the typical width of molecular spiral arm seen in the K09 CO data is or 400 pc, most of the structures smaller than the arm down to 24 pc should be detected.
The dirty map was CLEANed by the use of the MIRIAD task mossdi with the flux cutoff of . In order to shorten the time needed to CLEAN, we applied a mask made by the combination of (i) the field of view, and (ii) mask from the K09 cube data. First, we created the sensitivity map from the primary beam patterns by the task mossen and defined the field of view as where the sensitivity is lower than 1.5 times the one at the pointing center. The diameter of this field of view is and pixels outside have been masked out to avoid confusion with elevated noise. We made the RA-DEC, RA-VEL, and DEC-VEL projections of the K09 cube and manually drew a polygon around emissions to make the mask for the entire galaxy. Within the field of view, only the region inside the K09 mask has been used for CLEANing. We refer to this CLEANed dataset as B-array data hereafter.
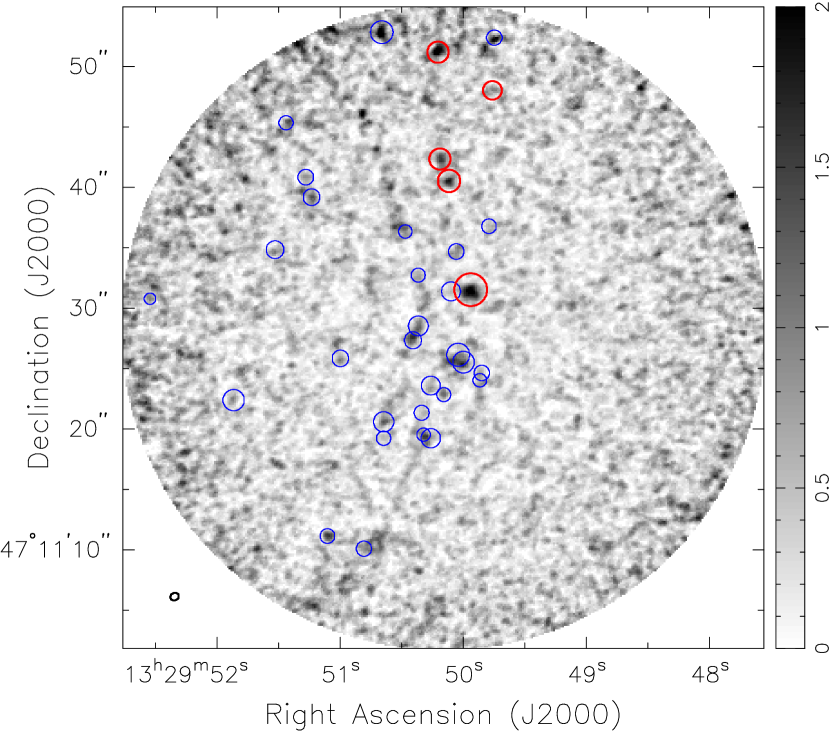
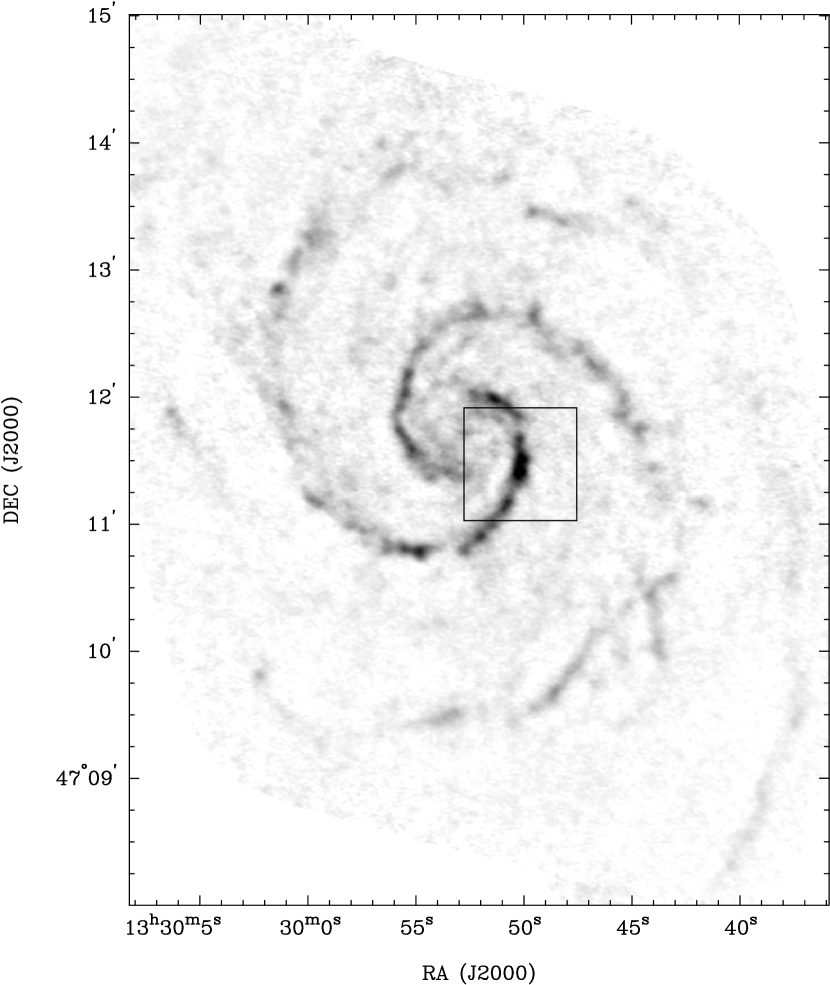
The integrated intensity or moment 0 () map was created by integrating the B-array data cube with the velocity range of 385.5–563.2 km s-1. The flux cutoff for making the map was set to be proportional to the local sensitivity; at the pointing center and at the edge of the field of view. The resulting map for the 12CO(1–0) data is shown in the left panel of Figure 1, while the B-array field of view is indicated as a box on the K09 map in the right panel.
3. Results and discussion
3.1. Detecting GMC-scale structures
In order to identify each molecular cloud structure, the clumpfind method provided by Williams et al. (1994) has been applied to the CLEANed 12CO(1–0) data cube with the lowest level and contouring step of . Both of these two parameters are constant within the field of view. We have then defined detections as clumps (i) within the field of view, (ii) with the peak flux whose local signal-to-noise ratio , and (iii) with the FWHM in velocity larger than 0.5 pixel (or 2.54 km s-1). We have calculated this local S/N, considering the variable sensitivity within the field of view.
The selected 34 clumps are indicated by circles in the left panel of Figure 1 superimposed on the moment 0 map. The line width and color represents the local S/N of each clump; thin blue is for S/N while thick red is for S/N . The radius measured by the clumpfind is – or 10–60 pc, corresponding to the radius of the circles in the figure. The FWHM in RA and DEC also fall in the same range with the radius and about one-third of the selected clumps are resolved. While most of the clumps are found in the arm, larger and more massive clumps are located only on the west side of the spiral arm. Assuming a trailing arm, this corresponds to the downstream side. On the other hand, some of smaller clumps are found in the upstream interarm region (east side of the field of view). In §3.2, we discuss it in more detail by comparison with the K09 data.
From Figure 1, we have noticed that there are several emission peaks not selected as clumps. Most of them are close to the edge of the field of view and thus are presumably elevated noise, while some appear sequentially on upstream side of the spiral arm. We have examined all the clumps with S/N and found that they are superposition of several weak- and narrow-line clumps at different velocities. As some of them seem to be associated with H II regions (see Figure 5), they perhaps are real molecular clouds, but we need a higher sensitivity to confirm that and do not include them for further discussion.
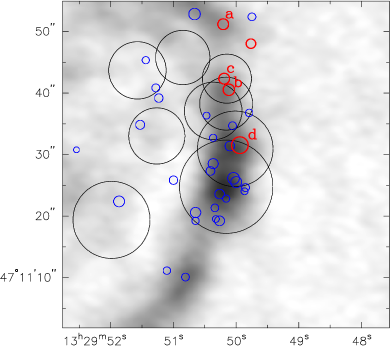
For the 13CO(1–0) line in the LSB data, the same procedures as the 12CO(1–0) data have been applied and three clumps with S/N have been detected. None of them, however, are found to be associated with the 12CO(1–0) clumps. Lowering the S/N cutoff to 3, we have detected 162 clumps and found two clumps with S/N located near 12CO(1–0) clumps; one is located close to the pointing center and coincides with the largest and most massive 12CO(1–0) clump (marked as ‘d’ in Figure 2), while the other is located close to the two 12CO(1–0) clumps at north of the pointing center (‘b’ and ‘c’ in Figure 2). A ratio of the peak temperatures of corresponding clumps is , while a ratio of the total flux is . The average integrated intensity ratio for the Galaxy is (Solomon et al., 1979b), implying that these massive clumps detected in M 51 are in similar condition to GMCs in the Galaxy. As these 13CO(1–0) structures do not meet the S/N criterion of for the clumps, we discuss only the 12CO(1–0) results hereafter.
The conversion factor from the 12CO(1–0) integrated intensity to the H2 column density () has been measured in a number of ways. For the Galaxy, cm-2 (K km s-1)-1 was derived by comparing the virial mass and the 12CO(1–0) flux of GMCs (e.g., Solomon et al., 1987; Young & Scoville, 1991). More recently, smaller values ( cm-2 (K km s-1)-1) have been reported by comparison with the -ray or far infrared data (Strong & Mattox, 1996; Dame et al., 2001; Grenier et al., 2005). Heyer et al. (2009) derived GMC masses from the 13CO(1–0) emission lines under the local thermodynamic equilibrium (LTE) assumption and found that the LTE masses are factor of smaller than the virial masses. The inconsistencies in values are due to the combination of uncertainties and/or invalidities of the models and assumptions introduced and imply difficulties in the determination.
As for the Galaxy, derived values for M 51 depend largely on data and methods. While the virial masses of GMAs derived by Rand & Kulkarni (1990) agree with cm-2 (K km s-1)-1, those derived by Adler et al. (1992) based on a different CO dataset suggest cm-2 (K km s-1)-1. Even smaller values have been suggested (Garcia-Burillo et al., 1993; Rand, 1993; Nakai & Kuno, 1995). More recently, Schinnerer et al. (2010) applied the large velocity gradient (LVG) modeling to resolution multi-transition CO data and derived cm-2 (K km s-1)-1. In this paper, we adopt cm-2 (K km s-1)-1. The variations of within the field of view as a function of galactocentric radius should be small enough to be neglected, as the data only cover or 2.2 kpc.
The noise rms () in the 12CO(1–0) data thus corresponds to within the synthesized beam ( pc) and one velocity channel (5.08 km s-1). Though the absolute mass of molecular gas could be changed by a factor of two or more according to adopted values, the sensitivity in mass is still smaller than typical GMCs in any case. Furthermore, the conclusion of this paper does not depend on the value, since we only focus on the spatial and kinematical information and discuss relative values of mass from the B-array and K09 data.
3.2. Relationship to larger structures
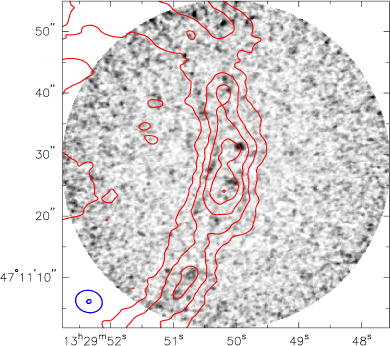
In the left panel of Figure 2, contours from the K09 map are overlaid on the B-array image. We have applied the clumpfind algorithm to the K09 data cube and defined GMAs as clumps with . Following the selection criteria for the B-array data, clumps on the data edge have been excluded. These selected GMAs are shown as open black circles in the right panel of Figure 2 together with the detected clumps in the B-array data in the same manner as Figure 1. The background image is the K09 moment 0 map. From this Figure, we find that GMAs are not filled with the GMC-scale clumps. As the sensitivity of the B-array data is about 10 times smaller than the typical mass of GMCs, we should have detected tens or more of them if GMAs were confusion of GMCs. This result strongly indicates that GMAs are not confusion nor overlapping of GMCs.
The total flux within the field of view of the B-array data has been measured to be 67 Jy km s-1 and Jy km s-1 for the B-array and K09 data, respectively. As the K09 data include the single-dish observations with Nobeyama 45m telescope, it should represent the total 12CO(1–0) flux. The missing flux in the B-array data is thus 94%, suggesting that most of the CO flux in the spiral arm of M 51 should come from either extended structures or molecular clouds smaller than GMCs and supporting the aforementioned indication that GMAs are not a collection of GMCs.
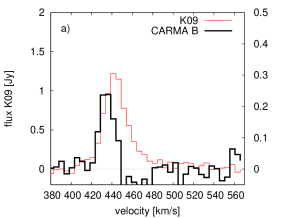
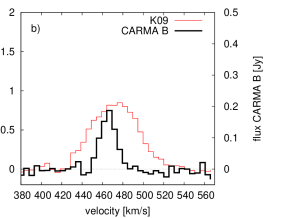
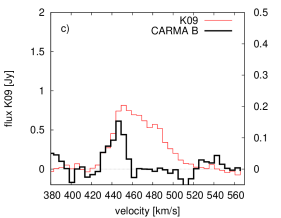
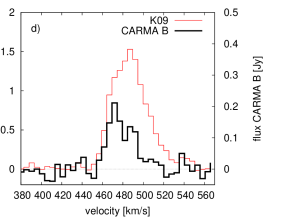
Another important clue from comparison of the two maps is that their peak positions do not coincide; massive clumps detected in the B-array data are shifted a few arcseconds toward the downstream side of the global spiral arm seen in the K09 map. To investigate this difference further with the velocity information, we have made spectra of B-array and K09 data at the positions of the selected clumps. The box size for the average spectra was set to be the same as the diameter of each clump derived by the clumpfind. In Figure 3, sample spectra for massive clumps are displayed. The flux difference mentioned above is clearly seen also in the spectra. From these spectra, we have found that massive clumps have offsets in peak velocity between the two datasets. We have defined the velocity offset as
| (1) |
where is the peak velocity for clumps measured by the clumpfind and is the peak velocity in the K09 spectra. The is plotted against the mass of each clump in Figure 4. It is clear from this plot that almost all of the clumps with have negative . Considering the galactic rotation, negative velocities correspond to the downstream side. Therefore, massive clumps are kinematically as well as spatially located downstream of the spiral arm. This difference indicates that the massive clumps are in a later evolutionary stage compared to the larger scale structures or GMAs. We refer to these massive clumps as GMA cores hereafter.

Smaller clumps are on the other hand located preferentially on upstream of the spiral arm, and little emission is found in the interarm region on downstream. This distribution of small clumps indicates that they are somehow destroyed through the evolution across the spiral arm. Before forming stars, the small clumps ( ) could collide with each other to form larger clouds such as GMAs. Meanwhile, they would be dissociated into atomic gas or broken up to even smaller clouds ( ) after forming stars.
3.3. Relationship to star forming regions
As already mentioned in §1, star forming regions are located on the downstream side of the spiral arms. Since we have found that GMA cores are also on downstream, it is worth comparing these two components.
The H data taken under the HST program (ID: 10452, PI: S. Beckwith) were obtained via the HST website111http://archive.stsci.edu/prepds/m51/ and cover including the entire galactic disk and the companion galaxy (Mutchler et al., 2005). The Pa image taken for another HST program (ID: 7237, PI: N. Scoville) was presented by Scoville et al. (2001) and covers central of the disk. The astrometry of the Pa image was found to be slightly off compared to the H image. In order to match their coordinates, we measured the peak position of bright H II regions seen in both H and Pa images, and adjusted the coordinates of the Pa image by the use of the task ccmap of the Image Reduction and Analysis Facility (IRAF).222 IRAF is distributed by the National Optical Astronomy Observatories, which are operated by the Association of Universities for Research in Astronomy, Inc., under cooperative agreement with the National Science Foundation. Although the fitting rms from ccmap is as small as and for RA and DEC, respectively, the errors in the coordinates could be larger as H II regions are extended especially in the H image and extinction gradients might affect the flux distribution and thus the peak positions. We estimate the effective uncertainty in the coordinates to be about 40 pc or , which is the typical size of GMCs and H II regions. In Figure 5, circles indicating the selected clumps are superimposed on the H and Pa images.
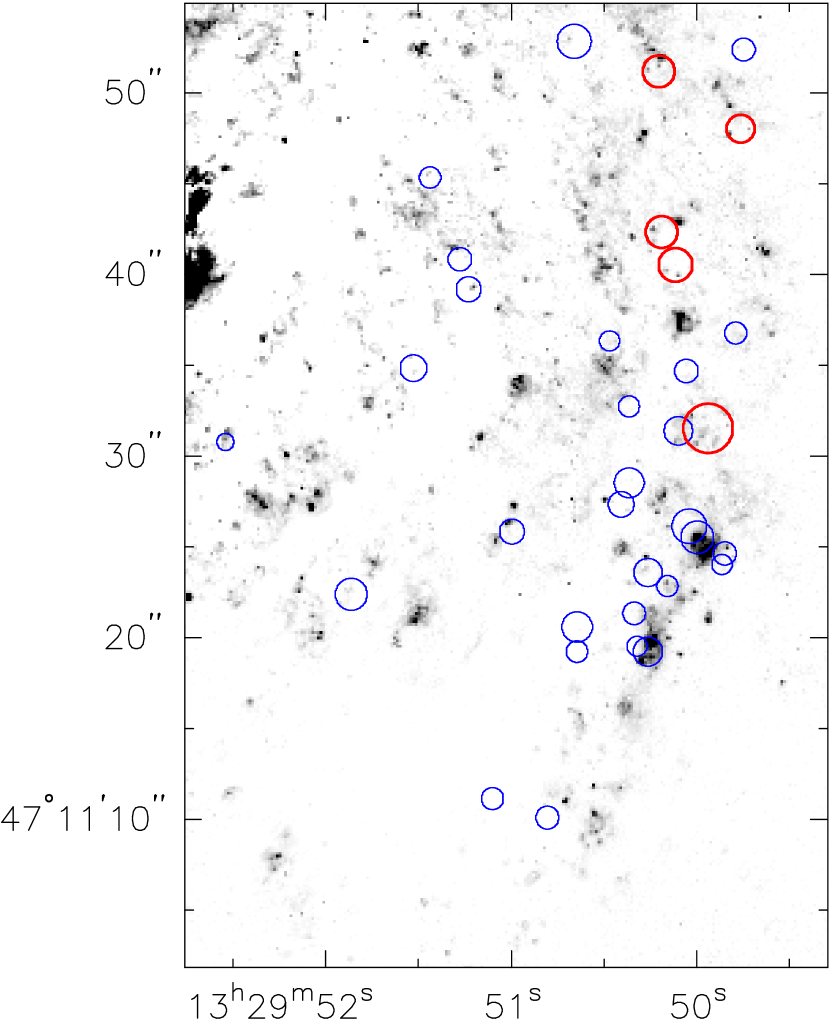
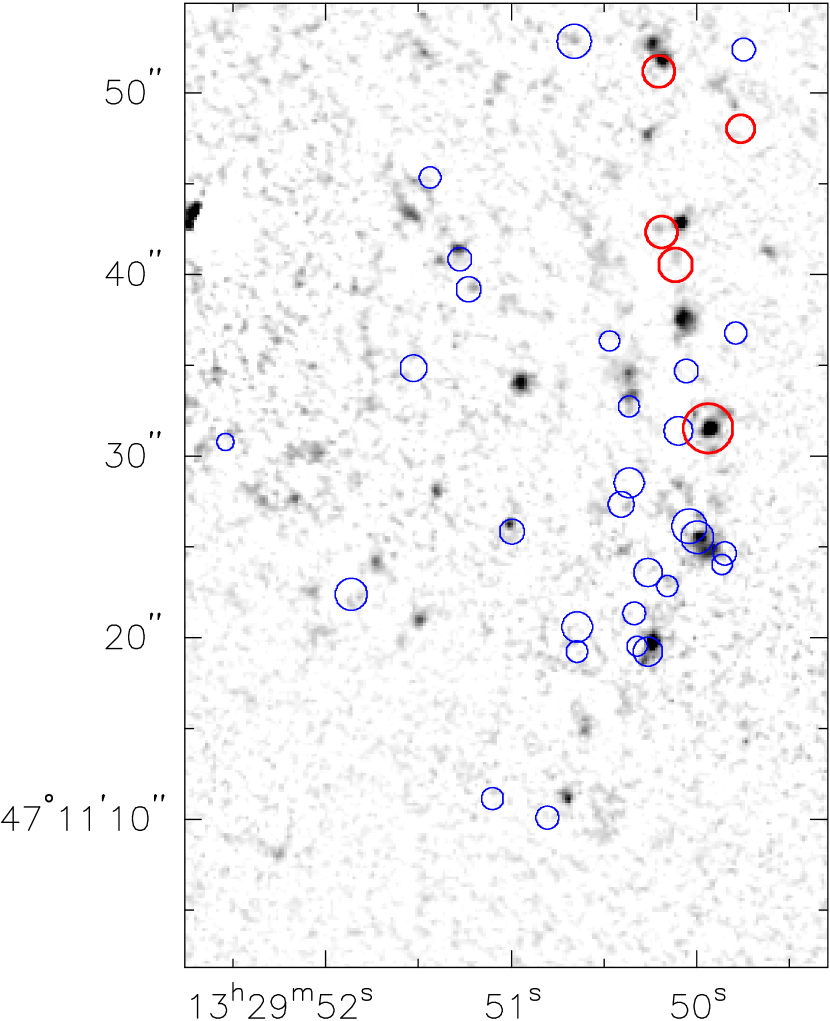
As expected, bright H II regions are located on the downstream side of the CO spiral arm seen in the lower resolution K09 data. GMA cores found in the high resolution B-array data, on the other hand, coincide with them. This correlation indicates that GMA cores are the site of massive star formation, which is consistent with the result in the previous subsection that they are in a later stage of the molecular gas evolution. Meanwhile, we have found that not all the H II regions are accompanied by the cores, which implies that GMA cores are short-lived or are not prerequisites for massive star formation.
Given that only the 12CO(1–0) data are available at this resolution, physical conditions such as density and temperature of GMA cores cannot be determined uniquely; high density and high temperature can both produce high . The largest core close to the pointing center, (marked as ‘d’ in Figure 2), gives a clue on this issue. From Figure 5, we have found that it does not have a counterpart in H but in Pa, indicating a high extinction and thus a high column density. From the mass ( ) and radius (55 pc) measured by the clumpfind, the average H2 column density is derived to be cm-2 for this core. Assuming mag cm2 (Bohlin et al., 1978), the estimated extinction is as high as mag. The most plausible detection of 13CO(1–0) at this location is also consistent with the high density. Therefore, at least for this core, we conclude that the high represents high column density of molecular gas. This agreement in high extinction and density also confirms that the coordinate adjustment for the Pa image is correct within the core size or .
Additionally, it is clear from Figure 5 that the distribution of H II regions is quite similar in the H and Pa images, indicating only a few regions (such as the most massive core mentioned above) are significantly affected by extinction. This means that H is a good tracer of the locations of current star formation in most cases and is preferable over extinction-free m for measuring offsets between molecular arm and young stellar arm (Egusa et al., 2009) as it generally provides higher angular resolution.
3.4. Evolution scenario across a spiral arm
The results presented above reveal the structure and distribution of molecular clouds at 30 pc scale for the first time in grand-design spiral galaxies. Based on their properties and relationship to the global (kpc) spiral structure, we here propose a scenario for the ISM evolution across the spiral arm. We should note here that smaller spatial scale across the arm corresponds to shorter timescale, which enables us to describe the scenario in unprecedented detail.
On the upstream side of the spiral arm, molecular clouds of collide with each other and probably with smaller clouds to grow into GMAs ( ). GMAs are presumably distinct and smooth structures and a few GMC-scale cores ( ) are formed within each GMA, which turn to be the site of OB star formation as they evolve. If not all the gas in cores would turn into stars, remaining gas in the core should break up to smaller molecular clouds ( ) or become dissociated into atomic hydrogen by strong radiation from young stars. From the star formation law presented by Kennicutt et al. (2007) for M 51, the gas consumption timescale measured as the ratio of the total gas mass to the star formation rate is yr. Since the star formation timescale is much shorter ( yr; Egusa et al., 2009) than this timescale, most of the gas in GMAs is not used by the star formation activity. Such gas remains molecular through the evolutionary sequence, considering that the molecular fraction to the total hydrogen has been estimated as 70–80% even in the interarm regions (K09).
4. Summary
We have carried out high resolution CO observations toward a spiral arm in the nearby spiral galaxy M 51 using the radio interferometer CARMA, in order to (i) resolve GMAs, (ii) detect GMC-scale structures, and (iii) understand their relationship to the global spiral structure. For the 12CO(1–0) line, the angular resolution and noise rms (1) are (or pc) and 12 mJy beam-1 (or 2.5 K) with the velocity width of 5.1 km s-1, respectively. Assuming the CO-to-H2 conversion factor, 4 corresponds to within the beam, which is smaller than the mass of typical GMCs. The spatial resolution is similar to the typical size of GMCs, and thus the data quality is high enough to detect GMC-like structures.
Within the field of view, a number of GMC-scale structures referred as clumps are detected in the 12CO(1–0) data. For the 13CO(1–0) line, only two marginal detections have been identified. By comparing with lower resolution 12CO(1–0) data (K09), we have located only a few clumps in each GMA and derived missing flux to be larger than 90%. These results indicate that GMAs are not mere confusion of GMCs but are plausibly single and smooth structures. Among the detected clumps, we have found that the most massive ( ) clumps are located at the downstream side of the spiral arm spatially as well as kinematically. This displacement indicates that they are at a later stage of the ISM evolution across the spiral arm and plausibly are cores of GMAs. Spatial coincidence between the massive clumps and H II regions supports this hypothesis. Smaller clumps on the other hand are found preferentially in the upstream side of the spiral arm.
We thus propose an evolutionary scenario for the ISM in spiral galaxies; as smaller clouds in interarm regions approach to spiral arms, they cluster or collide to form GMAs, which are smooth and discrete structures. Within a GMA, a few massive and GMC-scale substructures referred to as cores are formed at a later stage of its lifetime. Star formation is triggered within the GMA cores, and finally the remaining gas in the core is dissociated into atomic gas or broken up to even smaller clouds after stars are formed.
The sensitive and high resolution CO data from our new CARMA observations have revealed the internal structure of GMAs at GMC scale and its relationship to the spiral arm structure for the first time in external galaxies. This result is an important step to fully understand the ISM evolution scenario in spiral galaxies.
References
- Aalto et al. (1999) Aalto, S., Hüttemeister, S., Scoville, N. Z., & Thaddeus, P. 1999, ApJ, 522, 165
- Adler et al. (1992) Adler, D. S., Lo, K. Y., Wright, M. C. H., Rydbeck, G., Plante, R. L., & Allen, R. J. 1992, ApJ, 392, 497
- Bohlin et al. (1978) Bohlin, R. C., Savage, B. D., & Drake, J. F. 1978, ApJ, 224, 132
- Dame et al. (2001) Dame, T. M., Hartmann, D., & Thaddeus, P. 2001, ApJ, 547, 792
- Dobbs et al. (2010) Dobbs, C. L., Theis, C., Pringle, J. E., & Bate, M. R. 2010, MNRAS, 403, 625
- Egusa et al. (2009) Egusa, F., Kohno, K., Sofue, Y., Nakanishi, H., & Komugi, S. 2009, ApJ, 697, 1870
- Feldmeier et al. (1997) Feldmeier, J. J., Ciardullo, R., & Jacoby, G. H. 1997, ApJ, 479, 231
- Garcia-Burillo et al. (1993) Garcia-Burillo, S., Guelin, M., & Cernicharo, J. 1993, A&A, 274, 123
- Grenier et al. (2005) Grenier, I. A., Casandjian, J., & Terrier, R. 2005, Science, 307, 1292
- Heyer et al. (2009) Heyer, M., Krawczyk, C., Duval, J., & Jackson, J. M. 2009, ApJ, 699, 1092
- Kennicutt et al. (2007) Kennicutt, Jr., R. C., et al. 2007, ApJ, 671, 333
- Koda et al. (2009) Koda, J., et al. 2009, ApJ, 700, L132
- Lin & Shu (1964) Lin, C. C., & Shu, F. H. 1964, ApJ, 140, 646
- Meidt et al. (2008) Meidt, S. E., Rand, R. J., Merrifield, M. R., Shetty, R., & Vogel, S. N. 2008, ApJ, 688, 224
- Mutchler et al. (2005) Mutchler, M., et al. 2005, in Bulletin of the American Astronomical Society, Vol. 37, Bulletin of the American Astronomical Society, 452
- Nakai & Kuno (1995) Nakai, N., & Kuno, N. 1995, PASJ, 47, 761
- Rand (1993) Rand, R. J. 1993, ApJ, 404, 593
- Rand & Kulkarni (1990) Rand, R. J., & Kulkarni, S. R. 1990, ApJ, 349, L43
- Roberts (1969) Roberts, W. W. 1969, ApJ, 158, 123
- Sandage (1961) Sandage, A. 1961, The Hubble atlas of galaxies, ed. Sandage, A.
- Sault et al. (1995) Sault, R. J., Teuben, P. J., & Wright, M. C. H. 1995, in Astronomical Society of the Pacific Conference Series, Vol. 77, Astronomical Data Analysis Software and Systems IV, ed. R. A. Shaw, H. E. Payne, & J. J. E. Hayes, 433–
- Schinnerer et al. (2010) Schinnerer, E., Weiß, A., Aalto, S., & Scoville, N. Z. 2010, ApJ, 719, 1588
- Scoville et al. (2001) Scoville, N. Z., Polletta, M., Ewald, S., Stolovy, S. R., Thompson, R., & Rieke, M. 2001, AJ, 122, 3017
- Shetty et al. (2007) Shetty, R., Vogel, S. N., Ostriker, E. C., & Teuben, P. J. 2007, ApJ, 665, 1138
- Solomon et al. (1987) Solomon, P. M., Rivolo, A. R., Barrett, J., & Yahil, A. 1987, ApJ, 319, 730
- Solomon et al. (1979a) Solomon, P. M., Sanders, D. B., & Scoville, N. Z. 1979a, in IAU Symposium, Vol. 84, The Large-Scale Characteristics of the Galaxy, ed. W. B. Burton, 35–52
- Solomon et al. (1979b) Solomon, P. M., Sanders, D. B., & Scoville, N. Z. 1979b, ApJ, 232, L89
- Strong & Mattox (1996) Strong, A. W., & Mattox, J. R. 1996, A&A, 308, L21
- Tilanus et al. (1988) Tilanus, R. P. J., Allen, R. J., van der Hulst, J. M., Crane, P. C., & Kennicutt, R. C. 1988, ApJ, 330, 667
- Toomre & Toomre (1972) Toomre, A., & Toomre, J. 1972, ApJ, 178, 623
- Vogel et al. (1988) Vogel, S. N., Kulkarni, S. R., & Scoville, N. Z. 1988, Nature, 334, 402
- Williams et al. (1994) Williams, J. P., de Geus, E. J., & Blitz, L. 1994, ApJ, 428, 693
- Young & Scoville (1991) Young, J. S., & Scoville, N. Z. 1991, ARA&A, 29, 581