The Discovery of Infrared Rings in the Planetary Nebula NGC 1514 During the WISE All-Sky Survey
Abstract
We report the discovery of a pair of infrared, axisymmetric rings in the planetary nebula NGC 1514 during the course of the WISE all-sky mid-infrared survey. Similar structures are seen at visible wavelengths in objects such as the “Engraved Hourglass Nebula” (MyCn 18) and the “Southern Crab Nebula” (Hen 2-104). However, in NGC 1514 we see only a single pair of rings and they are easily observed only in the mid-infrared. These rings are roughly 0.2 pc in diameter, are separated by 0.05 pc, and are dominated by dust emission with a characteristic temperature of 160 K. We compare the morphology and color of the rings to the other nebular structures seen at visible, far-infrared, and radio wavelengths, and close with a discussion of a physical model and formation scenario for NGC 1514.
1 Introduction
In 1790, William Herschel found “a most singular phaenomenon! A star of about the 8th magnitude, with a faint luminous atmosphere, of a circular form, and of about 3′ in diameter.” This object, now known to us as NGC 1514, with its central star inseparable from a “shining fluid”, convinced him that not all the nebulae he studied could be resolved into clusters of stars as he had thought (Herschel, 1791). Thus began over 200 years of study of NGC 1514, though it is still classified as the round or elliptical planetary nebula that Herschel saw.
In modern terms, NGC 1514 is a moderately high excitation planetary nebula (PN) in Taurus ( = 04h 09m 16990, = +30° 46′ 3344, J2000). The optically visible central source (CSPN) of NGC 1514 is unusual in that its spectral type is too late (A0) to produce the observed nebula. Kohoutek (1967) and Kohoutek & Hekela (1967) developed the notion of a binary central source, and concluded that an A0III giant and a sub-luminous, dwarf O star would reproduce the observed UV spectrum. By contrast, Greenstein (1972) concluded through the use of higher spectral resolution spectrophotometry that the visible star is a horizontal branch A star. This star is slightly cooler and has a much lower absolute magnitude than an A0III giant. He finds that the CSPN is better represented by an A star of K, and an sdO star with a temperature of 100,000 K and . Later, Feibelman (1997) built on earlier IUE observations by Seaton (1980) to show that the CSPN could be represented by an early A star of K along with a 60,000 K subdwarf; he also found that the CSPN’s ultraviolet flux varied by more than a factor of two on timescales of a year to a decade.
NGC 1514 itself is typically catalogued as a round or slightly elliptical nebula, with an amorphous appearance (e.g. Balick, 1987). Kohoutek (1968) describes the nebula as having an inner shell (or main body) with a diameter of ″, and an outer, homogeneous, spherical layer of ″. He interprets condensations within the inner part of the nebula as a toroid with the axis of symmetry at a position angle of 35°. Chu et al. (1987) classify it as a double shell PN, 132″ and 183″ in diameter. Figure 1 illustrates the optical appearance and uses their nomenclature (which we adopt) to highlight the various features.
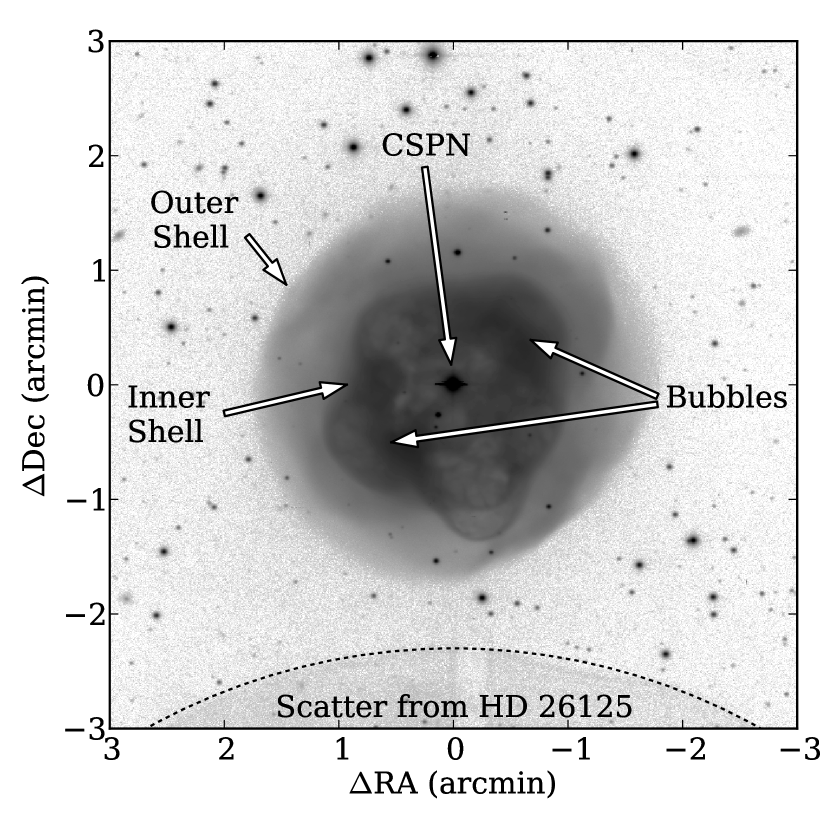
Hajian et al. (1997) describe NGC 1514 as a “lumpy nebula composed of numerous small bubbles” based on their deep [O III] image. They interpret the bubbles at the edge of the inner shell to be sweeping up outer shell (“halo”) material which is providing pressure confinement. They confirm a somewhat filamentary structure in the outer shell that had been reported earlier by Chu et al. (1987). Unfortunately, NGC 1514 does not have an observable halo of the type needed for the timescale correlation method for determining the distance that is the focus of their paper.
Perhaps the spatiokinematic study by Muthu & Anandarao (2003) is the most in-depth look at the formation and structure of NGC 1514. They used an imaging Fabry-Pérot spectrometer to produce velocity-resolved maps of the 5007 Å [O III] line. From modeling the double- and triple-component line profiles seen in these maps, they deduced that NGC 1514 is a generally ellipsoidal shell nebula, but that it also has two “blobs” or bubbles of material emanating from the center. The southeast bubble is slightly blue-shifted, and the northwest blob is red-shifted, thus defining a “polar” axis. The bubbles themselves are uncollimated in that there are large velocity dispersions across each of the bubbles; this is in contrast to other highly collimated, bipolar flows seen in many other PNe. Finally, they model the overall velocity structure of the nebula and derive peak expansion velocity of 23 km s-1 near the center, falling off with radial distance as expected from projection effects along the line of sight.
2 Observations
The Wide-field Infrared Survey Explorer (WISE, Wright et al. 2010) is a NASA Mid-class Explorer mission that is surveying the entire sky at wavelengths of 3.4, 4.6, 12, and 22 µm (W1 through W4, respectively). The point source sensitivity (defined as a 5 detection with eight repeat exposures per source) is currently estimated to be 0.08, 0.11, 1, and 6 mJy in these passbands, respectively. WISE surveys the sky in 47′ wide strips with a significant overlap between each strip that yields the eight or more coverages (depending on ecliptic latitude). NGC 1514 was thus observed twelve independent times on 2010 Feb 18-19 UT for a total of 106 seconds of integration time in each of the four bands; NGC 1514 was easily detected in all four bands.
The data presented here were processed with the “first-pass” version of the WISE pipeline that utilized preliminary reduction algorithms and calibrations derived from early survey data. The twelve individual fields have been corrected for detector artifacts, optical distortions, and latent images. They were then combined into “ops coadds” with pixel outlier rejection to suppress cosmic rays and transient noise events, and have been resampled from the native plate scales of 2.75 (W1, W2, and W3) and 5.5 (W4) arcsec pixel-1 to the WISE image atlas scale of 1.375 arcsec pixel-1. The photometry has been calibrated using WISE measurements of blue (stellar) calibrators; calibration using red (ULIRG) calibrators currently differs by several percent, so that the absolute fluxes are currently uncertain by 10%. (See Wright et al. 2010 for further discussion.) No color corrections have been applied to the photometry reported here. For our purposes, the correction terms for stellar spectra and blackbody continua and for all sources in the W4 band are essentially zero. In W3, the corrections do not exceed 15% until objects are cooler than 160 K. For W2, the equivalent temperature is 250 K, and for W1, 400 K.
The W4 data were also reprocessed using the deconvolution capabilities of AWAIC, a coaddition and deconvolution package developed for WISE, but which can be used with generic astronomical data sets (Masci & Fowler, 2009). The deconvolution algorithm “HiRes” is based on the Maximum Correlation Method, which was developed to enhance the scientific return from the IRAS survey. W4 data covering a 24 arcminute field was passed through just three iterations of HiRes, enough so that the model image has an apparent spatial resolution equivalent to the native W3 resolution. The resulting image, denoted as W4decon, is used only in morphological discussions; all flux measurements are based on the W4 ops coadd image.
3 Results
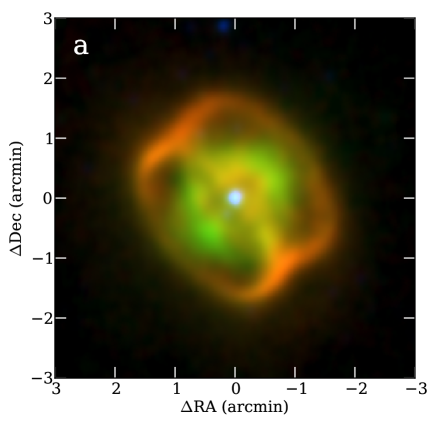
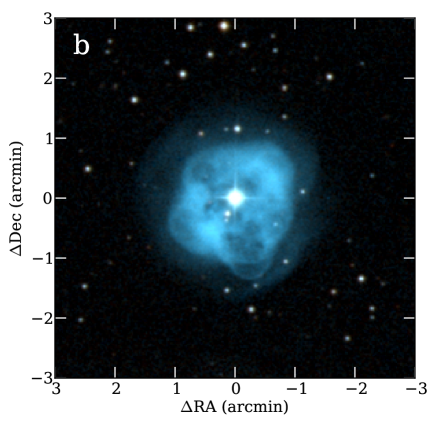
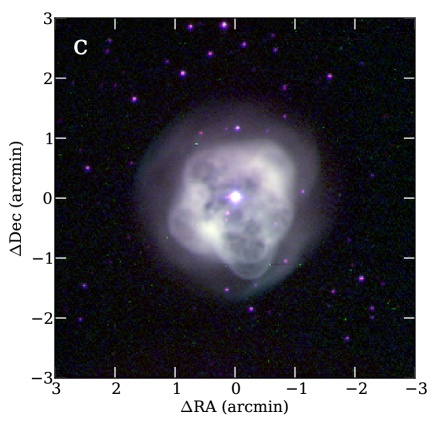
Inspection of even the raw, unprocessed WISE images immediately revealed an unexpected structure in NGC 1514. A pair of bright axisymmetric rings that surround the visible nebula are plainly apparent (coadded data are shown in Figure 2a); in fact, they dominate the emission at W4, giving the red appearance to the rings in the figure. Such a structure is not suggested in any of the visible wavelength images available to us; e.g. the DPOSS data presented in Figure 2, the H image in Figure 1, the published figures of Balick (1987), Hajian et al. (1997), and Corradi et al. (2003, and private communication), or the deep, very narrow-band image by D. Goldman111http://dg-imaging.astrodon.com/gallery/display.cfm?imgID=205.
 |
 |
 |
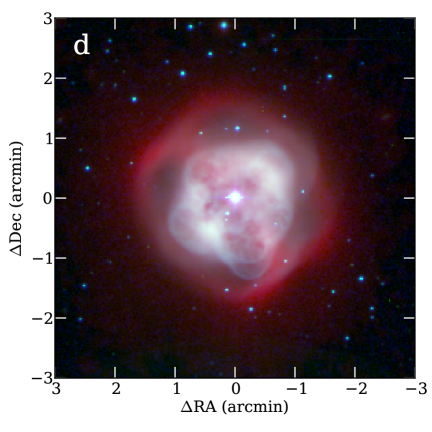 |
Remarkably, the inner shell has almost exactly the same appearance in the mid-infrared as in the visible when the differing spatial resolutions are taken into account. Panels c and d of Figure 2 show that the inner shell is “gray” across all wavelengths (with the exception of the rings). The spatial extent, the positioning of the bubbles, the relative brightnesses, etc. are all identical at the 10–20% level over many different wavelengths. This is in marked contrast to other PNe such as those illustrated in Balick & Frank (2002) and Hora et al. (2004), though the Group 1 PNe of Chu et al. (2009) have 24 µm morphologies that compare favorably to the optical red or H images. Images of these objects at other wavelengths are needed to determine if they are similar to NGC 1514 in this regard.
3.1 Photometry
The spatial resolution of WISE does not allow much new insight directly into the nature of the central source of NGC 1514; the 6″ resolution has no hope of resolving the central binary. If the sdO+A0III (or horizontal branch A0) binary model is correct, then at best we would expect the infrared fluxes to approximately follow the Rayleigh-Jeans law for a 10,000 K blackbody. To verify this, we present infrared fluxes from the 2MASS and WISE surveys in Table 1. These values are obtained by profile fit photometry as returned by the 2MASS and WISE data pipelines. Encouragingly, Taranova & Shenavrin (2007) got very similar magnitudes in the near-infrared using an aperture photometer: J = 8.238, H = 8.108, K = 8.036, and L = 7.927.
| Observed | Dereddened | ||||||||
|---|---|---|---|---|---|---|---|---|---|
| Band | 0 Mag | Extinc. | Magn. | Flux | Magn. | Flux | |||
| Flux | Corr. | ||||||||
| (µm) | (Jy) | (mags) | (mags) | (Jy) | (mags) | (Jy) | |||
| J | 1.235 | 1594 | 0.442 | 8. | 190 | 0. | 844 | 7.748 | 1.268 |
| H | 1.662 | 1024 | 0.275 | 8. | 098 | 0. | 590 | 7.823 | 0.761 |
| K | 2.159 | 666.7 | 0.133 | 8. | 002 | 0. | 420 | 7.869 | 0.475 |
| W1 | 3.353 | 306.7 | 0.058 | 7. | 918 | 0. | 209 | 7.860 | 0.220 |
| W2 | 4.603 | 170.7 | 0.034 | 7. | 907 | 0. | 117 | 7.873 | 0.121 |
| W3 | 11.561 | 29.04 | 0.048 | 7. | 576 | 0. | 027 | 7.528 | 0.028 |
| W4 | 22.088 | 8.239 | 0.026 | 7. | 5 | 0. | 008 | — | — |
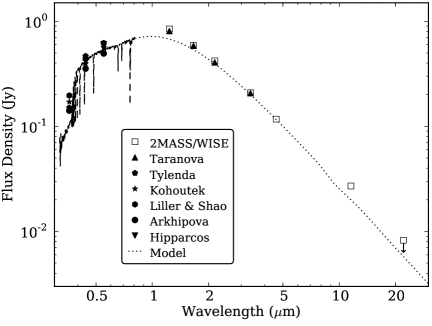
The visual extinction to NGC 1514 has been estimated by various authors to be 1.5 to 2.5 magnitudes, based primarily on the color (e.g. Greenstein, 1972) or from the H/H or radio/H ratios (e.g. Cahn et al., 1992). We use the new WISE fluxes to provide a much longer baseline in an effort to better estimate the correct visual magnitude of NGC 1514 photometrically. We begin by constructing a model CSPN spectrum using visible-wavelength spectral templates for an O5V star and an A0III star (from STELIB, Le Borgne et al., 2003), and a 9800 K blackbody to represent the infrared. The precise spectral types are relatively unimportant; we are primarily interested in correctly estimating the overall shape of the SED, not in the particulars of any spectral features. Using the interstellar extinction curves of Draine & Lee (1984), we redden the model until an acceptable match is achieved. (Extinction curves of other authors were checked, but the differences are not large enough to affect our conclusions, and Draine & Lee are the only set comprehensive enough to cover ultraviolet through infrared wavelengths.)
The best model fit is shown in Figure 3; an extinction value of is found. The fit is quite good except for the J band near-infrared point and the W3 mid-infrared point. Given the good agreement between the 2MASS profile fit value and the aperture-derived value of Taranova & Shenavrin (2007), the “excess” at J is real, at least in the sense that it is not a measurement error and it cannot be fit with our simplistic photospheric model. Whitelock (1985) forecast the great strength of the He I triplet at 1.083 µm in many PNe, while Pa can also be very strong (e.g. Hora et al., 1999), so it is possible that some nebular emission is being picked up where it overlaps the CSPN. (Though to be fair, the K band will pick up Br and may also be affected.) The small excess at 12 µm is also real, and is definitely due to the nebular line emission (see Section 3.4).
Using this value of , we deredden the magnitudes for the CSPN, and these are also reported in Table 1. If we assume that the near-infrared SED is indeed that of an A0 star where all the color terms are 0.0, we should find the same magnitude value at all wavelengths. Taking the mean of the magnitudes from H through W2, the dispersion is reduced from 7.98 0.08 for the uncorrected case (where there is a obvious slope to the data) to 7.86 0.02 after dereddening. The literature shows a fair spread in the reported and band values (though is pretty consistently between 0.50 and 0.55), but an average of a half dozen reported values shows that . Applying our value of to this mean corrects the magnitude to 7.93, only 7% off the 7.86 found from the infrared magnitudes. In subsequent discussion, we assume that the best estimate of the intrinsic V magnitude of the CSPN is .
3.2 Surface brightness
Contour maps of NGC 1514 at the four WISE wavelengths are presented in Figure 4. The nebular emission is clearly rising rapidly at longer wavelengths. The surface brightness of the nebula in the region of the bubbles roughly follows a power law for the four WISE bands. (This holds only for the WISE bands; the inner shell is brighter in the 2MASS bands than this power law would predict. Our assumption is that shorter wavelengths are dominated by line emission and perhaps scattered starlight.) It is also the case that the emission from the rings is rising even more rapidly (is redder) than that in the inner core, following a power law of .
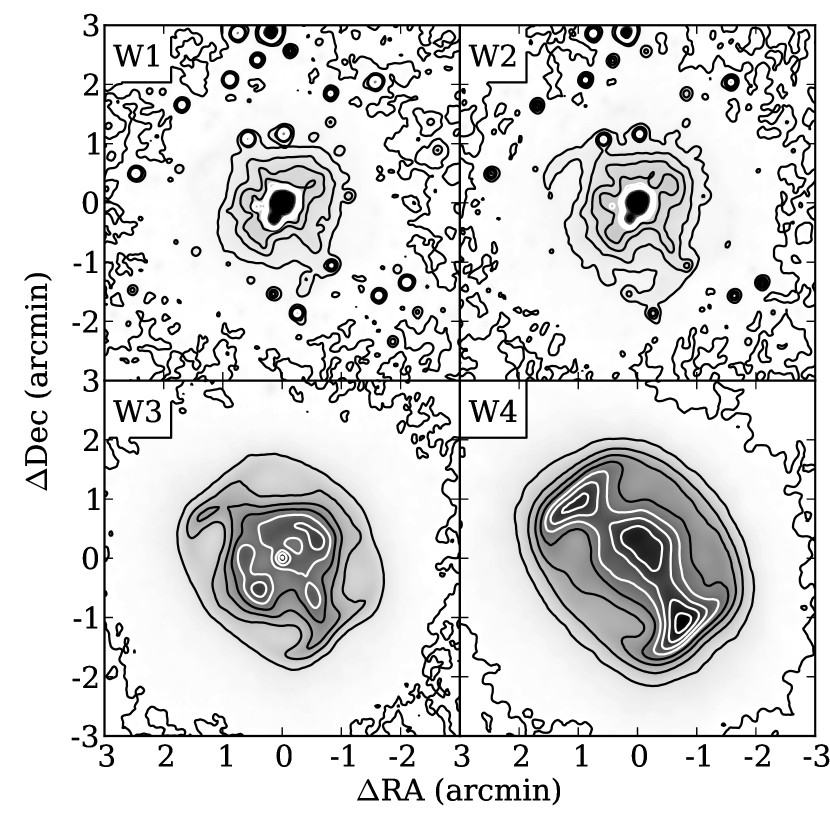
Therefore, the nature of the nebular emission at mid-infrared wavelengths appears to be primarily thermal, even in regions where the line strength is relatively high. Though the emission from the brightest mid-infrared emission line, that of the [O IV] line at 25.89 µm, is reasonably strong (see Section 3.4), it lies near the long wavelength cutoff of the W4 passband where the transmission is low, and thus cannot account for a substantial fraction of the observed flux.
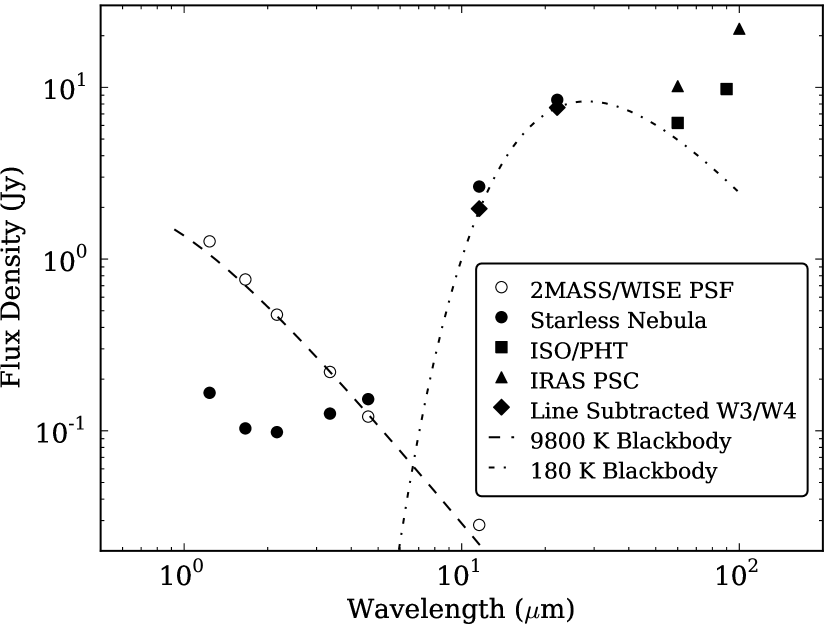
Figure 5 shows a plot of the total integrated flux of the nebula (all stars, including the CSPN, have been removed by profile fitting) from 1 to 100 µm, measured using a 5 arcminute diameter aperture for the 2MASS, WISE, and NVSS data, 3.5 arcminutes for the ISO/PHT data (the maximum extent available in the released data), and the IRAS point source catalog’s values where we assume all of the flux will be captured in a single beam. These values are also listed in Table 2.
| Source/ | Wavelength | Observed | Dereddened |
|---|---|---|---|
| Band | Flux Density | Flux Density | |
| (µm) | (Jy) | (Jy) | |
| J | 1.24 | 0.111 | 0.166 |
| H | 1.66 | 0.080 | 0.103 |
| K | 2.16 | 0.087 | 0.098 |
| W1 | 3.35 | 0.119 | 0.126 |
| W2 | 4.60 | 0.148 | 0.153 |
| W3 | 11.56 | 2.529 | 2.644 |
| W4 | 22.09 | 8.264 | 8.461 |
| ISO/PHT | 60 | 6.205 | — |
| ISO/PHT | 90 | 9.775 | — |
| IRAS | 60 | 10.17 | — |
| IRAS | 100 | 21.97 | — |
At wavelengths shorter than 4.6 , the CSPN has a higher flux than the whole of the nebula. But at wavelengths longer than 4.6 , the nebula’s flux density rises dramatically. A 180 K blackbody curve has been drawn into the figure to guide the eye, but it is clear that multiple temperature components are required to completely fit the data. A more detailed thermal model is not warranted given the few data points, but it is the case that the bulk of the emission comes from material that is quite cool, 200 K, and some perhaps as low as 30 K to account for the far-infrared fluxes.
3.3 Background
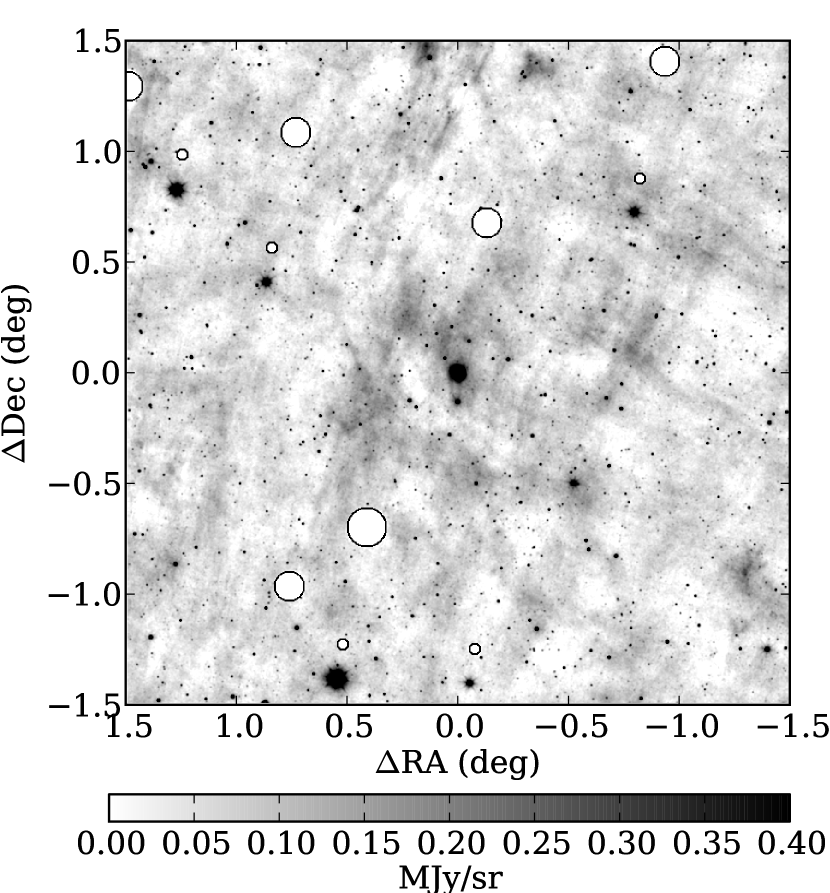
There is a moderately bright, dusty background present in the region near NGC 1514; Schlegel et al. (1998) (as implemented by the NED Extinction Calculator) predict an of 2.252 magnitudes in this direction ( = 165.53, = -15.29). It appears that the PN is superimposed on top of one of the brighter ridges of this background; we estimate a 12 µm brightness of 0.34 MJy sr-1 at the PN above the darkest areas of the image. (The zero point is not yet calibrated, so we cannot know the absolute brightness.) A 3°3° W3 field is shown in Figure 6. The equivalent W4 field shows all the same structures visible at W3, while a comparison field taken 45° farther off the galactic plane ( = 165.53, = -60.29), where the predicted is only 0.076, shows no such background structure. We are therefore confident that this background structure is real.
The extended emission outside a 5 arcminute diameter circle around NGC 1514 is dominated by this striated background, and we see no obvious correlation between these structures and the nebula, either in position or symmetry. The PN is simply superimposed onto one of the denser portions of this region. This conclusion calls into question some of the results found by Weinberger (1999) and Aryal et al. (2010) where they reported structures with degree angular scales that were linked with NGC 1514 in the IRAS data at 12 µm. The emission Aryal et al. see in their Figure 1c matches that of our Figure 6, but the much poorer spatial resolution of IRAS has smeared the background variations into the ring-like structure those authors report. Indeed, if we bin the WISE data down to two arcminute pixels, the appearance is similar enough to suppose that there is a link. However, the factor-of-60 higher resolution WISE data show that the background nebulosity is not correlated with the PN in any simple way.
3.4 Spitzer spectra
The Spitzer Space Telescope observed NGC 1514 only once as part of a wavelength calibration program for the IRS instrument. Accordingly, the exposures are very short, ranging from 15 seconds in the low-resolution data to 60 seconds in the high resolution data, so that the overall signal-to-noise ratio is small. In addition, the pointings between the four different spectrometer modules do not overlap, so that only on the central source do they all sample the same region. These data are publicly available and were accessed through the Spitzer Data Archive.
Low resolution spectra were extracted for the central position by using the most central of the pointings while using the most off-center pointings to subtract the background spectrum. This spectrum is presented in Figure 7. Several facts are immediately apparent: 1) the short wavelength end of the IRS spectrum is dominated by emission from the 9800 K photosphere; 2) the long wavelength end is dominated by 100 K thermal emission from circumstellar material; 3) forbidden atomic lines from the nebula are quite strong even in just the line of sight to the CSPN; and 4) there is a complete lack of the PAH emission bands. Although PAH emission is usually dominant in nebulae, many PNe are known to have no PAH band emission and are instead dominated by H2 line emission; NGC 1514 appears to be a member of this class. Since the WISE W3 band encompasses all the PAH emission bands from 7.6 to 13.5 µm, the Spitzer data suggests that all the structure seen in W3 arises from the same material that produces the optical nebula, along with thermal emission from dust that is distributed throughout.
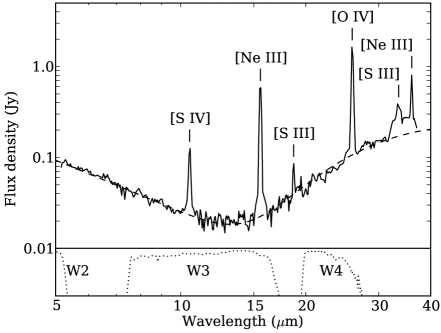
Only six emission lines are unambiguously detected at either spectral resolution: the 25.89 µm [O IV] line is quite strong; the 10.51 µm [S IV], 15.56 µm [Ne III], and 36.01 µm [Ne III] lines are fainter, but still well detected; and the 18.71 µm and 33.48 µm [S III] lines are very faint, but definitely present. The presence of these lines, in particular that of [O IV], indicates a high excitation nebula (central source of order 100,000 K), though not as high as some because of the lack of the [Ne V] line at 24.32 µm.
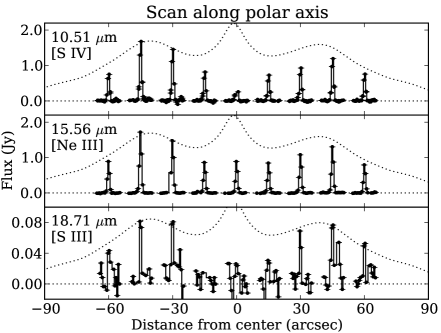
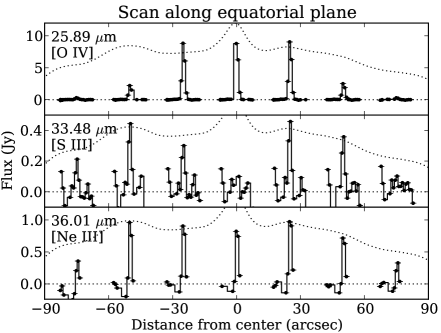
Nine spatial positions along the PN’s polar axis were sampled at high spectral resolution with the Short-High module, and seven positions were obtained along the equatorial plane with the Long-High module (Figure 8). We note that, with the exception of the [O IV] line, all the lines vary in intensity as a function of position in the same manner as the broadband W3 flux; the W3 intensity profile matches the envelope of the line peaks surprisingly well. This implies that at least the sulphur (doubly and triply ionized) and neon are well mixed with the dust throughout the inner shell. The oxygen, on the other hand, (at least the triply ionized species) is concentrated in the inner 30″ radius of the nebula, and is almost entirely absent outside that.
The outer two positions taken with Long-High module (75 arcsec from center) are the only two positions that would be dominated by flux from the rings. In both positions, the lines strengths (25.89, 33.48, and 36.01 µm) are much less than for the more central positions. Given that the nearest WISE band, W4, shows that the rings are brighter than the inner shell at long wavelengths, this suggests that lines are responsible for little of the ring emission; the rings must be almost entirely thermal emission.
Because no pair of emission lines from the same species was observed at the same spatial position, we can only make crude estimates of line ratios. One of the better indicators of electron density is the [S III] 18.7/33.5 µm line ratio. If we make the assumption that the underlying nebular brightness is roughly constant 50″ from the CSPN, then the ratio is a very low 0.33 ( W m-2 vs. W m-2). Even if our uniformity assumption is off by more than a factor of two either direction, the inferred electron density is still well under cm-3. This agrees with the estimate by Kohoutek (1967) who derived a value of 290 cm-3 for the inner shell and 140 cm-3 for the outer shell based on H line strengths.
4 Discussion
Given that the central source of NGC 1514 is a binary system, the presence of these rings, while perhaps surprising in their form, is not entirely unexpected. Binarity and bipolar structures in PNe go hand-in-hand (e.g. the review by de Marco, 2009, and references therein). The new infrared data, and particularly the discovery of the rings, allow us to refine our understanding of NGC 1514.
4.1 Distance
The distance to NGC 1514 is quite uncertain. From the Hipparcos catalog of parallaxes, one can derive a distance of pc, while the statistical methods summarized by Zhang (1995) can yield distances up to 1300 pc. Our WISE results do not shed a great deal of new light on the distance, but we can use our more confident estimate of to help set plausible limits on the range of possibilities.
In deriving the distance modulus to the nebula, the absolute magnitude of the CSPN has a larger uncertainty by far than the dereddened apparent visual magnitude. If the brighter component of the CSPN is taken to be an A0III giant as determined by Kohoutek (1967) with an absolute magnitude of (Jaschek & Gómez, 1998), then the inferred distance is pc. If, instead, the CSPN is a horizontal branch A star as found by Greenstein (1972) with an absolute magnitude (de Boer et al., 1997), then the distance is pc.
It seems likely, therefore, that distances pc such as those found by the H-to-radio ratio (Cahn et al., 1992) or diameter-to-radio flux relationships (Daub, 1982) are overestimates. The Hipparcos distance (at ) is broadly consistent with our lower luminosity estimate, thus we consider a distance of 200–300 pc quite plausible.
4.2 Ring Properties
For purposes of extracting geometric information, the rings can be modeled as two parallel, unresolved rings (Figure 9) with a deprojected separation of 41″ (0.05 pc, if we assume pc), the southeast of which is 173″ in diameter while the northwest is 177″ in diameter (roughly 0.2 pc). The rings are tilted 59° from pole-on and rotated to a position angle of 131°. A formal least squares fit using a downhill simplex method was attempted, but the irregularities in the ring brightness and the complexity of the interior shell morphology prevented a believable solution from being found. The values quoted are estimated from “by eye” fits, but numerous trials showed noticeable errors in the diameter and separations at the ″ level, in PA at °, and in tilt at °. Higher spatial resolution imaging than can be provided by WISE will be required to refine these estimates.
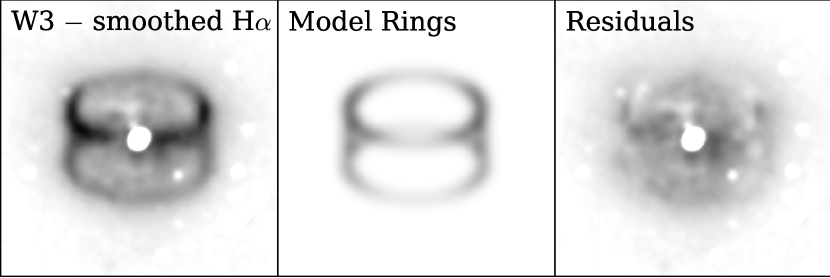
By subtracting the ring models from the integrated flux measurements, we estimate the percentage contribution of the rings to the total nebular flux. The rings contribute 10% at W1 and W2, 15% at W3, and 30% at W4. The increasing fraction is consistent with the redder color of the rings noted in Section 3.2 and suggests a ring color temperature of K.
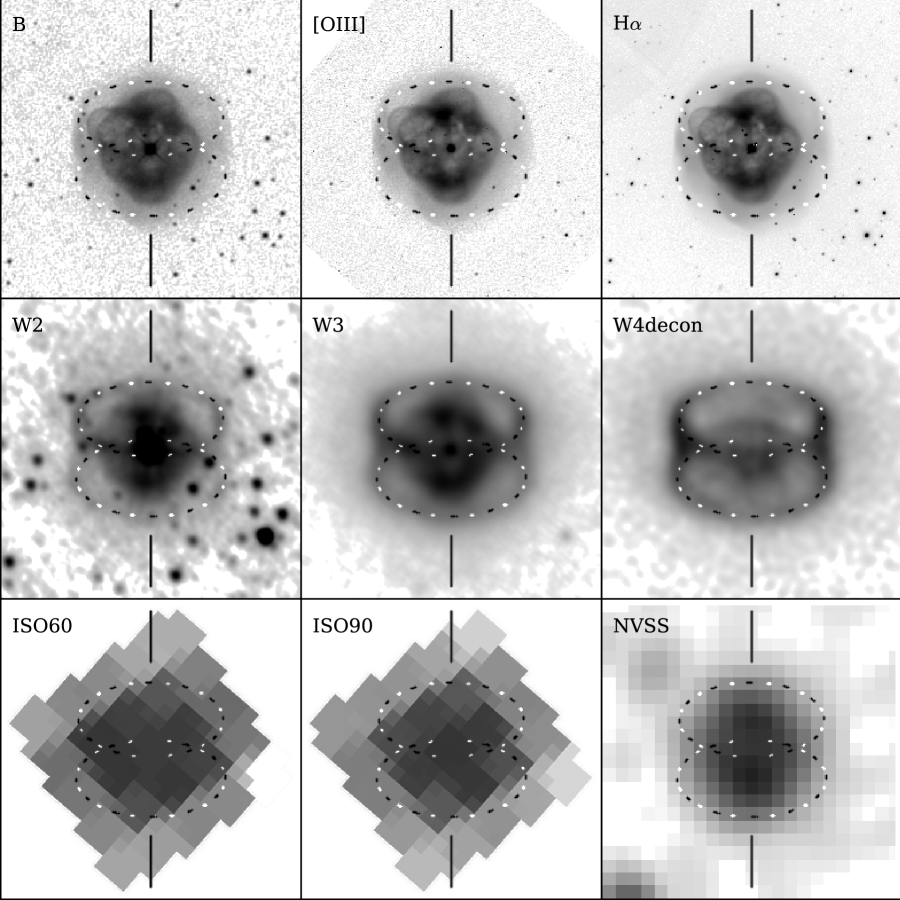
This ring model fit can then be overlayed on all the images in order to see how the various features visible at differing wavelengths compare (Figure 10). Starting with the middle row, the fit falls well on the rings seen at all four WISE wavelengths (W1 is very similar to W2 and has been omitted). At visible wavelengths, the ring fit falls entirely within the faint outer shell, but no evidence can be seen for the rings themselves at these wavelengths. In the far-infrared, the nebula is not well resolved, but it appears that it is elongated roughly along the equatorial plane of the model, suggesting that there is an extensive, dusty disk lying in the plane. This disk cannot be very dense given that the extinction to the central source is not large, and there are no color gradients across the nebula.
At 1.4 GHz in the NVSS survey, the nebula is resolved into two spots corresponding to the visible bubbles. Pazderska et al. (2009) report a total flux of 60 mJy at 30 GHz for NGC 1514. They note that this PN shows no sign of a high-frequency excess such as that attributed to emission from spinning dust (Casassus et al., 2007). The radio emission from NGC 1514 is therefore purely free-free; this again suggests that the bubbles contain a significant quantity of ionized gas while the rings do not.
4.3 A Physical Model, Refined
Muthu & Anandarao (2003) present a physical model of NGC 1514 in their Section 4 that agrees very well with our observations. The overall ellipsoidal shape of the PN is still apparent in the infrared. The presence of the rings confirms the axisymmetric structure they assume. We refine the estimate of the position angle of the polar axis from 135° to 131°, and we establish a tilt angle of 31° out of the plane of the sky, agreeing with them that the southeast part of the nebula is the side that opens toward us. While they could not determine the relative angles between the bubble axis and the shell axis, we can confirm that they are coincident (see, for example, Figure 10). This general configuration now seems quite secure.
The formation of the rings themselves is still uncertain. At the simplest level, the rings are part of the dust that is associated with the photon-dominated region (PDR) that is, in turn, wrapped around the ionized zone. But, lacking specific kinematic information on the rings (recall that Muthu & Anandarao 2003 concentrated on the inner shell, and where their sample points might have contained the rings, the rings are not detected), we can only compare NGC 1514 to other objects that have similar morphologies. Two such objects are Hen 2-104 and MyCn 18, although in both of these cases the structures are seen at visible wavelengths.
The core of Hen 2-104 bears the most striking resemblance to NGC 1514, though Hen 2-104 itself is a symbiotic star rather than a PN and it shows multiple sets of rings. Corradi et al. (2001), and updates by Santander-García et al. (2008), develop spatiokinematic models to explain the rings and accompanying structures. They invoke the model proposed by Soker & Rappaport (2000) that uses interacting winds from the central binary source to explain the multiple rings and overall collimated structure. Such a model could partially explain NGC 1514 if we assume that the rings we observe represent a particularly large mass loss event and are thus merely the brightest ones in the system, and that other rings and a more extensive structure may be detectable if greater sensitivity were available to us (and it were not washed out by the dusty background emission). However, the focusing mechanism of the winds cannot be so efficient as to prevent the formation of the relatively uniform outer shell seen at visible wavelengths.
The formation of MyCn 18 may follow similar lines. It has a very well defined hourglass shape with numerous pairs of parallel rings, though the overall structure is much more focused than either Hen 2-104 or NGC 1514. Sahai et al. (1999) propose a mechanism related to that of Soker & Rappaport (2000), except that the rings are formed by a more collimated outflow jet interacting with a round circumstellar envelope. This could again fit NGC 1514 if we assume that there was one event that was far stronger than any other, and any other events are simply too faint for WISE to detect.
This still leaves the question of why the rings are visible only in the infrared. Our interpretation is that, based in the spectral index of the ring emission discussed earlier, the rings are still present but are just too faint in comparison with the more uniformly distributed line emission in the outer shell. The rings are simply washed out at visible wavelengths.
5 Conclusion
The discovery of axisymmetric rings in NGC 1514 completes our perception of it as a planetary nebula formed from an aging binary star system. No longer can NGC 1514 be considered a simple planetary nebula “of a circular form” as Herschel perceived it. While the morphology is very complex, with numerous bubbles contained within the inner shell and rings contained within the outer shell, it joins the family of hourglass-shaped nebulae.
It is likely that more such unexpected structures will be found in PNe as the WISE survey data becomes widely available. As new hourglass objects are found, the formation models can be put to more rigorous tests, and we will gain a deeper understanding of how these mysterious and beautiful objects have come to exist.
References
- Arkhipova (1969) Arkhipova, V. P. 1969, Sov. Phys. & Astr, 12, 1036 (original Russian in AZh, 45, 1312 (1968))
- Aryal et al. (2010) Aryal, B., Rajbahak, C., and Weinberger, R. 2010, MNRAS, 402, 1307
- Balick (1987) Balick, B. 1987, AJ, 94, 671
- Balick & Frank (2002) Balick, B. and Frank, A. 2002, ARA&A, 40, 439
- Cahn et al. (1992) Cahn, J. H., Kaler, J. B., and Stanghellini, L. 1992, A&A Suppl., 94, 399
- Casassus et al. (2007) Casassus, S., Nyman, L.-Å., Dickinson, C., and Pearson, T. J. 2007, MNRAS, 382, 1607
- Chu et al. (1987) Chu, Y.-H., Jacoby, G. H., and Arendt, R. 1987, ApJS, 64, 529
- Chu et al. (2009) Chu, Y.-H., et al. 2009, AJ, 138, 691
- Condon et al. (1998) Condon, J. J., Cotton, W. D., Greisen, E. W., Yin, Q. F., Perley, R. A., Taylor, G. B., and Broderick, J. J. 1998, AJ, 115, 1693
- Corradi et al. (2001) Corradi, R. L. M., Livio, M., Balick, B., Munari, U., and Schwarz, H. E. 2001, ApJ, 553, 211
- Corradi et al. (2003) Corradi, R. L. M., Schönberner, D., Steffen, M., and Perinotto, M. 2003, MNRAS, 340, 417
- Daub (1982) Daub, C. T. 1982, ApJ, 260, 612
- de Boer et al. (1997) de Boer, K. S., Tucholke, H.-J., and Schmidt, J. H. K. 1997, A&A, 317, L23
- de Marco (2009) de Marco, O. 2009, PASP, 121, 316
- Draine & Lee (1984) Draine, B. T. and Lee, H. M. 1984, ApJ, 285, 89
- Feibelman (1997) Feibelman, W. A. 1997, PASP, 109, 659
- Greenstein (1972) Greenstein, J. L. 1972, ApJ, 173, 367
- Hajian et al. (1997) Hajian, A. R., Frank, A., Balick, B., and Terzian, Y. 1997, ApJ, 477, 226
- Herschel (1791) Herschel, W. 1791, Phil. Trans., 81, 71
- Hora et al. (1999) Hora, J. L., Latter, W. B., and Deutsch, L. K. 1999, ApJS, 124, 195
- Hora et al. (2004) Hora, J. L., Latter, W. B., Allen, L. E., Marengo, M., Deutsch, L. K., and Pipher, J. L. 2004, ApJS, 154, 296
- Jaschek & Gómez (1998) Jaschek, C. and Gómez, A. E. 1998, A&A, 330, 619
- Kohoutek (1967) Kohoutek, L. 1967, Bull. Astr. Inst. Czechoslovakia, 18, 103
- Kohoutek & Hekela (1967) Kohoutek, L. and Hekela, J. 1967, Bull. Astr. Inst. Czechoslovakia, 18, 203
- Kohoutek (1968) Kohoutek, L. 1968, Bull. Astr. Inst. Czechoslovakia, 19, 285
- Le Borgne et al. (2003) Le Borgne, J.-F., et al. 2003, A&A, 402, 433
- Liller & Shao (1968) Liller, W. and Shao, C.-Y. 1968, Proc. IAU, 34, 320
- Masci & Fowler (2009) Masci, F. J. and Fowler, J. W. 2009, ASP Conf. Series, 411, 67
- Muthu & Anandarao (2003) Muthu, C. and Anandarao, B. G. 2003, AJ, 126, 2963
- Pazderska et al. (2009) Pazderska, B. M., et al. 2009, A&A, 498, 463
- Sahai et al. (1999) Sahai, R., Dayal, A., Watson, A. M., et al. 1999, AJ, 118, 468
- Santander-García et al. (2008) Santander-García, M., Corradi, R. L. M., Mampaso, A., Morisset, C., Munari, U., Schirmer, M., Balick, B., and Livio, M. 2008, A&A, 485, 117
- Schlegel et al. (1998) Schlegel, D. J., Finkbeiner, D. P., and Davis, M. 1998, ApJ, 500, 525
- Seaton (1980) Seaton, M. J. 1980, QJRAS, 21, 229
- Soker & Rappaport (2000) Soker, N. and Rappaport, S. 2000, ApJ, 538, 241
- Taranova & Shenavrin (2007) Taranova, O. G. and Shenavrin, V. I. 2007, Astronomy Letters, 33, 584 (original Russian in Pis’ma v Astronomicheskiĭ Zhurnal, 33, 657 (2007))
- Tylenda et al. (1991) Tylenda, R., Acker, A., Stenholm, B, Gleizes, F., and Raytchev, B. 1991, A&A Suppl., 89, 77
- Weinberger (1999) Weinberger, R. 1999, Astron. Gesellschaft Abstract Ser., 15, 119
- Whitelock (1985) Whitelock, P. A. 1985, MNRAS, 213, 59
- Wright et al. (2010) Wright, E. L., et al. 2010, AJ, submitted
- Zhang (1995) Zhang, C. Y. 1995, ApJS, 98, 659