University of Mississippi, University, Mississippi, 38677, USA \PACSes \PACSit14.70.FmW bosons \PACSit13.38.BeDecays of W bosons
mass and width measurements at the Tevatron
Abstract
Most recent results of boson mass and width measurements performed by CDF and D are reported. at the center-of-mass energy of 1.96 TeV. Integrated luminosity ranges from 0.2 fb-1 to 1.0 fb-1 depending on the analysis.
1 Introduction
Measurement of the boson mass () provides us with a uniquely powerful key to uncovering the origin of the electroweak symmetry breaking and learing about new physics. A precision measurement of is one of the highest priorities for the Tevatron experiments. measurement combined with precise measurement of the top quark mass (), constrains the mass of the Higgs boson.
On the other hand, the width of the boson () is expected to be insensitive to new physics. Therefore its precise measurement is very important for improving the experimental knowledge of the Standard Model. Currently CDF[1] and D0[2] provide most precise derect measurements of both [3, 4] and [7, 8] For these measurements CDF uses both electron and muon decay channels of the , while D0 uses only electron channel.
2 Identification of Electrons and Muons
Electrons are identified as an electromagnetic (EM) cluster reconstructed with a simple cone algorithm. To reduce the background of jets faking electrons, electron candidates are required to have a large fraction of their energy deposited in the EM section of the calorimeter and pass energy isolation and shower shape requirements. Electron candidates are classified as tight if a track is matched spatially to EM cluster and if the track transverse momentum is close to the transverse energy of the EM cluster. In CDF electrons are reconstructed both in the central calorimeter and plug calorimeter () while electrons in D0 are reconstructed in the central and endcap calorimeters ( and ). Here , and is the polar angle with respect to the proton direction. Both CDF and D0 require tight electrons in the central calorimeter () for candidates. Electron energies are measured with the calorimeter, while electron direction is measured with tracking detectors, using tracks that are matched to electron cluster in the calorimeter.
Muons are identified by a track in the muon system matched to a track in the central tracking system. Measurements include the muons reconstructed in the central muon extension sub-detector which extends the coverage from to
3 W Mass
is measured using three transverse kinematic variables: the transverse mass , the lepton ( ) and neutrino () transverse momentum distributions, where is the opening angle between the electron(muon) and neutrino momenta in the plane transverse to the beam. Neutrino transverse momentum () is inferred from the imbalance of transverse energy. We also call it missing (MET).
A sophisticated parametrized fast Monte Carlo simulation is used for modeling these variables as a function of . Fast simulation includes models of electron, recoil system, and backgrounds. Electron efficiencies, resolution and energy scale parameterizations are tuned to data. Recoil system represents energy deposited in the calorimeter from all sources except the electron(s). Recoil system consists of three major components: hard recoil (particles that collectively balance the of the W of Z boson), underlying event, and additional interactions. Contribution from the third component depends on the instantaneous luminosity. Hard recoil is modeled using full detector simulation, while the other two componenets are described by real data events. Full recoil model is tuned to data, using imbalance between Z boson momentum measured with electrons and with recoil system. Sources of backgrounds to events include , QCD, and prccesses.
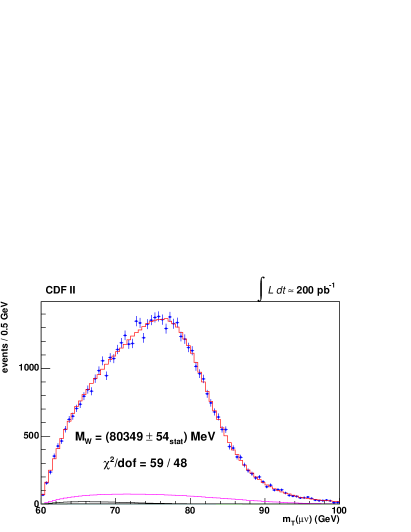
is extracted from a binned maximum-likelihood fit between the data and simulation. is measured with variable using the same analysis framework as . Fig. 1 shows a comparison between data and fast simulation. It also shows final results from D0 and CDF along with other measurements and combinations D0 result agrees with the world average and the individual measurements and is more precise than any other measurement from a single measurement. Fig. 2 shows comparison between data and fast simulation for CDF measurement.


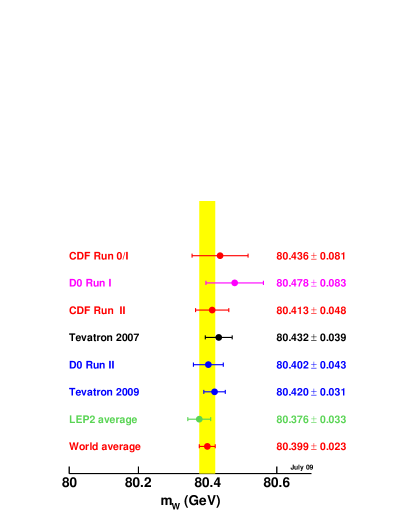
Bottom right: summary of the measurements of the boson mass and their average. The result from the Tevatron corresponds to the values which includes corrections to the same W boson width and PDFs. The LEP II results are from [5]. An estimate of the world average of the Tevatron and LEP results is made assuming no correlations between the Tevatron and LEP uncertainties.


Dominant uncertainties in measurements come from lepton energy scale measurements. To first order fractional error on the lepton energy scale translates to fractional error on the W mass[6].
D0 determines electron energy scale using high electrons from decays. Precision of such calibration is limited mostly by the size of the sample.
CDF relies on tracking detector for both electron and muon energy scale calibration. First tracking detector is calibrated using events. invariant mass is measured as a function of muon momentum. Fig. 3 shows the correction needed to make measured mass to be at its PDG value (overall offset) and independent of muon momentum (slope). This correction was implemented in the simulation by adjusting the energy-loss model. Then tracker calibration is transported to the calorimeter using electrons near the peak of the E/p distribution, shown also in Fig. 3. Tables 1 and 2 show uncertainties for measurements by D0 and CDF respectively.
| Source | |||
| Experimental | |||
| Electron energy calibration | 34 | 34 | 34 |
| Electron resolution model | 2 | 2 | 3 |
| Electron energy offset | 4 | 6 | 7 |
| Electron energy loss model | 4 | 4 | 4 |
| Recoil model | 6 | 12 | 20 |
| Electron efficiencies | 5 | 6 | 5 |
| Backgrounds | 2 | 5 | 4 |
| Experimental Subtotal | 35 | 37 | 41 |
| Production Model | |||
| 10 | 11 | 11 | |
| QED | 7 | 7 | 9 |
| Boson | 2 | 5 | 2 |
| Production Model Subtotal | 12 | 14 | 14 |
| Statistical | 23 | 27 | 23 |
| Total | 37 | 40 | 43 |
| Source | |||
|---|---|---|---|
| ,,common | ,,common | ,,common | |
| Lepton Scale | 30,17,17 | 30,17,17 | 30,17,17 |
| Lepton Resolution | 9,3,0 | 9,3,0 | 9,5,0 |
| Recoil Scale | 9,9,9 | 17,17,17 | 15,15,15 |
| Recoil Resolution | 7,7,7 | 3,3,3 | 30,30,30 |
| Efficiency | 3,1,0 | 5,6,0 | 16,30,0 |
| Lepton Removal | 8,5,5 | 0,0,0 | 16,10,10 |
| Backgrounds | 8,9,0 | 9,19,0 | 7,11,0 |
| 3,3,3 | 9,9,9 | 5,5,5 | |
| 11,11,11 | 20,20,20 | 13,13,13 | |
| QED | 11,12,11 | 13,13,13 | 9,10,9 |
| Total Systematic | 39,27,26 | 45,40,35 | 54,46,42 |
| Statistical | 48,54,0 | 56,68,0 | 57,66,0 |
| Total | 62,60,26 | 73,77,35 | 79,80,42 |


4 W Width
Although and measurements are performed with the same method and both rely on distribution, they are mostly sensitive to different features of the latter. is mostly sensitive to the position of the Jacobian peak. is mostly sensitive to the tail of the distribution. To first order is proportional to the fraction of events in the tail. Fit for is performed in the high tail region (90-200 GeV for both CDF and D0). This region is sensitive to the Breit-Wigner line-shape and less sensitive to the detector resolution.
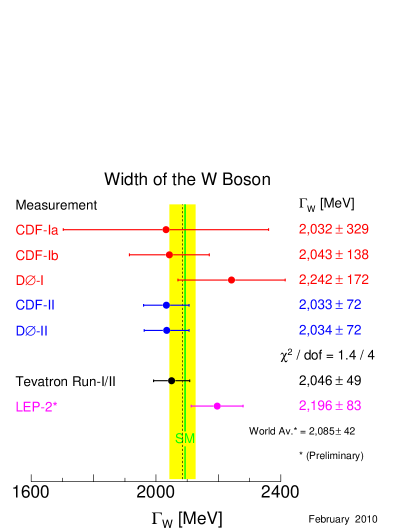
Fig. 4 shows distributions from CDF and D0 as well as final results compared with other measurements and combinations. D0 result is GeV. CDF result is GeV. Combined Tevatron average is GeV [9]. Tables 3 and 4 give the detailed breakdown of uncertainties for measurements at D0 and CDF.


| Source | (MeV) |
| Electron energy scale | 33 |
| Electron resolution model | 10 |
| Recoil model | 41 |
| Electron efficiencies | 19 |
| Backgrounds | 6 |
| 20 | |
| Electroweak radiative corrections | 7 |
| Boson | 1 |
| 5 | |
| Total Systematic | 61 |
| Statistical | 39 |
| Total | 72 |
| Source | common | ||
|---|---|---|---|
| Lepton Scale | 21 | 17 | 12 |
| Lepton Resolution | 31 | 26 | 0 |
| Simulation | 13 | 0 | 0 |
| Recoil | 54 | 49 | 0 |
| Lepton ID | 10 | 7 | 0 |
| Backgrounds | 32 | 33 | 0 |
| 7 | 7 | 7 | |
| 20 | 20 | 20 | |
| QED | 10 | 6 | 6 |
| 9 | 9 | 9 | |
| Total Systematic | 79 | 71 | 27 |
| Statistical | 60 | 67 | 0 |
| Total | 99 | 98 | 27 |
References
- [1] \BYD. Acosta et al. (CDF Collaboration) \INPhys. Rev. D710320012005
- [2] \BYV.M. Abazov et al. (DO Collaboration) \INNucl. Instrum. Methods in Phys. Res. A5654632006
- [3] \BYV. M. Abazov et al. (D0 Collaboration) \INPhys. Rev. Lett.1031418012009
- [4] \BYT. Aaltonen et al. (CDF Collaboration) \INPhys. Rev. Lett.991518012007; \INPhys. Rev.D771120012008.
- [5] \BYThe LEP Electroweak Working Group CERN-PH-EP/2008-20, arXiv:0811.4682 (hep-ex).
- [6] \BYAshutosh V. Kotwal and Jan Stark \INAnnual Review of Nuclear and Particle Science58147-175 November 2008.
- [7] \BYV. M. Abazov et al. (D0 Collaboration) \INPhys. Rev. Lett.1032318022009.
- [8] \BYT. Aaltonen et al. (CDF Collaboration) \INPhys. Rev. Lett.1000718012008.
- [9] \BYTevatron Electroweak Working group FERMILAB-TM-2460-E.