Episodic disk accretion in the halo of the ‘old’ Pre-Main Sequence cluster Chamaeleontis††thanks: This paper includes data gathered with the 6.5 meter Magellan Telescopes located at Las Campanas Observatory, Chile.
Abstract
We present multi-epoch medium-resolution observations of two M4.5 candidate members in the halo of the 8 Myr Chamaeleontis open cluster. Over six months of observations both stars exhibited variations in their H line profiles on timescales of days to months, with at least one episode of substantial activity attributable to accretion from a circumstellar disk. We derive an accretion rate 10-8.7 M☉ yr-1 for this event, with a rate of 10-10.6 M☉ yr-1 in quiescence. Episodic accretion like that observed here means existing surveys of accreting Weak-lined T-Tauri Stars in young clusters are likely incomplete and that gas dissipation timescales calculated from the fraction of accreting objects are underestimates.
keywords:
stars: pre-main sequence – stars: low-mass – accretion, accretion disks – open clusters and associations: individual: Chamaeleontis – techniques: spectroscopic1 Introduction
The open cluster Chamaeleontis is one of the closest (94.3 pc) and youngest (8 Myr) stellar aggregates in the Solar neighbourhood. Nearby, isolated groups such as Cha are ideal laboratories for investigating the dynamical evolution of young star clusters, in particular the influence that dynamics have had on the evolution of protoplanetary disks. Young clusters show a steady decline in the number of stars having disks and signatures of accretion with age (Mohanty et al., 2005; Jayawardhana et al., 2006). By an age of 5 Myr, 90–95% of all young cluster members have stopped accreting material at a significant rate, yet 20% of objects retain enough dust in their disks to produce a mid-IR excess. The mechanism responsible for these two different timescales is still uncertain (Fedele et al., 2010). Cha has already been shown to have both an excess of stars with accretion and stars with detectable disks compared to clusters of similar age (Haisch et al., 2001; Sicilia-Aguilar et al., 2009). The cluster also appears to have an Initial Mass Function deficient in low-mass objects (Lyo et al., 2004). Fedele et al. (2010) is the latest study to point out that dynamical evolution has probably dispersed a large fraction of the low-mass members to radii beyond that currently surveyed (see also Moraux et al., 2007; Murphy et al., 2010). Depending on the properties of the dispersed members, it is possible that the current membership may be biased towards IR-excess and strong H emitting sources. By investigating the disk and accretion properties of any new dispersed members of Cha we can hope to gain a more unbiased view of the cluster as a whole, as well as addressing any influence dynamical interactions have had on disk evolution.
In Murphy et al. (2010, hereafter Paper i) we presented the results of our search for the putative halo of low-mass objects surrounding Cha. From photometry, proper motions and multi-epoch spectra we identified 4 probable and 3 possible members, including two M4.5 stars which exhibited large variations in their H emission line strengths. These stars, 2MASS 080148608058052 (hereafter 2MASS 0801) and 2MASS 082029758003259 (hereafter 2MASS 0820) are the subject of this letter.
2 Multi-epoch spectroscopy
As part of our continued investigation into Cha we obtained multi-epoch, medium resolution spectroscopy of 2MASS 0801 and 2MASS 0820 with the WiFeS instrument at the ANU 2.3 m telescope (see Paper i for more details). We obtained 9 observations of 2MASS 0801 over 2010 January–June and 13 epochs of 2MASS 0820. In addition to H emission both stars recurrently showed He i 5876 Å, 6678 Å and Na i D emission, often associated with accretion. Details of these observations are given in Table 1.
| UTC of | H EW | width | RV | Other |
|---|---|---|---|---|
| observation | [Å] | [km s-1] | [km s-1] | lines |
| 2MASS 08018058 | ||||
| 2010 Jan 25 13:57 | 6 | 152 | 13.7 | |
| 2010 Jan 27 12:35 | 6 | 148 | 23.7 | |
| 2010 Jan 28 12:11 | 6 | 153 | 17.8 | He i |
| 2010 Feb 19 11:45 | 20 | 346 | 21.3 | He i |
| 2010 Apr 28 09:04 | 6 | 176 | 15.7 | |
| 2010 Apr 29 09:05 | 6 | 160 | 20.9 | |
| 2010 Apr 30 10:15 | 27 | 324 | 23.0 | He i, Na d |
| 2010 May 01 13:14 | 7 | 178 | 18.5 | |
| 2010 Jun 03 09:05 | 7 | 159 | 20.0 | |
| 2MASS 08208003 | ||||
| 2010 Jan 25 14:45 | 23 | 331 | 17.2 | He i |
| 2010 Feb 19 10:28 | 40 | 425 | 16.5 | He i |
| 2010 Feb 20 10:27 | 24 | 260 | 18.8 | He i |
| 2010 Apr 27 12:05 | 27 | 238 | 14.1 | He i, Na d |
| 2010 Apr 28 10:14 | 17 | 263 | 18.9 | |
| 2010 Apr 28 15:23 | 15 | 262 | 18.7 | |
| 2010 Apr 29 10:16 | 17 | 282 | 20.6 | |
| 2010 Apr 29 15:05 | 16 | 275 | 21.4 | |
| 2010 Apr 30 09:05 | 17 | 237 | 20.0 | |
| 2010 Apr 30 11:30 | 15 | 224 | 17.9 | |
| 2010 Apr 30 12:50 | 16 | 210 | 18.4 | |
| 2010 May 01 12:02 | 17 | 262 | 17.6 | |
| 2010 Jun 03 10:15 | 17 | 215 | 18.9 | |
| 2MASS 08208003 (Magellan/MIKE) | ||||
| 2010 May 11 23:41 | 22 | 238 | 17.4 | He i |
2.1 Accretion diagnostics
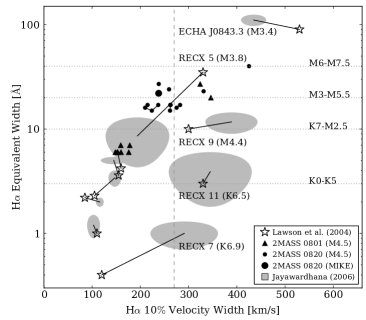
To trace any accretion across our observations we analysed the time evolution of the H equivalent width and velocity width of the H line at 10% intensity (). Recently Nguyen et al. (2009) have shown that due to the strong dependence of on the shape of the H line profile, the Ca ii 8662 Å line flux is perhaps a more reliable quantitative diagnostic of accretion rate. The H width has a well-established record as an accretion indicator and despite the caveats put forward by Nguyen et al. (2009), we use it here for comparison to previous studies and the fact that our wavelength coverage does not extend past 7100 Å. Figure 1 shows an EW- diagram for our observations of 2MASS 0801 and 0820, with Cha members observed by Jayawardhana et al. (2006) and Lawson et al. (2004) for comparison. Measurements of the EW and for each star are listed in Table 1. We estimate an uncertainty of 1 Å for the EWs and 10 km s-1 in , primarily due to uncertainties in defining the pseudo-continuum around the broad H lines at this spectral resolution. Both stars show substantial variation in the EW- space, with the scatter more pronounced in 2MASS 0820.
Lawson et al. (2004) observed the cluster at high-resolution and found a similar EW variation of 2–3 for RECX 5, 9 and 11 when compared to the discovery measurements of Mamajek et al. (1999). Jayawardhana et al. (2006) obtained 3–8 epochs of Magellan/MIKE echelle data for 11 Cha members during 2004 December – 2005 March. They report variations in EW and in some stars similar to those seen in 2MASS 0801 and 0820 with 35% and 50% EW variations in the maximal cases. In Figure 1 we compare the measurements of these two groups. In general there is good agreement between the two sets of measurements, with RECX 9, RECX 11 and ECHA J0843.3 all clearly accretors in both studies. RECX 7 is a known non-accreting SB2 spectroscopic binary (Lyo et al., 2003), which explains the broad line width but low EW in the Jayawardhana et al. observations. Lawson et al. (2004) classify RECX 5 as accreting with from their 2002 observation. Jayawardhana et al. however failed to detect any accretion, with only one of their five observations showing a broadened H line. The blue bump seen in the 2004 December spectrum could mean RECX 5 is sporadically accreting at low levels and Lawson et al. observed a strong outburst of 10-10 M☉ yr-1 accretion in 2002, or the star is chromospherically active and underwent a period of strong activity during their observations. Chromospheric activity as a possible mechanism for the variations seen in our spectra is discussed in detail in §2.2.
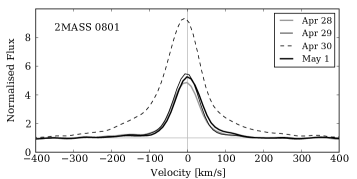
Several sets of 2MASS 0820 spectra were taken during the same nights. They reveal a scatter of up to 25 km s-1 in and several Angstroms in EW, i.e. larger than the instrumental errors. While both stars generally lie on the non-accreting side of the 270 km s-1 criterion defined by White & Basri (2003), they each make several excursions into the accreting region of the diagram, meeting both the EW and criteria for accreting Classical T-Tauri stars (CTTS). This is similar to the behaviour of RECX 5 during 2002–2005. The timescale of these excursions appears to be of the order hours to days. In the case of 2MASS 0801 both EW and increase dramatically on Apr 30, before returning to quiescent levels the next night. A similar level of activity is seen on 2010 Feb 19. Figure 2 shows the evolution of the 2MASS 0801 H profile during the 2010 April event. We obtained spectra before, during and after the event. The pre- and post- event line profiles are remarkably similar, with broad wings developing during the Apr 30 outburst, giving rise to a velocity width of km s-1. The EW similarly quadruples to 27 Å. The central velocity of the line profile also evolves with time (see Figure 4). 2MASS 0820 appears to have 3 tiers of activity: a base level at Å, a higher level at Å, then increasing to Å and km s-1 on 2010 Feb 19.
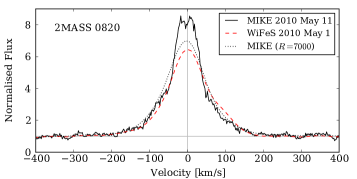
In addition to WiFeS spectroscopy we obtained a Magellan/MIKE spectrum of 2MASS 0820 on 2010 May 11. The H velocity profile is shown in Figure 3 with a contemporaneous WiFeS spectrum. The EW and of the higher resolution spectrum agree well with the WiFeS values (see Figure 1). The velocity profile shows some self-absorption in the line center as well as a slight excess of blueshifted emission at km s-1. To test how our lower resolution WiFeS spectra affect measurements of EW and we smoothed the MIKE spectrum to and re-measured and the EW. In both parameters the smoothed value was similar to that measured from the contemporaneous WiFeS spectrum, i.e. smaller than the original value. We are thus likely underestimating the EW and from our WiFeS observations.
2.2 H velocity profile variations
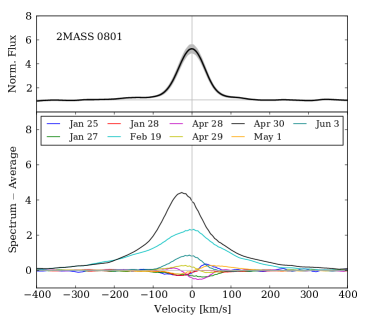
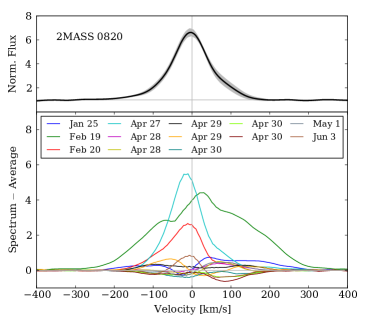
As well as the bulk quantities of H EW and we also investigated the variation in the shape of the H velocity profile over our observations. The top panels in Figure 4 show the average quiescent spectrum for each star, constructed using several (7–9) non-outburst spectra. The standard deviation of these spectra is also shown. 2MASS 0820 shows increased scatter around the mean profile at km s-1 (and to a lesser extent at 100 km s-1). This is due to a variable-strength red shifted component at this velocity present in some of the observations. The bottom panel shows the variation in the residual spectra – the difference between the individual spectra and the mean spectrum. Immediately apparent are the broad residual profiles, tracing velocities up to 200–300 km s-1. The Feb 19 epoch of 2MASS 0820 shows a residual velocity profile reaching to km s-1, with four distinct components visible and a large red asymmetry. Velocity shifts in the peaks of the residual spectra are present at up to several tens of km s-1.
Instead of invoking accretion, can chromospheric activity also explain the strong and varying H profiles? The work of Montes et al. (1998) has shown that in some WTTS the H line profile cannot be fitted by a single gaussian and two components are necessary: a narrow gaussian of FWHM 100 km s-1 and a much broader component with FWHM 130–470 km s-1, sometimes offset in wavelength from the narrow component. They attribute these line profiles to micro-flaring occuring in the chromospheres of the stars. Micro-flares are frequent, short duration events and have large-scale motions that could explain the broad wings observed in the lines and the residual spectra in Figure 4. Stauffer et al. (1997) observe a similar effect in several of their 30 Myr IC 2391/2602 and 100 Myr Pleiades targets. Both our stars show He i 6678 Å in emission at their peak H levels. Strong He i 6678 Å emission is an accretion diagnostic as it is generally only present in low-levels (1 Å) in older chromospherically active stars (Gizis et al., 2002). While we do detect strong (1.5 Å) emission in the April 30 outburst spectrum of 2MASS 0801, at all other epochs where we detect the line it is weak (0.5 Å). Furthermore, Martín & Ardila (2001) detect strong (1–4 Å) He i 6678 Å emission during a flare of the old M9 dwarf LHS 2065.
Given the weak He i line strengths generally observed in our stars and the simple gaussian-like profiles of the residual spectra we do not have strong evidence for ongoing accretion. Chromospheric activity is a much more likely explanation for the observed line profiles and EW/ variations. Only the February 19 spectrum of 2MASS 0820 shows a broad, asymmetric residual characteristic of accretion. Multiple components are present at velocities up to 300 km s-1, presumably tracing the ballistic infall of material from the inner edge of the disk onto the stellar surface.
2.3 Accretion rates
Natta et al. (2004) have shown that a good correlation exists between the H velocity width and the mass accretion rate across a large range of masses, 0.04–0.8 M☉. If we assume the H emission is a result of accretion we can use the Natta et al. (2004) relation to derive the mass accretion rate () without the need to perform detailed model fits to the line profile. We derive a quiescent accretion rate for 2MASS 0801 of M☉ yr-1, where the uncertainty reflects the variation in and uncertainties in the relation parameters. For 2MASS 0820 the quiescent scatter is larger and M☉ yr-1. For the event of February 19 we calculate an accretion rate of M☉ yr-1. This is similar to that derived for ECHA J0843.3 from detailed H profile modeling by Lawson et al. (2004). The Natta et al. (2004) relation gives an accretion rate 1.3 dex larger for the corresponding velocity given by Lawson et al. According to Nguyen et al. (2009) the large scatter in this average relation probably reflects object-to-object variation (possibly due to evolutionary effects) rather than the effects of variability on the usually single-epoch observations as previously thought (e.g. Scholz & Jayawardhana, 2006). As previously mentioned, the effect of our lower spectral resolution means we have likely underestimated so our derived accretion rates are probably even higher. 2MASS 0820 shows a 10–80 jump in accretion rate between quiescence and its active phase. Using the Natta et al. relation on the high-resolution RECX 5 velocities of Lawson et al. (2004) and Jayawardhana et al. (2006) results in a similar 20 change in accretion rate. Assuming the scatter in quiescent velocities is a result of the accretion rate varying with time, the variations are similar in magnitude to those seen in the 10 Myr CTTS TW Hya (Eisner et al., 2010) and lower-mass young brown dwarfs (Scholz & Jayawardhana, 2006; Stelzer et al., 2007).
2.4 Continuum veiling in 2MASS 08018058
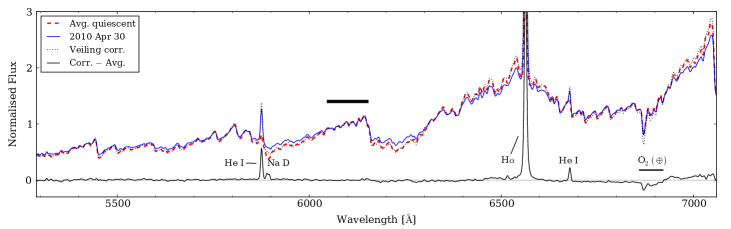
The April 30 spectrum of 2MASS 0801 exhibits a Li i 6708 Å equivalent width smaller than in quiescence. This is the effect of continuum veiling, where enhanced continuum emission fills in absorption lines and reduces the measured EW. Magnetospheric infall models predict the presence of veiling from accretion shocks, as matter from the accretion flow reaches the stellar surface (e.g. Muzerolle et al., 2003). However, this is probably not the case for 2MASS 0801. Figure 5 shows the full WiFeS spectrum for April 30 compared to the average 2MASS 0801 quiescent spectrum. Veiling is readily apparent as an enhancement of the continuum in the 6200 Å CaH band and a corresponding depression of the continuum around H (due to the normalisation at 6100 Å). Using the quiescent spectrum as a reference we find the veiling at 6100 Å is 0.22. The observed flux was veiling-corrected using the following prescription:
| (1) |
where is the Planck blackbody function and K. With the correction applied the continuum and Li i 6708 Å EW once again match the quiescent levels and the only excess is now due to line emission from H, He i and Na d. The H EW is increased from 20 Å to the 27 Å given in Table 1. Given the low temperature of the veiling blackbody the origin of the veiling emission is most likely warm circumstellar dust rather than an accretion shock, which generally emits at much higher temperatures (5000–20000 K). 2MASS 0801 appears to have an excess of 0.15 mag in and 0.05 mag in relative to 2MASS 0820 and other mid-M members which could indicate the presence of circumstellar material. The star inhabits a region of colour space close to two strong accretors known to possess disks – RECX 11 and ECHA J0843.3 have Class II SEDs, with significant excess at wavelengths greater than 3 m (Sicilia-Aguilar et al., 2009).
Reddening (i.e. interstellar dust) could also explain the colour excesses. The Schlegel et al. (1998) reddening along a line of sight to 2MASS 0801 is mag and the star sits on a ridge of prominent dust emission in the IRAS maps. It is possible that the stellar colours are affected by reddening if the dust lies in front of the star. From optical polarisation studies the distance to the ridge has been estimated to be 115 pc (Cleary et al., 1979), 40% larger than the 83 pc estimated dynamical distance to 2MASS 0801 from Paper i. An improved distance to the star will be necessary to resolve the reddening issue.
2.5 Radial velocity variations
Our multi-epoch observations provide insight into any radial velocity variations in the two stars. The measurement of velocities from the WiFeS spectra is described in Paper i and the resultant RV values are given in Table 1. From 260 observations of M spectral type velocity standards we have established that WiFeS is capable of an RMS RV precision of 2 km s-1. The standard deviation of the 13 RV measurements of 2MASS 0820 is 1.9 km s-1, consistent with a flat velocity curve. The RV from the MIKE measurement, 17.4 0.5 km s-1, is also consistent with the mean WiFeS value of 18.4 km s-1 within the errors. In contrast, 2MASS 0801 has a standard deviation of 3.3 km s-1 from 9 measurements and an RMS variation nearly five times larger than 2MASS 0820.
In Paper i we suggested that in conjunction with its elevated position in the cluster CMD the RV variation of 2MASS 0801 suggested binarity. Any such companion would need to be significantly cooler and fainter as we do not detect a second set of lines at any epoch. The timescale of the RV variation suggests a period of order days to weeks with a velocity amplitude of less than a few tens of km s-1. Without high-resolution imaging we cannot constrain the orbital semi-major axis other than to say any companion is not resolved by contemporary imaging surveys such as DSS2 and 2MASS. High resolution spectroscopy and adaptive optics imaging (e.g. Köhler & Petr-Gotzens, 2002) will be necessary to resolve any companion.
Another possibility is that the RV variation is induced by activity or surface features co-rotating with the star. Martín et al. (2006) detect a 3.5 km s-1 amplitude, 3.7 hr periodicity in the optical RV data of the M9 brown dwarf LP 94420, which they attribute to rotationally modulated inhomogeneous surface features. Using a toy model with a single spot 100200 K cooler than the photosphere covering 10% of the stellar surface, Reiners et al. (2010) can generate a velocity amplitude of a few km s-1 for stars of 2800–5700 K, similar to the signal seen in LP 94420 and 2MASS 0801. We do not find any correlation between the RV and either the H EW or so any velocity variation is probably driven by rotation not chromospheric flaring. The rotational period of 2MASS 0801 has not been measured but is likely on the order of days, similar to the other late-type members of Cha (Lawson et al., 2001) and the timescale of observed RV variation.
3 Discussion
Our results show that H variability in 8 Myr PMS stars can be substantial on both short (hours–days) and long (months) timescales. This variation is probably driven primarily by chromospheric activity, which can generate broad H profiles mimicking accretion over short timescales. However, we also have evidence for at least one accretion event in 2MASS 0820 which requires confirmatory follow-up observations. Additional mid-IR observations will be necessary to detect the presence of any circumstellar disk around the star feeding the accretion. Assuming the duty-cycle of episodic accretion is low, single-epoch surveys of accreting objects, especially in the critical age range 5–10 Myr when inner disks are being cleared and giant planet formation takes place, are likely missing a large fraction of accreting objects. Gas depletion timescales derived from the fraction of accretors are therefore likely underestimates. This may provide another explanation for the difference in characteristic timescales between mass accretion and dust dissipation found by Fedele et al. (2010, 2.3 Myr and 3 My respectively), without the need to invoke planet formation and/or migration in the inner disk as a possible mechanism for halting accretion. A larger survey of the disk and accretion properties of outlying Cha members, combined with more detailed investigation of the true accreting fraction of PMS clusters from multi-epoch surveys is needed to resolve this discrepancy.
Acknowledgments
Australian access to the Magellan Telescopes was supported through the National Collaborative Research Infrastructure Strategy of the Australian Federal Government. DDRB acknowledges financial support from the Access to Major Research Facilities Program, which is supported by the Commonwealth of Australia under the International Science Linkages Program.
References
- Cleary et al. (1979) Cleary M. N., Haslam C. G. T., Heiles C., 1979, A&AS, 36, 95
- Eisner et al. (2010) Eisner J. A., Doppmann G. W., Najita J. R., McCarthy D., Kulesa C., Swift B. J., Teske J., 2010, ApJ, 722, L28
- Fedele et al. (2010) Fedele D., van den Ancker M. E., Henning T., Jayawardhana R., Oliveira J. M., 2010, A&A, 510, A72
- Gizis et al. (2002) Gizis J. E., Reid I. N., Hawley S. L., 2002, AJ, 123, 3356
- Haisch et al. (2001) Haisch Jr. K. E., Lada E. A., Lada C. J., 2001, ApJ, 553, L153
- Jayawardhana et al. (2006) Jayawardhana R., Coffey J., Scholz A., Brandeker A., van Kerkwijk M. H., 2006, ApJ, 648, 1206
- Köhler & Petr-Gotzens (2002) Köhler R., Petr-Gotzens M. G., 2002, AJ, 124, 2899
- Lawson et al. (2001) Lawson W. A., Crause L. A., Mamajek E. E., Feigelson E. D., 2001, MNRAS, 321, 57
- Lawson et al. (2004) Lawson W. A., Lyo A.-R., Muzerolle J., 2004, MNRAS, 351, L39
- Lyo et al. (2004) Lyo A.-R., Lawson W. A., Feigelson E. D., Crause L. A., 2004, MNRAS, 347, 246
- Lyo et al. (2003) Lyo A.-R., Lawson W. A., Mamajek E. E., Feigelson E. D., Sung E.-C., Crause L. A., 2003, MNRAS, 338, 616
- Mamajek et al. (1999) Mamajek E. E., Lawson W. A., Feigelson E. D., 1999, ApJ, 516, L77
- Martín & Ardila (2001) Martín E. L., Ardila D. R., 2001, AJ, 121, 2758
- Martín et al. (2006) Martín E. L., Guenther E., Zapatero Osorio M. R., Bouy H., Wainscoat R., 2006, ApJ, 644, L75
- Mohanty et al. (2005) Mohanty S., Jayawardhana R., Basri G., 2005, ApJ, 626, 498
- Montes et al. (1998) Montes D., Fernandez-Figueroa M. J., de Castro E., Cornide M., Poncet A., Sanz-Forcada J., 1998, in R. A. Donahue & J. A. Bookbinder ed., Cool Stars, Stellar Systems, and the Sun Vol. 154 of ASP Conf. Series. p. 1516
- Moraux et al. (2007) Moraux E., Lawson W. A., Clarke C., 2007, A&A, 473, 163
- Murphy et al. (2010) Murphy S. J., Lawson W. A., Bessell M. S., 2010, MNRAS, 406, L50
- Muzerolle et al. (2003) Muzerolle J., Hillenbrand L., Calvet N., Briceño C., Hartmann L., 2003, ApJ, 592, 266
- Natta et al. (2004) Natta A., Testi L., Muzerolle J., Randich S., Comerón F., Persi P., 2004, A&A, 424, 603
- Nguyen et al. (2009) Nguyen D. C., Scholz A., van Kerkwijk M. H., Jayawardhana R., Brandeker A., 2009, ApJ, 694, L153
- Reiners et al. (2010) Reiners A., Bean J. L., Huber K. F., Dreizler S., Seifahrt A., Czesla S., 2010, ApJ, 710, 432
- Schlegel et al. (1998) Schlegel D. J., Finkbeiner D. P., Davis M., 1998, ApJ, 500, 525
- Scholz & Jayawardhana (2006) Scholz A., Jayawardhana R., 2006, ApJ, 638, 1056
- Sicilia-Aguilar et al. (2009) Sicilia-Aguilar A., Bouwman J., Juhász A., Henning T., Roccatagliata V., Lawson W. A., Acke B., Feigelson E. D., Tielens A. G. G. M., Decin L., Meeus G., 2009, ApJ, 701, 1188
- Stauffer et al. (1997) Stauffer J. R., Hartmann L. W., Prosser C. F., Randich S., Balachandran S., Patten B. M., Simon T., Giampapa M., 1997, ApJ, 479, 776
- Stelzer et al. (2007) Stelzer B., Scholz A., Jayawardhana R., 2007, ApJ, 671, 842
- White & Basri (2003) White R. J., Basri G., 2003, ApJ, 582, 1109