Spectral Index as a Function of Mass Accretion Rate in Black Hole Sources. Monte-Carlo Simulations and an Analytical Description
Abstract
We present herein a theoretical study of correlations between spectral indexes of X-ray emergent spectra and mass accretion rate () in black hole (BH) sources, which provide a definitive signature for BHs. It has been firmly established, using the Rossi X-ray Timing Explorer (RXTE) in numerous BH observations during hard-soft state spectral evolution, that the photon index of X-ray spectra increases when increases and, moreover, the index saturates at high values of . In this Paper, we present theoretical arguments that the observationally established index saturation effect vs mass accretion rate is a signature of the bulk (converging) flow onto the black hole. Also, we demonstrate that the index saturation value depends on the plasma temperature of converging flow. We self-consistently calculate the Compton cloud (CC) plasma temperature as a function of mass accretion rate using the energy balance between energy dissipation and Compton cooling. We explain the observable phenomenon, index- correlations using a Monte-Carlo simulation of radiative processes in the innermost part (CC) of a BH source and we account for the Comptonization processes in the presence of thermal and bulk motions, as basic types of plasma motion. We show that, when increases, BH sources evolve to high and very soft states (HSS and VSS, respectively), in which the strong blackbody-like and steep power-law components are formed in the resulting X-ray spectrum. The simultaneous detections of these two components strongly depends on sensitivity of high energy instruments, given that the relative contribution of the hard power-law tail in the resulting VSS spectrum can be very low, which is why, to date RXTE observations of the VSS X-ray spectrum has been characterized by the presence of the strong BB-like component only. We also predict specific patterns for high-energy efold (cutoff) energy () evolution with for thermal and dynamical (bulk) Comptonization cases. For the former case, monotonically decreases with , in the latter case, the decrease is followed by its increase at high values of . The observational evolution of vs can be one more test for the presence of a converging flow effect in the formation of the resulting spectra in the close vicinity of BHs.
1 Introduction
A study of the characteristic changes in spectral and variability properties of X-ray binaries has proven to be a valuable source of information on the Physics governing the accretion processes and on the fundamental parameters of black hole (BH) sources. BH observational appearance is conventionally described in terms of BH state classification (see Remillard & McClintock, 2006; Belloni, 2005; Klein-Wolt & van der Klis, 2008, for different definitions of BH states). We adopt the following BH state classification for five major BH states: the quiescent, low-hard (LHS), intermediate (IS), high-soft (HSS) and very soft states (VSS). When a BH transient goes into outburst, it leaves the quiescent state and enters the LHS, a low luminosity state with the energy spectrum dominated by a Comptonization component combined (convolved) with a weak thermal component. The photon spectrum in the LHS is presumably a result of Comptonization (upscattering) of soft photons, originating from a relatively weak accretion disk, off electrons of the hot ambient plasma [see e.g. Sunyaev & Titarchuk (1980), hereafter ST80]. The HSS photon spectrum is characterized by a prominent thermal component which is probably a signature of a strong emission coming from a geometrically thin accretion disk. A weak power-law component is also present at the level of not more than 20% of the total source flux.
Timing and spectral properties of an accreting BH are tightly correlated for a number of BH sources [see Vignarca et al. (2003) and a comprehensive study of these correlations was done by Shaposhnikov & Titarchuk (2009), Titarchuk & Seifina (2009), hereafter ST09 and TS09, respectively]. Correlations between the spectral hardness (photon index) and the characteristic frequencies of the quasi-periodic oscillations (QPOs) observed in the lightcurves of BH sources has been proposed to use as a tool to determine a BH mass (Titarchuk, & Fiorito, 2004, hereafter TF04). Remillard & McClintock (2006) demonstrated and then ST09 confirmed that there is a correlation between values QPO frequencies and the disk flux, namely mass accretion rate in the disk, for a number of BH candidates (BHCs). Moreover, ST09, TS09 and Seifina & Titarchuk (2010), hereafter ST10, also found strong correlations between spectral index and , where is dimensionless mass accretion rate in units of critical mass accretion rate , in 19 spectral transition episodes from 10 BH sources observed with the Rossi X-ray Timing Explorer (RXTE). ST09 combine these index-QPO and index- correlations to measure BH masses in 7 BH sources. For some of these sources, (i.e. H 1743-322, Cyg X-1, XTE 1650-500, GX 339-4 and XTE J1859-226) this new ST09 method provides a much better precision than conventional dynamical methods (see ST09). In addition TS09 and ST10 using index- correlations evaluate BH masses in GRS 1915+105 and SS 433 respectively.
The index-QPO and index- correlation has a specific shape characterized by a rise part followed by the saturation plateau. The ST09 method is based on scaling (sliding) the correlation pattern related to a reference source vs that of a given source for which a BH mass is determined. This determination can be only done for this pair of the sources if the saturation values of index and inclination of the rising part are the same for both. Thus, the correlation patterns need to be self-similar to implement this scaling and, finally, to obtain a BH mass for a given source. Using results from Laurent & Titarchuk (1999), hereafter LT99, TF04 who were the first to suggest a model for the index- correlation observed in BHCs, we further explore the model of index- correlation and present a thorough modeling of this correlation using Monte Carlo simulations for a wide range of basic model parameters. We also investigate the possibility that the shape of the correlation pattern provides a direct signature of the bulk motion (converging) flow onto a black hole, which would be the signature of the black hole [see Titarchuk, Mastichiadis & Kylafis (1997), Titarchuk & Zannias (1998) and LT99 for more details on this subject]. We present theoretical arguments based on the Monte-Carlo simulation and analytic consideration that the index-mass accretion rate saturation effect observed in a number of BHCs is a signature of a BH converging flow. This saturation effect should occur when the mass accretion rate exceeds the Eddington limit , which can only exist in BH sources, see Titarchuk, Mastichiadis & Kylafis (1997).
The origin of the spectral state transition and its final end as a steep power-law in the high soft states is still debated in the literature [see e.g. Chakrabarti & Titarchuk (1995), hereafter CT95, LT99, Laurent & Titarchuk (2001), Niedźwiecki & Zdziarski (2006) and Remillard & McClintock (2006), hereafter RM06]. However, there is agreement within the community that the spectral transition is driven by mass accretion in the system (see e.g. CT95, RM06) such that, when increases a BH source goes from the LHS to soft states (HSS or VSS) through the intermediate state (IS), but a detailed scenario for this transition is still missing. A natural question to ask is: why does the source go to either the HSS or the VSS and what physical processes are behind of each of these transitions? The soft component of the observed X-ray spectra is usually fitted by a blackbody (BB) shape modified by Comptonization for which the Comptonization parameter decreases, or the energy index of the Comptonization Green’s function increases towards a softer state [see details in TS09]. Furthermore, when the mass accretion rate increases up to some critical value photon index starts to saturate to a value of about 4.2. What mechanism is responsible for the behavior of vs and for the saturation level of the index? In contrast, ST09 and TS09 show that the index of the hard component of the X-ray spectrum saturates to different levels that varies between 2 to 3 for different sources and for different outbursts in a given source. For example, saturates to 3 in GRS 1915+105 (TS09) and to 2.3 in SS 433 (ST10) and it varies from 2 to 2.6 for different outbursts in GX 339-4 (see ST09).
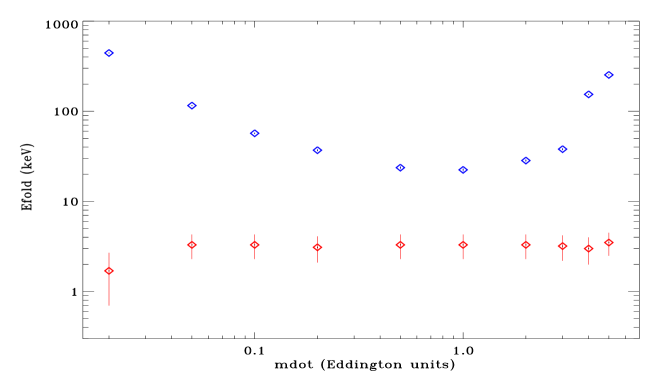
Another phenomenon revealed in X-ray observations of compact objects [neutron stars (NSs) and BHs] is related to the evolution of a high energy efold (cutoff) energy of the spectra during the spectral evolution. For NSs, steadily decreases from the hard state to the soft state [Titarchuk & Shaposhnikov (2005), Farinelli & Titarchuk (2010)] but, in BHs, the observational pattern of vs is such that begins to decrease with , which is then followed by a shift of to higher values when increases (Titarchuk & Shaposhnikov, 2010).
We present our picture of accretion in the innermost part of source, the Comptonization region [Compton cloud (CC)] and a model to calculate the CC plasma temperature in §2. We provide the details of the Monte-Carlo (MC) simulations in §3. We present a combined effect of thermal and bulk motion Comptonization and BH spectral evolution in §4. We show and discuss our MC simulation results and their theoretical explanation related to the index-mass accretion rate correlation in §5. Specifically, we discuss the signature of bulk motion Comptonization (BMC) and its relation to the index evolution during state transition. Also, we show that the index saturation effect is a direct consequence of the existence of the innermost bulk motion region and, therefore, can be considered to be an observational signature of a BH. - correlations results and their interpretation are shown in §6. Conclusions follow in §7.
2 The model
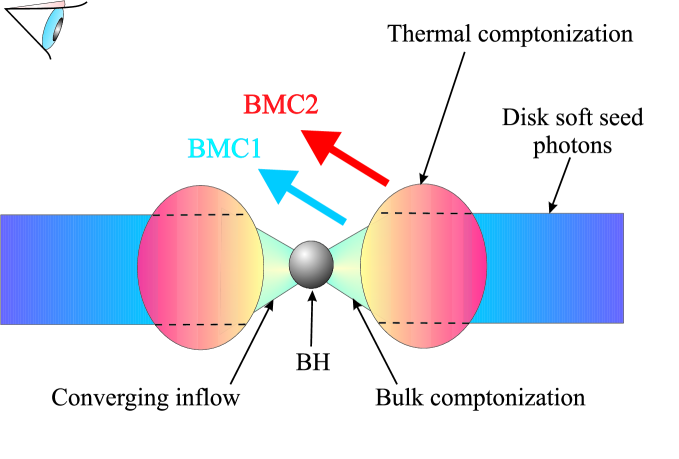
We illustrate our accretion scenario in Figure 1, which we suggest taking place in the innermost part of a black hole source. We assume that an accretion flow onto a black hole (BH) consists of three parts: a geometrically thin accretion disk [standard Shakura-Sunyaev disk, see Shakura & Sunyaev (1973)], a transition layer (TL), which is an intermediate link between the accretion disk, and a converging (bulk) flow region (see TF04), that is assumed to exist, at least, below 3 Schwarzschild radii, . There is substantial observational evidence for this three component model for accretion flows onto black holes [see Titarchuk, Shaposhnikov & Arefiev (2007), hereafter TSA07, ST09, TS09 and ST10]. In addition, power density spectra (PDSs) during the transition from the low-hard to high-soft states indicate low and high frequency white-red noise (WRN) components, with discrete Lorentzian QPO features superposed. The low frequency WRN component dominates in the high-soft state PDSs while the high frequency PDS component dominates in the low-hard state, with the interpretation that these two components represent the diffusion of perturbations in an outer accretion disk and an inner Compton corona (transition layer), respectively. These two regions are probably separated by an accretion shock, which moves to smaller radii in the high-soft state and to larger radii in the low-hard state (TSA07). This accretion shock represents a location in the disk where the outer Keplerian flow begins to transition to the inner sub-Keplerian motion of the compact object and its inner corona.
We assume that the plasma temperature of the converging flow is near that of the TL (or corona). The TL temperature can be presented in the analytical form using Eq. (12) in TF04111 There is a typo in formula (13) of TF04 which is the solution of Eq. (12) in TF04.:
| (1) |
where is TL optical depth and is a ratio of the energy releases in the disk and transition layer, respectively.
We relate to optical depth of the converging flow region by using the flow continuity equation
| (2) |
where the free-fall velocity
| (3) |
is the speed of light, is an outer radius of the converging flow and is a TL magneto-acoustic velocity averaged over the layer and approximately equals to radial velocity of the TL flow.
The optical depth of the converging flow, as evaluated by an observer at rest, is given by
| (4) |
where is a dimensionless mass accretion rate in units of the critical mass accretion rate and is the dimensionless outer radius of the converging flow in units of Schwarzschild radius . Note, if the dimensionless BH spin is less than 0.8 then [see Landau & Lifshitz (1975)].
Titarchuk, Bradshaw & Wood (2001), hereafter TBW01, estimated the B-field around neutron stars (NS) based on observed kilohertz and viscous quasi-periodic oscillation (QPO) frequencies. They found that the best-fit values of in the transition layer related to the B-field of NS and plasma density is in the range of cm s-1,
where
cm s-1
and is TL plasma density which is of order of g cm-3.
Unfortunately, there is no estimate of for the innermost part of a BH that is based on observations.
Titarchuk et al. (1998) introduced the Reynolds number
( in their notation) where , are an average radial velocity, an average viscosity over a given configuration, respectively and is a configuration scale. They demonstrated that the size of the transition layer (CC) between the fast rotating accretion disk and the relatively slow rotating central object (either BH or NS) strongly depends on the Reynolds number . Moreover, Titarchuk & Shaposhnikov (2008) infer, by analyzing X-ray data for Cyg X-1, that the Reynolds number
of accretion flow in the transition layer increases from 10 to 100 when the source evolves from the low/hard state to the high/soft state. This is possible when an increase of () leads to the rise.
Because is proportional to (and ) indicates that is also proportional to (see Eq. 4 for linear relation between and ):
| (5) |
where and .
Equations (4) and (6) yield, for nonzero , TL optical depth saturates to a constant value, when (or ) increases. This saturation of leads to the saturation of temperature with for a given (see Eq. 1). In this case, the temperature saturation value (see Eq. 1) is
| (7) |
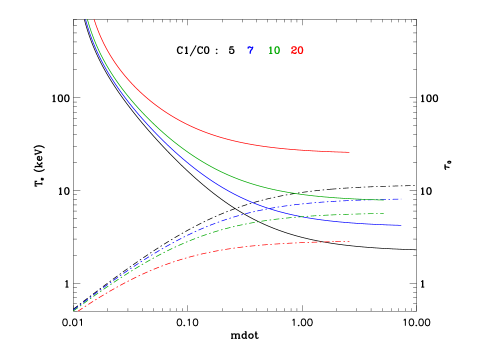
The thermal Componization index also saturates when and saturate given that is a specific function of and [see e.g. Sunyaev & Titarchuk (1980), hereafter ST80]. In Figure 2, we present and (in units of keV ) as functions of calculated using Eqs. (1) and (6). These calculations are made for , but for all the results are similar to those presented in Figure 2. It is clearly evident in Figure 2 that saturation of and occurs at high values of .
Using Eq. (1) and for , the product K. The thermal Comptonization parameter (ST80), which implies that goes to a constant too. In §4, we demonstrate that this saturation effect of the thermal Comptonization index is reproduced in our Monte Carlo simulations. It is also worthwhile to emphasize that the index saturation of the soft component of X-ray spectra is detected in RXTE observations of GRS 1915+105 (see TS09).
3 The Monte-Carlo simulations
The parameters of the simulations are , . We fix value of , and and we change from to . As it is seen from Eq. (1) the plasma temperature of the corona region is not affected if the disk cooling factor . Therefore, for most of the simulated cases, we fix the value at . Once and are set, we compute , , and using Eqs. (4), (6) and (1), respectively.
The physical model for the Monte-Carlo (MC) simulations is the Comptonization of the soft disk photons in the converging flow of optical depth extended from to , surrounded by a spherical shell of optical depth , corresponding to the transition layer. The MC simulated spectra are not sensitive to the geometrical size of the TL layer, the radius of which being set to , but is very sensitive to , and . Thus, we have incorporated plasma free-fall accretion onto the central black hole in the converging flow region as is described in LT99. Additionally, we include the thermal motion of the electrons in the converging flow and transition layer, simulated for electron temperature given by Eq. (1).
The seed X-ray photons were generated uniformly and isotropically at the surface of the border of the accretion disk, from to . The soft seed photon spectrum is a blackbody spectrum with a temperature of 0.9 keV, which is close to the color BB temperature found in the spectra of BHC sources [see e.g. Borozdin et al. (1999)].
In our MC simulations, we followed the trajectory of each photon in the following way: first, a uniform deviate U is generated such that , being the optical thickness a photon will travel in curved geometry, we use the Schwarzschild metric, before scattering off an electron. We then integrated the optical thickness along the photon path up to , taking into account the variation of the cloud number density and of the cross section with the radius. Here the cross section is the Klein-Nishina cross section averaged over the local relativistic thermal electron distribution. The gravitational red (or blue) shift endured by the photon was also computed at each step of this integration.
We simulate photon Compton scattering off an electron that includes the exact motion of the electron. We also take into account the case where, at the end of the integration, the computed optical thickness has reached and the photon has not left the considered volume [see Pozdnyakov et al (1983)]. In our procedure, we first compute the scattering electron momentum, and derive the scattered photon and electron characteristics from the Compton scattering kinetics. Then we check to determine if this event is consistent with the Compton scattering probabilities; if it is, then the event is kept; if it is not, another scattering photon is generated, and the process goes on until the event is accepted. This process was successfully checked by comparing its results (see LT99) with the analytical results presented in Titarchuk & Zannias (1998). Once the new energy and direction of the photon has been determined by the Compton kinetics, we track it in the same way as above until it makes another scattering, it escapes from the considered volume, or until it is “absorbed” by the black hole at its horizon.
4 A combined effect of thermal and bulk motion Comptonization. BH spectral evolution
For a BH of the dimensionless spin the radius of the marginally stable orbit in the disk is about [see Ruffini & Wheeler (1971) and Landau & Lifshitz (1975)]. Thus, below and if the plasma temperature of the flow is essentially non-relativistic, the accretion flow is almost in a free-fall regime, i.e. advection dominated, where the main effect of the up-scattering of the disk soft photons is the dynamical (or bulk) Comptonization (Laurent & Titarchuk, 1999).
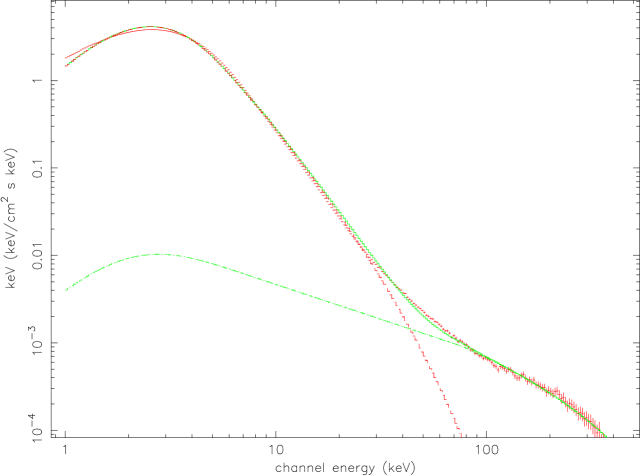
In Figure 3, we illustrate the effect of bulk motion Comptonization on the spectral signature. The parameters for the simulated spectrum were , , and , resulting in and inferred electron temperature of the flow keV (see Eqs. 1, 4, 6). The dotted line corresponds to the simulated spectrum where the bulk effect of the converging flow is not taken into account and the solid line corresponds to the spectrum where the bulk velocity of the converging flow is included in the simulations. The effect of bulk (dynamical Comptonization) flow is clearly seen above 20-30 keV. The steep power-law component that emerges in the spectrum which is now extended up to 200 keV.
All our simulated spectra can be represented by an additive XSPEC model consisting of the addition of two, so called “bulk motion” Comptonization (BMC) components: a BMC with a high energy cut-off (BMC1 component) and a relatively soft BMC2 component with a high energy cut-off. Thus, our model for fitting is ). The BMC model describes the outgoing spectrum as a convolution of the input “seed” blackbody spectrum, with a normalization of and color temperature is , with the Comptonization Green’s function which is a broken power law of spectral index (photon index ). The resulting spectrum is characterized by the parameter related to the Comptonized fraction as and spectral index .
In Figure 4 we show an example of the simulated spectra produced by two BMC components with high energy cutoff, specifically bmc1highcut1+bmc2 highcut2. The spectrum is shown in units of keV (keV cm-2s-1keV-1) where absolute values are multiplied by an arbitrary constant. The hard component is given in dash green and the soft component is given in dash red. The resulting best-fit spectrum is presented by the solid green curve. In our simulations the mass accretion rate in Eddington units, is , , and the flow electron temperature is keV. The characteristics (parameters) of and are spectral index (), , cutoff energy keV, efold energy keV and that for and are (), , keV, keV.
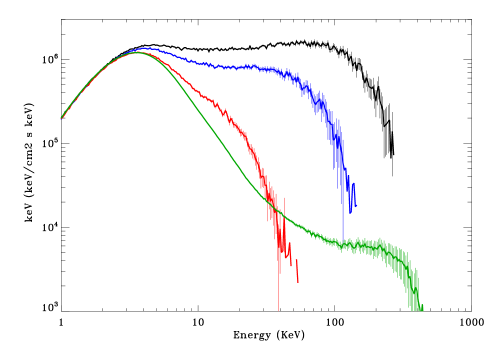
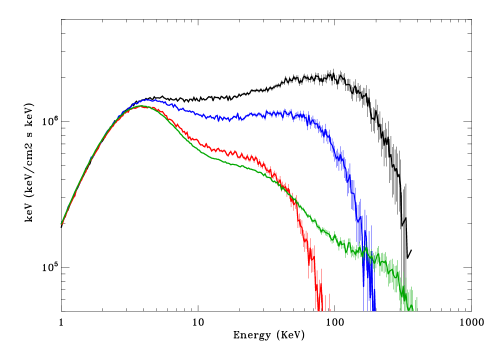
The general picture of LHS-IS-HSS transition is illustrated in Figure 5 where we bring together simulated spectra related to the observational spectra of LHS, IS, HSS and VSS to demonstrate the BH spectral evolution from the low-hard to soft states. We reproduce the observational spectral evolution by varying the mass accretion rate from 0.05 to 5. Top and bottom panels correspond to and , respectively. The different shapes of the simulated spectra are related to the different spectral states in the following manner: low (black histogram), which the TL optical depth and keV for and , respectively (see Fig. 2), is similar to the observed LHS spectrum (see ST09, TS09); increasing the accretion rate to (blue histogram), the spectrum becomes softer (i.e. power law is steeper and exponential cutoff energy is shifted to lower energies than that for ) and the Comptonization component dominates the blackbody (BB) component, which is barely seen in 3-150 keV energy range is similar to the spectrum seen in the beginning of the IS state; increasing further produces a spectra (green histogram) characterized by a strong soft BB component and an extended steep power law, which is comparable to the observed HSS spectra.
For moderate (red histogram) and the spectral shape is a blackbody-like but slightly modified by the thermal Comptonization because keV is very low for efficient thermal up-scattering and is also low for the bulk motion Comptonization. A similar spectra is detected during the very soft state (VSS). However when mass accretion further increases to a value of the extended high energy component is seen up to energies 300 keV as a result of the bulk motion Comptonization in the converging inflow, .
For and the spectral shapes are strongly affected by thermal Comptonization because keV and are relatively high [see Figs. 2, 5 (lower panel)]. One can also observe the effect of bulk motion Comptonization seen as an extension of the emergent spectrum to energies of 300 keV when mass accretion rate increases, see green curve for and compare the similar effect for (Fig. 5, lower and upper panels respectively).
5 Indices of soft and hard components of the X-ray simulated spectra as a function of mass accretion rate
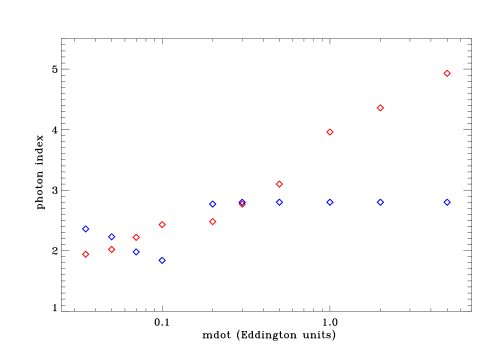
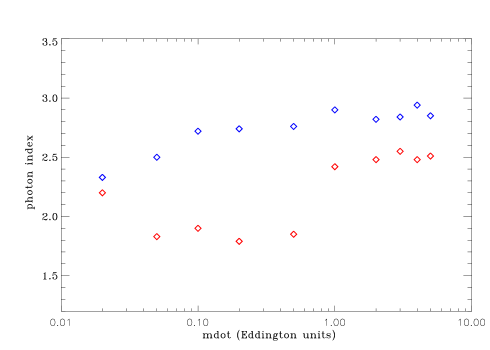
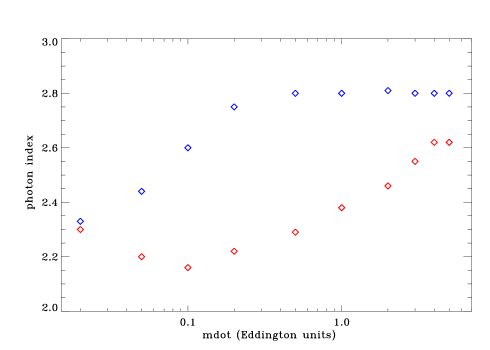
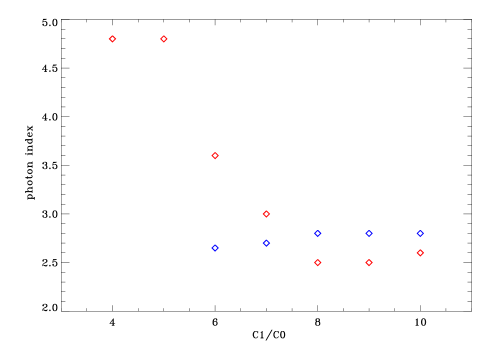
We have made series of simulations with different values of the ratio in order to study the evolution of - index saturation. This evolution is shown on Figures 6-8, where the saturation limits for and are shown. Moreover, we show the observed pattern of index vs (see ST09 and TS09) can be reproduced in our simulations by the variation of only one parameter of the velocity profile, i.e. . In Figures 6-8, we show (red points) and (blue points) as a function of for a given . Saturation of occurs in all simulated cases. The highest level saturation of is achieved at , when the matter accumulation is strong in the transition layer (see Fig. 9). The saturation value is close to the saturation index value (about 4.3) of the soft component of RXTE X-ray spectrum from GRS 1915+105 (TS09). In §2, we argue that index saturations of the soft component at high is expected for each given value of . When is low (or ), the TL layer optical depth is high (see Eq. 6) and consequently the plasma temperature of accretion flow is low (see Eq. 1). In other words matter accumulation efficiency in the transition layer (or ) is inversely proportional to magneto-acoustic velocity there (see Eq. 2).
ST09 and TS09 present strong observational and theoretical arguments that the saturation of index occurs at high too. Specifically, ST09 argues that, in the converging flow, the spectral index, as an inverse of Comptonization parameter, , should saturate at high because a linear increase of with is compensated for by a decrease of as . Here is average fractional energy per scattering. Our simulations show that the index saturation values of weakly depend on ratio i.e. is in the range of 2.6-2.8 for all (see Fig. 9).
Particular for , the hard component of the simulated spectrum (above 80 keV) is absent when increases from 0.1 to 0.5. (see Fig. 5). However one can see that the spectral hard component arises when increases above 1 (see also Fig. 6).
Moreover, for , and the flow electron temperature decreases to about 3 keV (see Fig. 2). In this case, we obtain that and saturate to and , respectively (see Fig. 9). This situation is probably realized in the innermost part of GRS 1915+105 where there are similar values of and inferred from RXTE X-ray spectrum (see TS09).
One can conclude that for TL velocities of order and less, when the accumulation effect in the transition layer is very strong, the steep extended power law, as a spectral signature of the converging, is screened by the optically thick material of the transition layer. In this case, the end of the spectral evolution from the low-hard state is the very soft state characterized by a strong blackbody like component (see the red and green simulated spectra in the upper panel of Fig. 5). The soft spectral component is dominant at and an extended hard tail is only seen in the spectrum for high values of (see green spectral histogram in Fig. 5). TS09 show that this type of spectral evolution is seen in RXTE observations of GRS 1915+105.
However, for , the accumulation effect is not as strong in the TL and as a consequence the steep power law extended up to 300 keV is seen at higher level of count rate then that for (compare the upper and lower panels in Fig. 5). In this case, we see a classical spectral evolution from LHS to VHS through the intermediate state that is observed in many BH binaries [see e.g Remillard & McClintock (2006), ST09].
We reproduce, using our Monte Carlo simulations, the observed spectral evolution in BH binaries when we assume the velocity profile, approximately constant in the transition layer and followed by free-fall below . In fact, because the transition layer shrinks with mass accretion rate [see Titarchuk et al. (1998)] one can assume the constancy of there. Thus we proceed with our Monte-Carlo simulations of photon propagation in this kind of atmosphere.
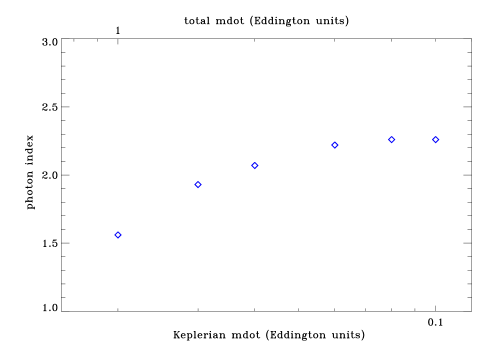
However in the framework of our spectral evolution model, we do not obtain an extended power law with the index saturation of 2.1 that has been detected in HSS of Cyg X-1, GX 339-4, 4U 1543-47 (see ST09). This kind of the hard tail is reproduced in our simulations when we assume that there is a sub-Keplerian, relatively hot accretion flow with the same temperature as the transition layer, in addition to the disk accretion flow. In these simulations, the ratio of the sub-Keplerian to the Keplerian accretion rate is (see Fig. 10). This idea of advection dominated accretion flow (ADAF), first introduced by Narayan & Yi (1994), is very popular in the astrophysical community.
To illustrate this, we use Cyg X-1, where it has been shown [see e.g. Peterson (1978), Kaper (1998)] that the X-ray source is powered mainly by accretion from the strong stellar wind of the supergiant star. There is a strong observational indication of the presence of sub-Keplerian flow in this source. The temperature of this flow can be dictated by the photons Comptonized in the transition layer. Presumably when the disk mass accretion increases the sub-Keplerian mass accretion rate increases too. In order to have the relatively hot ADAF, one varies in the low value range. To show this, the variation of from to leads to a decrease of from 60 to 20 keV (see Fig. 2). Laurent & Titarchuk (1999) obtained that the photon index of the converging flow power-law tail saturates to when keV.
Hence we obtain the observable saturation index of 2.1 assuming the existence of two component flows in the aforementioned BHs.
6 Evolution of spectral efold energy with mass accretion rate
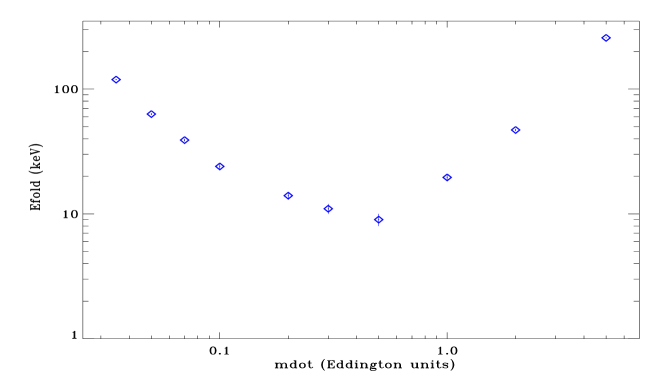
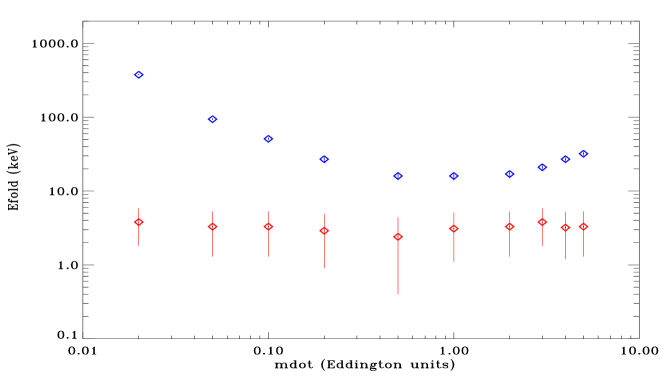
Dynamical (bulk) Comptonization spectra can be distinguished from thermal Comptonization spectra when there is information about the evolution of with . This information is inferred from X-ray observations of spectral transitions in BHCs, where the evolution patterns are drastically different between the two Comptonizations. In Figure 11, we plot how the high energy efold energy varies with the mass accretion rate . In the bulk motion Comptonization case the efold energy decreases and then increases when mass accretion rate (see Figure 11).
7 Conclusions
We have studied, using Monte Carlo simulations, the evolution of X-ray energy spectra from the low-hard state to the high-soft state, and found that a hard spectrum should be observed at relatively low values of mass accretion rate independently of the velocity profile (see Fig. 5). Further, for low velocities of the accretion flow in the transition layer (TL) , there is plasma accumulation at high mass accretion rates that produces high optical depth and thus one can barely see the high energy tail. An emergent spectrum is characterized by a blackbody like shape of temperature on order of 1 keV and the relatively weak hard tail (see the green spectral histogram in the upper panel in Fig. 5). This kind of spectra is observed in the very soft state of BH binaries. We also found that when the TL velocities are of order of (0.07-0.1)c at high mass accretion rate the extended power-law component is more pronounced in the emergent spectra (see the green spectral histogram in the lower panel of Fig. 5). For all velocity values in TL, our results predict index saturation vs mass accretion rate (see Figs. 7-8). Finally, we showed that the efold energy of the emergent spectra decreases and then increases as the mass accretion rate increases (see Fig. 11). This is a specific property of BH spectra. This type of behavior of vs (or vs photon index) has been recently discovered by Titarchuk & Shaposhnikov (2010) in RXTE observations of XTE J1550-564.
Note the decrease of the spectral efold energy vs mass accretion rate occurs when the high energy photons formed in the converging flow are not seen in the resulting spectrum. In this case, the spectral shape is only determined by thermal Comptonization taking place in the outer parts of Compton cloud.
We appreciate the referee for careful reading and his/her valuable comments on the content of the manuscript. We also acknowledge the manuscript editing by Charlie Bradshaw.
References
- Belloni (2005) Belloni, T. 2005, Interacting Binaries: Accretion, Evolution, and Outcomes, AIP Conference, 797, 197 (astro-ph/0504185)
- Belloni et al. (2000) Belloni, T., Klein-Wolt, M., Méndez., M., van der Klis, M., & Paradijs, J. 2000, A&A, 355, 271
- Borozdin et al. (1999) Borozdin, K., Revnivtsev, M., Trudolyubov, S., Shrader, C. & Titarchuk, L. 1999, ApJ, 517, 367
- Chakrabarti & Titarchuk (1995) Chakrabarti, S.K. & Titarchuk, L. 1995, ApJ, 455, 623
- Farinelli & Titarchuk (2010) Farinelli, R. & Titarchuk, L. 2010, A&A, in press
- Kaper (1998) Kaper, L. 1998, in ASP Conf. Ser. 131, Boulder-Munich II: Properties of Hot, Luminous Stars, ed. I. D. Howard (San Francisco: ASP), 427
- Klein-Wolt & van der Klis (2008) Klein-Wolt, M., & van der Klis, M. 2008, ApJ, 675, 1407
- Landau & Lifshitz (1975 ) Landau, L.D. & Lifshitz, E.M. 1975, The classical theory of fields (Pergamon Press: Oxford)
- Laurent & Titarchuk (2001) Laurent, P., & Titarchuk, L. 2001, ApJ, 562, 67
- Laurent & Titarchuk (1999) Laurent, P., & Titarchuk, L. 1999, ApJ, 511, 289 (LT99)
- Narayan & Yi (1994) Narayan, R & Yi, I. 1994, ApJ, 428, L13
- Niedźwiecki & Zdziarski (2006) Niedźwiecki, A. & Zdziarski, A. 2006, MNRAS, 365, 606
- Peterson (1978) Peterson, K. 1978, ApJ, 224, 625
- Pozdnyakov et al (1983) Pozdnyakov, L.A., Sobol’, I.M. & Sunyaev R.A. 1983, Astrophys. Space. Phys. Rev., 9, 1
- Ruffini & Wheeler (1971) Ruffini, R., & Wheeler, J. A. 1971, Physics Today, 24, 1, 30
- Remillard & McClintock (2006) Remillard, R. A., & McClintock, J. E. 2006, ARA&A, 44, 49 (RM06)
- Seifina & Titarchuk (2010) Seifina, E. & Titarchuk, L. 2010, ApJ, 721, , (ST10)
- Shakura & Sunyaev (1973) Shakura, N.I. & Sunyaev, R.A. 1973, A&A, 24, 337
- Shaposhnikov & Titarchuk (2009) Shaposhnikov, N. & Titarchuk, L. 2009, ApJ, 699, 453
- Shaposhnikov & Titarchuk (2006) Shaposhnikov, N., & Titarchuk, L. 2006, ApJ, 643, 1098
- Sunyaev & Titarchuk (1980) Sunyaev, R.A. & Titarchuk, L.G. 1980, A&A, 86, 121 (ST80)
- Titarchuk, Bradshaw & Wood (2001) Titarchuk, L. & Bradshaw, C. & Wood, K. 2001, ApJ, 560, L58
- Titarchuk, & Fiorito (2004) Titarchuk, L.G. & Fiorito, R. 2004, ApJ, 612, 988 (TF04)
- Titarchuk et al. (1998) Titarchuk, L., Lapidus, I. & Muslimov, A. 1998, ApJ, 499, 315
- Titarchuk, Mastichiadis & Kylafis (1997) Titarchuk, L., Mastichiadis, A., & Kylafis, N. D., 1997, ApJ, 487, 834
- Titarchuk & Seifina (2009) Titarchuk, L. & Seifina, E. 2009, ApJ, 706, 1463 (TS09)
- Titarchuk & Shaposhnikov (2010) Titarchuk, L. & Shaposhnikov, N. 2010, ApJ, in press
- Titarchuk & Shaposhnikov (2008) Titarchuk, L. & Shaposhnikov, N. 2008, ApJ, 678, 1230
- Titarchuk & Shaposhnikov (2005) Titarchuk, L., & Shaposhnikov, N. 2005, ApJ, 626, 298
- Titarchuk, Shaposhnikov & Arefiev (2007) Titarchuk, L., Shaposhnikov, N. & Arefiev, V. 2007, ApJ, 660, 556
- Titarchuk & Zannias (1998) Titarchuk, L., & Zannias. T. 1998, ApJ, 493, 863
- Vignarca et al. (2003) Vignarca, F., Migliari, S., Belloni, T., Psaltis, D., & van der Klis, M. 2003, A&A, 397, 729