∎
22email: ritabrata@csp.res.in; samir@csp.res.in; dipak@csp.res.in; tilak@csp.res.in; anuj@csp.res.in
(: Posted at ICSP by Space Science Division, ISRO Head Quarters) 33institutetext: A. R. Rao 44institutetext: Tata Institute of Fundamental Research, Homi Bhabha Road, Colaba, 400005
44email: arrao@tifr.res.in 55institutetext: Sandip K. Chakrabarti 66institutetext: S.N. Bose National Centre for Basic Sciences, JD Block, Salt Lake, Kolkata 700097
(Also at Indian Centre for Space Physics, 43 Chalantika, Garia Station Rd., Kolkata 700084)
66email: chakraba@bose.res.in
Instruments of RT-2 Experiment onboard CORONAS-PHOTON and their test and evaluation IV: Background Simulations using GEANT-4 Toolkit ††thanks: This work was made possible in part from a grant from Indian Space Research Organization (ISRO). The whole-hearted support from G. Madhavan Nair, Ex-Chairman, ISRO, who initiated the RT-2 project, is gratefully acknowledged.
Abstract
Hard X-ray detectors in space are prone to background signals due to the ubiquitous cosmic rays and cosmic diffuse background radiation that continuously bombards the satellites which carry the detectors. In general, the background intensity depends on the space environment as well as the material surrounding the detectors. Understanding the behavior of the background noise in the detector is very important to extract the precise source information from the detector data. In this paper, we carry out Monte Carlo simulations using the GEANT-4 toolkit to estimate the prompt background noise measured with the detectors of the RT-2 Experiment onboard the CORONAS-PHOTON satellite.
Keywords:
Radiation detectors X- and gamma-ray telescopes and instrumentation Background radiation, cosmic Structural and shielding materials Monte Carlo simulationspacs:
29.40.-n 95.55.Ka 98.70.Vc 28.41.Qb 87.15.ak1 Introduction
Observational astronomy in the X-ray and -ray bands of the electromagnetic spectrum is very crucial to explore high-energy physical phenomena in the Universe. X-ray or -ray observations from the ground-based instruments are not possible due to the atmospheric attenuation. In the last four decades, huge efforts have been made towards the development of space-borne X-ray and -ray telescopes. At the same time, these efforts are also limited by the hostile space environment, particularly in hard X-rays and -rays. High energy charged particles coming from outer space and from the Solar wind become trapped in the Earth’s surrounding magnetic field creating radiation belts around the Earth, known as the Van Allen radiation belt. Though the satellites carrying the X-ray and -ray detectors are usually placed below the inner radiation belt (altitude varying from a few to ), still there are some localized energetic charged particle regions which may result in severe damages to the instruments if they are activated while passing through those regions such as the Polar Regions and the South Atlantic Anomaly (SAA) region. Apart from these trapped charged particle regions, there are the cosmic diffuse radiation and the cosmic rays, mainly protons and alpha particles. These cosmic-ray particles, depending on the geomagnetic strength at the altitude and position, enter into the Earth’s atmosphere and interact with the atoms and molecules resulting in various secondary particles. These primary and secondary cosmic radiations and charged particles bombard the detector and satellite materials and may produce secondary or higher order particles in prompt interactions (through bremsstrahlung, pair creation etc.) or/and may initiate the detector activation. These radiations and particles will increase the detector noise which may mask the original source signal. The high-energy charge particles can pass through detector and space craft and may deposit a line of charge in the detector volume. This may then be detected in the same way as energy deposit produced by the ‘real’ X-ray radiations. It is thus very essential to make an accurate estimate of the onboard background noise before designing any space experiment. The background noise in an X-ray instrument is mainly due to the interactions of the cosmic-ray protons, the albedo protons and neutrons due to Earth’s atmosphere, Cosmic Diffused Gamma-Ray Background (CDGRB), secondary gamma rays formed in the detector material, its frame structure and with the satellite (Dean, Lei & Knight 1991). In addition, the long-term activation of the detector materials by these radiations or particles or by the particles in the trapped particle region are also responsible for the background noise. The background noise varies over a wide range of energy and actually depends on the detection capability of the specific detector. These background noise compete with the signals due to the interactions of source photons with the detectors. It is therefore important to understand the interactions of these background components with the detector material and to remove them while extracting the source signal.
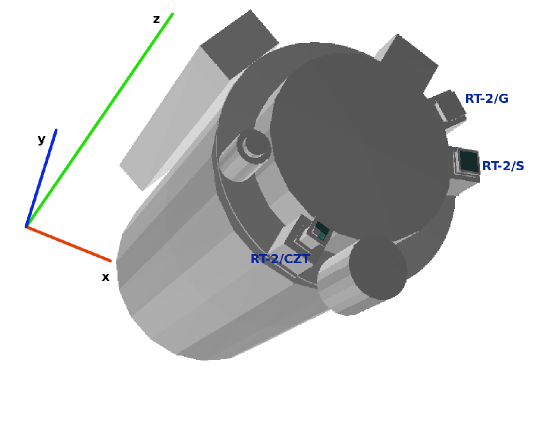
The RT-2 experiment aboard the CORONAS-PHOTON satellite (Kotov et al. 2008, Nandi et al. 2009) consists of 4 payloads: three X-ray detectors (RT-2/S, RT-2/G & RT-2/CZT) and one processing electronic device (RT-2/E). Detailed description of all the payloads and their functionality are given in Debnath et al. (2010), Kotoch et al. (2010), Nandi et al. (2010) and Sreekumar et al. (2010). The Phoswich detectors (RT-2/S & RT-2/G) are made of NaI (Tl) and CsI (Na) scintillating crystals. Both the Phoswich detectors are sensitive to detect high energy X-rays in the energy range of to . The RT-2/CZT detector is a solid-state imaging device, which consists of CZT and CMOS detectors. Both the detectors are sensitive in the energy range of to .
In the present work, we concentrate on predicting/comparing the background in these detectors during the passage of the space craft through the low-background equatorial region (away from the SAA and polar regions), to estimate the sensitivity of the detector. Hence, we make a detailed simulation of the interaction of primary and secondary protons, cosmic diffused gamma rays, secondary gamma rays and secondary neutrons with the detector volume as well as the whole structure of the satellite carrying the detectors.
In this paper, we carry out Monte Carlo (MC) simulations using the GEANT-4 toolkit and highlight the effects of shielding material in calculating the background noise due to cosmic-ray photons on the detectors of the RT-2 Experiment. In the next section (§2), we describe the typical spectrum of the CDGRB, primary cosmic-ray proton and secondary proton, gamma-ray and neutron spectrum in the low Earth orbit of interest and of a standard GRB source. We also discuss the physical processes that are involved while the incident particles and radiations interact with the detector material. In §3 & §4, we present the simulation results of the RT-2/S (RT-2/G) and RT-2/CZT payloads. In §5 we compare the predicted result with an observed data set. Finally, we conclude in section §6.
2 The Simulation Attributes
2.1 Detector characteristics & specifications
The RT-2 Experiment aboard the CORONAS-PHOTON satellite is a unique experiment as it consists of different types of detectors, namely a scintillator detector (NaI, CsI crystal), a solid-state detector (CZT) and a photo-diode (CMOS) detector. The specifications and materials used for all these detectors are given in Table 1.
Table 1: Detector specifications of RT-2/S (RT-2/G) and RT-2/CZT payloads.
Payload
RT-2/S (RT-2/G)
RT-2/CZT
Detector type
NaI + CsI
CZT & CMOS
Material composition
NaI (Tl activated)
Cd0.9Zn0.1Te
CsI (Na activated)
CMOS (Amorphous Si photo-diode
Gd2O2S:Tb)
Thickness (mm)
3 + 25
5 & 3
Size (mm)
116 dia
4040 & 24.524.5
Filter (mm)
Al (0.5)
graphite (1.0) (protective cover)
Effective area (cm2)
105.6
48 (3 modules) & 5.7
FOV
( )
Readout
PMT
pixels
For the simulation of the effects of various background components in the detectors we consider an approximate mass distribution of the whole CORONAS-PHOTON satellite hosting various detectors on it. Figure 1 depicts the simplified shape of the whole satellite including the detectors on it. This shape was used in the simulation. The major contribution of its mass is from the satellite shell structure which is made up of Aluminum (Al) and the electronics modules inside it, which consist of Aluminum (Al), Silicon (Si) and Copper (Cu) as the major elements. We distribute these materials throughout the satellite cavity for simplification. Also for the detector components other than RT-2/S, RT-2/G and RT-2/CZT we consider simplified structures consisting of the approximate weights of the major components of concerned detectors. The overall height of the satellite construction under our consideration is and radius is . For the detectors of our concern i.e., RT-2/S, RT-2/G and RT-2/CZT, we use more detailed geometry described in the following sections.
2.2 Primary Particle Generation
We simulate five major components which cause background noise in X-ray or -ray detectors. They are: the CDGRB photons, secondary gamma-ray photons due to Earth’s atmosphere, primary Cosmic-Ray (CR) protons, secondary protons due to interaction of CR in Earth’s atmosphere and the albedo neutrons from the Earth’s atmosphere.
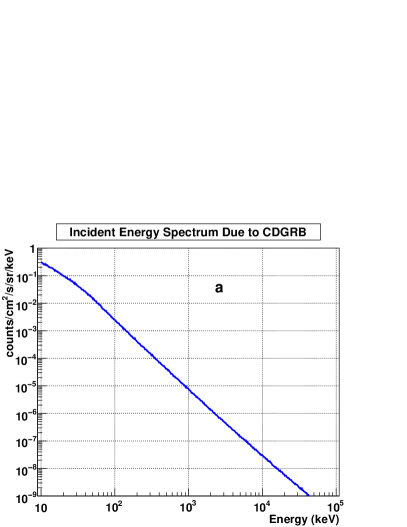
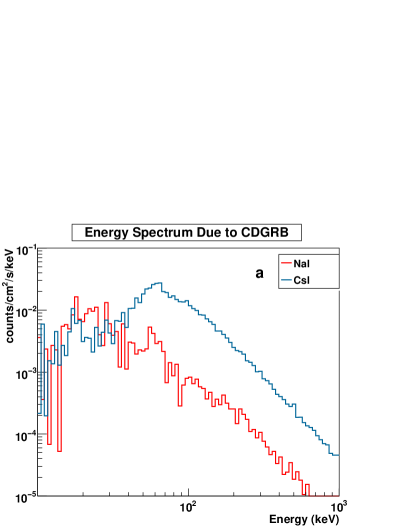
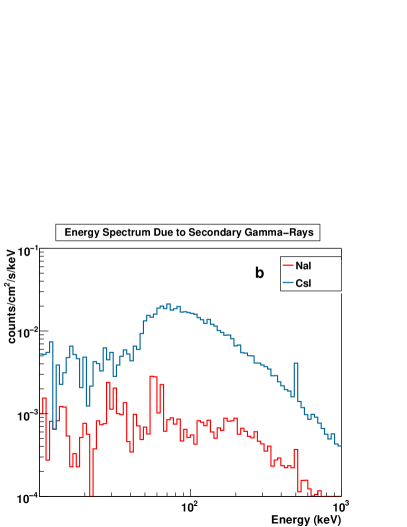
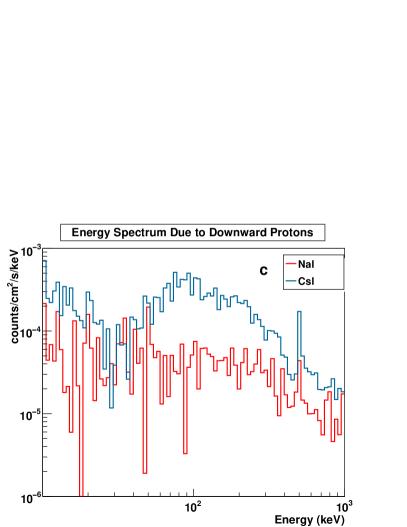
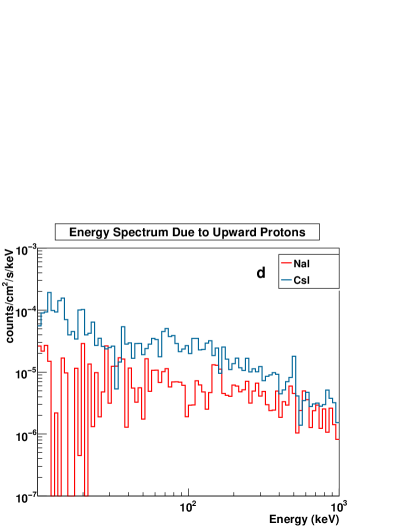
To simulate the CDGRB photons, we generate the incident photons from the surface of a hemisphere (at +ve z-axis) of radius . The center of the whole geometry is at the center of the satellite common mounting plate on which the RT-2 detectors and some other detectors are mounted (see Figure 1). The position of the incident photon generating hemisphere is such that it covers the whole region above the Earth’s horizon. The randomness of the incident photons are ensured by placing their origin randomly on the hemisphere and the directions of the photon momenta are also chosen to be random within the solid angle subtended by the dimension of the satellite radius at the vertex of each incident photon. We are interested in the response of the detector in the incident energy range of . The CDGRB spectrum can be represented by the equation (Gruber et al. 1999),
| (1) |
where, is incident photon energy and is in the unit of . We divide the entire energy range into bins equal in logarithmic scale and simulate photons in each bin to retain a good statistics in the simulation result. The incident photon spectrum on the detectors due to CDGRB is shown in Figure 2a.
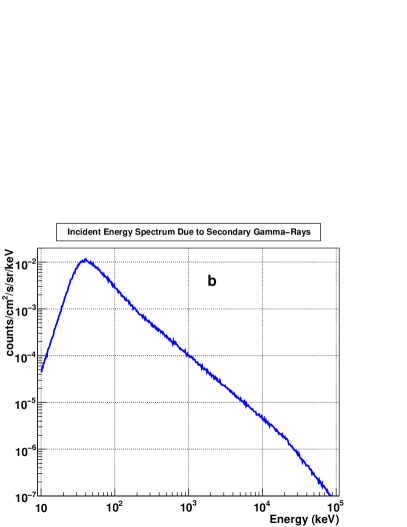
For the simulation of the secondary albedo gamma-ray photons, we consider photons randomly originated from a hemispherical surface of radius with the center coinciding with the center of the satellite common mounting plate. In this case, we consider the position of the generating hemisphere at the opposite that of the primary CDGRB (i.e., at -ve z-axis). The direction of the secondary photons has been achieved in the same way as that of the primary CDGRB. In this case also we consider the energy range of . Atmospheric gamma-ray line emission, such as the emission from positron annihilation, has not been considered, while simulating for secondary albedo gamma-ray photons. The energy spectrum is represented by (Ajello et al. 2008; Mizuno et al. 2004),
| (2) |
in units of . We divide the entire energy range into bins equal in logarithmic scale and in each bin, we inject photons. The incident photon spectrum on the detectors due to secondary gamma-ray photons is shown in Figure 2b.
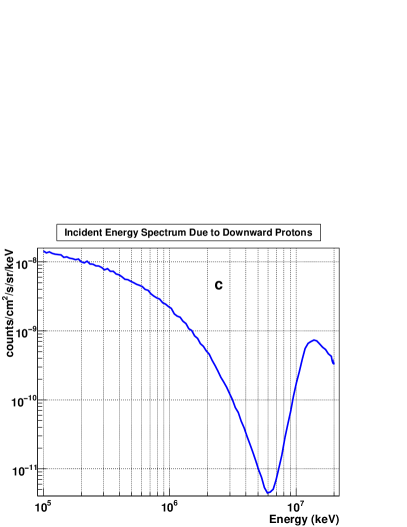
We also simulate the detector response due to the CR and secondary protons. We consider the input differential spectra for the downward and upward going protons. While the upward going protons are mostly secondaries from the Earth’s atmosphere, the downward going component also contains the primary CR proton above the cutoff. We consider these spectra near the equatorial region.
For the downward going proton component we consider random protons from a spherical section of radius around the satellite with its center coinciding with the center of the common mounting plate and covering the open region above the Earth’s horizon. The randomization in the direction of the particles is the same as described for the CDGRB or secondary photons. We carry out the simulation for the proton energy range of . To produce the energy distribution we consider the spectral data given by Alcaraz et al. (2000) for the low geomagnetic latitude (). We fit this data using the functional form described by Mizuno et al. (2004) presented by the equation,
| (3) |
in units of , where is the magnitude of the electron charge, is the atomic number of the particle, , , Solar modulation (a value near Solar activity minimum), is the proton mass and . In this case, we divide the whole incident energy range in bins equal in logarithmic scale and inject photons in each bin. Figure 2c presents the incident energy spectrum for the Primary CR protons.
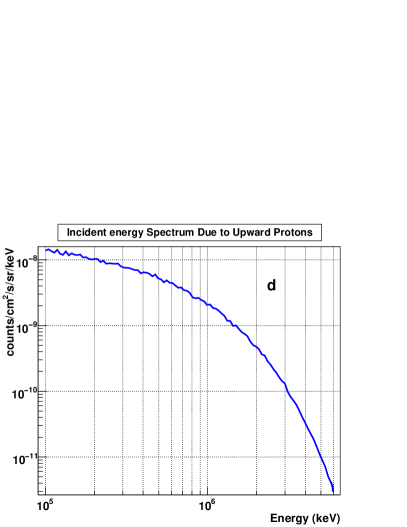
The contribution of the upward going proton spectra from the Earth’s atmosphere is considered as follows. For the positional and directional aspects of the generation of these protons we used the same methods as the albedo photons. Here in this simulation we consider the energy range of . The spectral form is given as (Alcaraz et al. 2000; Mizuno et al. 2004),
| (4) |
in units of , where, and . The incident secondary proton spectrum is depicted in Figure 2d.
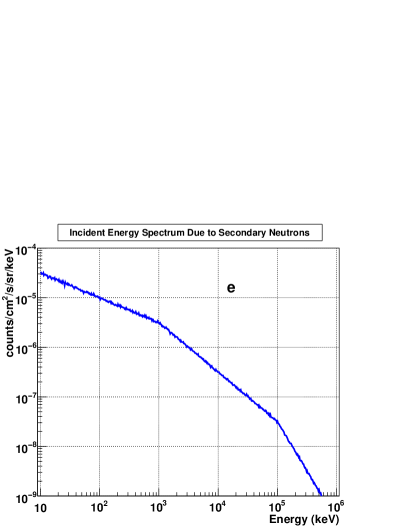
For the simulation of the secondary neutrons due to the interaction of the CR in the Earth’s atmosphere, we consider the generation of the neutrons from a hemispherical surface of radius in the same manner as the secondary photon simulation. The incident particle direction is also randomized in the same way. The energy range of the neutron simulation is . The spectral form of the neutron energy distribution is given by (Armstrong et al. 1973),
| (5) |
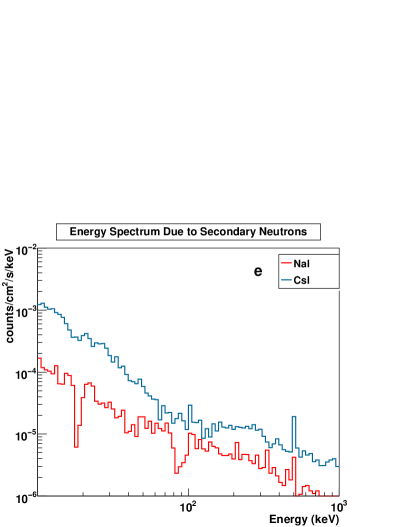
in units of . We divide the whole energy range in energy bins equal in log scale and inject photons in each bin. Figure 2e shows the incident spectrum for the secondary neutron generation.
The spectrum of energy deposition on the detectors is calculated by normalizing the deposited spectrum in the following way. We have incident energy bins equal in logarithmic scale, where is the width of the th bin. In each bin we are simulating (here ) number of particles from a surface of area and over the solid angle subtended by the detector to the vertex of the incident photons. Now the total number of photons in each incident energy bin is . Then we calculate the normalization constant . To calculate the normalized deposition spectrum we divide the whole deposition energy range in bins. We have number of photons in the th bin of the deposition spectrum due to photons in the th incident bin. Then we calculate the normalized photon counts in the th bin of the deposition spectrum for the all incident photons as
| (6) |
where, is the area of the crystal (detector) and is the width of the th energy range.
In the present work, we are only dealing with the sources for the prompt background noise. So we simulate here some of the main sources of the prompt background noise sources. Apart from the prompt background, significant noise will be present due to the detector material activation as the satellite is in a polar orbit. However, there are considerable uncertainties in estimating the contribution due to long term activation to the total background. This is because the relevant package, namely, Cosima based on Geant4 is still in the developmental stage and cannot be trusted for predicting backgrounds due to activation (Zoglauer et al. 2008; Zoglauer, 2009). In the present paper, we have deferred the inclusion of the effects of activation on the detector. This can be dealt with in a future work.
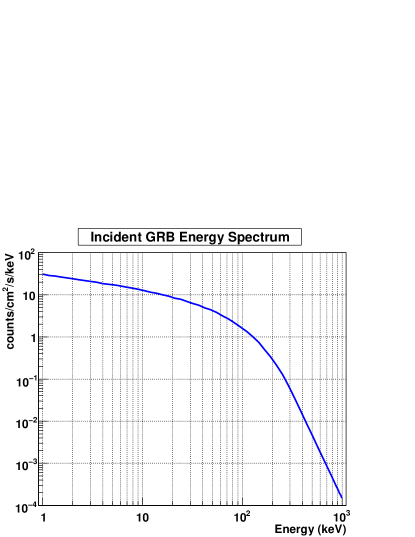
To simulate the incident spectrum of a Gamma-Ray Burst (GRB), we consider the Band spectral (Band et al. 1993) form of a bright GRB (GRB 880725), which follows the equation,
| (7) |
in units of , where, is a constant, is the low energy slope, is the high energy slope and is the break energy (Strohmayer et al. 1998). The incident photons are generated from a plane of area equal to that of the collimator of the detectors and is placed above the detector base plate. We consider parallel photons falling straight into the detector through the collimator. We also consider the source location (GRB) at an angle of to the on-axis of the payload and its effect on resulting photon distribution after interacting with detector materials. The incident energy spectrum (Eqn. 7) of the GRB is shown in Figure 3.
2.3 Physical Processes for Primaries as well as Secondaries
The CORONAS-PHOTON satellite is placed at an altitude of in an orbit which is inclined at , which results in the passage of the satellite through high energetic charge particle regions of the SAA, North Cap (NC) and South Cap (SC) for of its orbital time. In these regions, satellite operations will be restricted for the protection of the detectors from the high radiation dose. Apart from the high energetic charge particles of SAA, NC and SC regions, the CDGRB, the high energy protons and other albedo particles and photons will hit the satellite and detector materials to produce the background noise in the detectors either directly or by creating local spallation background. The hard X-ray solar flares along with some other astrophysical sources (e.g,. GRBs) would be detected by the RT-2 detectors in the energy range of , extendable up to . The underlying physical processes by which photons can interact in any medium depend on particle energy and the material properties of that medium.
For the simulation of the detectors under this circumstances, we use the Geant4 simulation toolkit version 9.1.p03 and the cross section data version G4EMLOW5.1, G4ABLA3.0, G4NDL3.12. For the electromagnetic processes in the simulation we consider the low energy electromagnetic physics list. For the photon interactions we are using the low energy photo-electric effect (activated with Auger electron production), low energy Compton effect, low energy Rayleigh Scattering and low energy Gamma ray conversion. In the above mentioned energy range, the incident photon produces electrons as the secondary particles. Electrons lose their energy through the low energy ionization, multiple scatterings and low energy bremsstrahlung processes. For positrons we consider the bremsstrahlung, annihilation, ionization and multiple scattering processes. We are using a production cut-off value of for photon, electron and positron which is the same for all the materials. This implies a threshold energy in the Aluminum as , and respectively for photons, electrons and positrons. For the hadronic interactions we are considering the “LHEP” physics list defined in the Geant4. In the Geant4 toolkit, above mentioned processes are defined as separate modules in the “process” category and this module is included in the “Physics list”(Agostinelli et al. 2003). Further information are available at http://geant4.web.cern.ch/geant4/.
2.4 Shielding material
To shield the detectors from X-rays and gamma-rays from off-axis sources and diffuse X-rays and other cosmic particles, materials with high atomic numbers such as Lead and Gold etc. are used. These high-Z elements, however, have a deep dip in their absorption coefficient just below their K-shell binding energies. Sometimes, materials with lower atomic number like Tin and Copper are used to absorb the characteristic fluorescent X-rays. In the present case, however, the primary objective of the experiment is to make very sensitive hard X-ray measurement of solar flares (typically below ) and in particular use the Phoswich technique for background reduction. Since the CsI detector in the Phoswich configuration has a good sensitivity above , an alternate objective is to use the detector as an open monitor above for gamma ray bursts and other bright sources. For these dual objectives, we find that Tantalum has a very good absorption property with atomic number , a K-shell binding energy of and high density of . For the shielding of the detector we have chosen the Tantalum shield in a way which minimizes mass as well as maximizes the dual objectives of solar X-ray flare spectroscopy and off-axis source observations.
3 Simulation of RT-2/S and RT-2/G payload
The background simulation of the RT-2/S (RT-2/G) detector is carried out with the virtual detector constructed within the Geant4 toolkit environment with the construction parameters given in Table 2. These parameter values are the same as in the onboard detector geometry, but to avoid the complexity in the detector geometry construction in the simulation we simplified some of the detector parts which are not expected to change the simulation results significantly. These simplifications consist of omitting the ribs to hold the collimator and the detector walls, simplification of the construction of the Photo-Multiplier Tube (PMT), etc. A 3D view of the RT-2/S detector which is considered in the simulation is given in Figure 4. This figure is the direct output from the simulation and agrees closely with the CAD design of the actual detector construction. We simulate the detector response for the background noise due to five major background components and a typical GRB spectrum as has been described earlier. In the following subsection, we will discuss the response of the detector for these particular background radiation under our consideration and in the subsequent subsection we will give the results for the GRB spectrum.
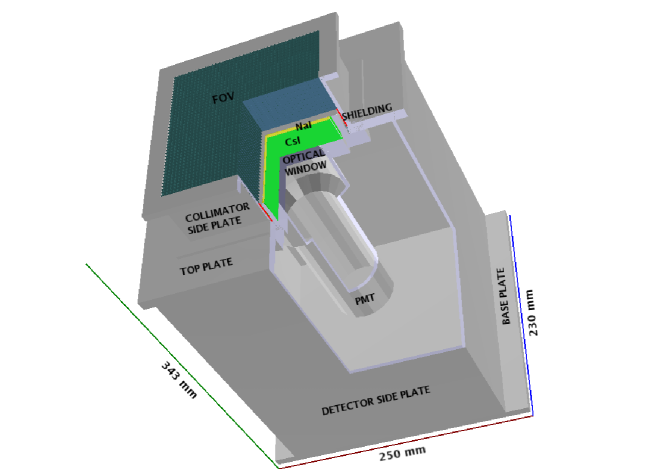
Table 2: Detector construction parameter specifications of RT-2/S
(RT-2/G) payload.
Detector Parts
Dimensions
Bottom plate
Detector Housing
(inner dimension)
wall thickness
Top Plate
hole radius
Collimator
(inner dimension)
wall thickness
FOV
Tantalum plate thickness
gap between two Ta plates ( FOV for S)
gap between two Ta plates ( FOV for G)
NaI Crystal
radius , thickness
CsI Crystal
radius , thickness
(gap between two crystals )
Optical Coupling
(Silicon Oxide) radius thickness
PMT
Upper part : radius , height
Middle part (conic section) : height
Lower part : radius , height
thickness of the whole PMT (Aluminum)
Shielding
thick Tantalum strip, height ,
around the collimator wall below the FOV to shield
NaI+CsI crystal. Shielding weight
3.1 Summary and interpretation of the background simulation results
In this section we present the energy response spectra (obtained from the simulation) in the scintillators NaI and CsI due to the various background components described in Section 2.2. These results enable us to see the contribution of various individual background components to the total background. In Figure 5a, we have shown the energy deposition spectrum in the NaI and CsI crystals for the in-flight shielding configuration. The NaI spectrum shows a low energy cut-off below . Low energy photons are absorbed by the Al filter used for protection of the crystals. The CsI spectrum, also shows a few counts in the low energy range less than . These counts are mainly due to the partial energy depositions of the higher energy photons. In higher energy range, the counts are high due to the photons coming through the collimator and not interacting on the NaI crystal and as well as due to those photons entering into the detector other than the collimator part. The peak in the NaI and CsI spectrum around is due to the Ta fluorescent emission. The detector response to the albedo Gamma-ray photons due to the Earth’s atmosphere is given in Figure 5b. Here in the figure we can see the Ta and fluorescent emission in the NaI spectrum along with the photon annihilation peak which is also visible in the CsI spectrum. Figure 5c presents the energy deposition spectrum in the NaI and CsI crystal due to the downward going protons at low Earth orbit position. We have shown the detector response spectrum in Figure 5d, for the upward going protons due to the interaction of the cosmic rays in the Earth’s atmosphere. Figure 5e depicts the energy response spectrum in the NaI and CsI crystals for the secondary neutron background spectrum. From Figure 5(a,b,c,d,e) we can conclude that the most important contributor to the prompt background noise are the CDGRB photons, while the secondary gamma-ray photons also promote a significant portion of the noise.
The results from the simulation of RT-2/G are almost identical (except the normalization in the low energy range) as that of the RT-2/S, since both of the payloads have identical configuration except the FOV of the collimator and Al shielding on the top of the collimator of RT-2/G to have higher energy cut-off (below ). So, the above results for the RT-2/S are also applicable to RT-2/G payload regarding the response of the detector.
3.2 Response of a GRB spectrum in RT-2/S
The RT-2 detectors are primarily designed for spectroscopic measurements of solar flares in the region. For efficient background rejection, a thick CsI detector was used. While designing the experiment, it was realized that above , the RT-2 detectors will act as omni-directional gamma-ray burst detectors. Here we also simulate a GRB source and give the results below.
We compare the response of the detector for a known source over the total noise level due to various background components. So we carry out a simulation for the incident GRB spectrum shown in Figure 3. Moreover we consider two source positions: on-axis () and off-axis () location with respect to the detector axis.
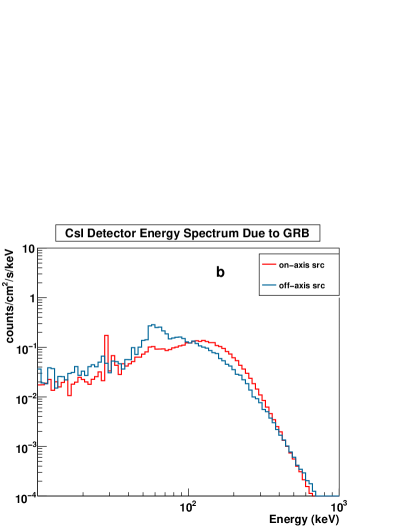
In Figure 6(a,b) we have shown the energy deposition spectrum in the NaI and CsI crystals due to the GRB incident spectrum for the on-axis () (in red colour) and off-axis () (in blue colour) source position.
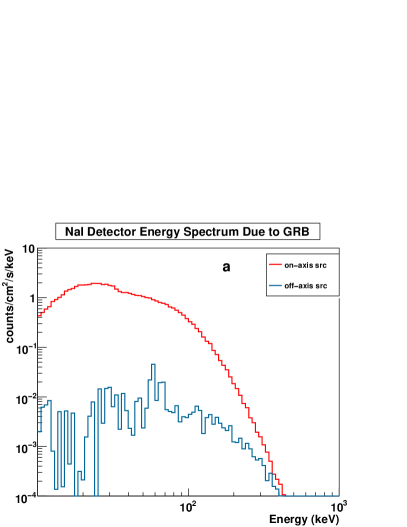
It is observed that the GRB spectrum in NaI is highly absorbed (due to the FOV walls and shielding at the collimator wall) in the entire energy range for off-axis position of the source (Figure 6a) and we can also see the peak around is due to the Ta fluorescent emission.
In case of CsI crystal, the photon energy below is getting absorbed both for off and on-axis source position. For on-axis, the photons below is mostly detected by NaI crystal and we can also notice a emission peaks around due to the and fluorescence of Iodine, whereas for off-axis the photons below are partially blocked by the shielding material around the lower part of the collimator. Detection of source photon below is less significant in CsI crystal. This feature is clearly seen for both the off and on-axis source position (Figure 6b).
In Table 3, we present the number of photons from the incident GRB which deposit energy in the NaI and CsI detectors. We have subdivided the whole energy range of into smaller energy bands. We have given both the results for the on-axis and the off-axis source positions and the counts due to the total estimated background (fourth column). The background counts within parenthesis is from the prompt sources. To obtain the total backgrounds we need to include the contribution from the long-term activations in the detector. In Section 5 we showed that this prompt background only accounts for up to of the total background in the NaI crystal. So in order to compare the photon counts due to the GRB with the total background noise, we have multiplied the background due to prompt emission by a factor of and obtained the total background and presented in in this column. This extra contribution, given that our satellite is polar, is reasonable since even for equatorial orbits the uncertainly could be a factor of 2 (Zoglauer, 2009).
Table 3: Photon counts in NaI and CsI Crystals in different energy
ranges due to the incident GRB spectrum for both the on-axis () and
off-axis () orientation of the source position and due to the
total estimated background spectrum with the simulated total prompt
background in the bracket (see text for details).
Energy range
on-axis ()
off-axis ()
total bkg. (prompt)
in (keV)
GRB
GRB
NaI
CsI
From the results of Table 3 we can see that for the spectrum of GRBs we are interested, NaI has a quite large source to noise ratio (S/N) in the energy range for on-axis case. However, for the off-axis case, the S/N does not permit to detect the source at all. On the other hand, for the on-axis case, CsI has a quite high S/N value in the energy range of and for the off-axis case this energy range gets broadened in . So this simulation of the GRB ensures the capability of such source detection by the RT-2/S instrument. Based on the orbital and detector configurations a conservative estimate suggests a detection of GRBs per year.
4 Simulation of RT-2/CZT payload
The parameters used to construct the virtual detector of RT-2/CZT payload within the Geant4 toolkit environment is given in Table 4. These parameter values are same as that used in onboard detector design and we applied some simplifications as we have already mentioned in section 3. A 3D view of the RT-2/CZT payload along with different components (e.g., detectors, CAM (Coded Aperture Mask), FZP (Fresnel Zone Plate), collimator etc.) as considered for the simulation is shown in Figure 7. This figure is the direct output from the simulation.
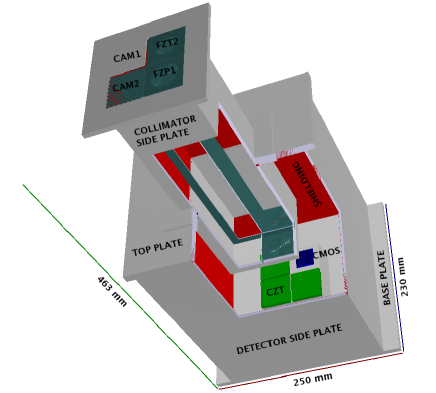
Table 4: Payload construction parameter specifications of RT-2/CZT.
Detector Parts
Dimensions
Bottom plate
Detector Housing
(inner dimension)
wall thickness
Top Plate
External Collimator
(inner dimension)
wall thickness
Internal Collimator
(inner dimension)
wall thickness
FOV
Aluminum shielded by Tantalum
two perpendicular walls to divide the collimator in four quadrants.
CZT Crystal
(3 crystals)
gap between modules
CMOS
CAM
thick Tantalum CAM on top of two collimator quadrants.
Al filter used for one CAM and other one is open to sky.
Zone Plate
thick Ta zone plates at the face and end
of the collimator on one CZT and CMOS crystals
Shielding
Tantalum around the collimator wall.
Tantalum below the top plate.
Tantalum around the detector housing side plates.
Shielding weight .
4.1 Summary and interpretation of the background simulation results
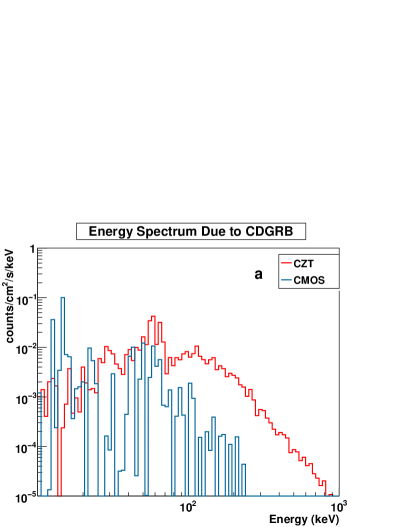
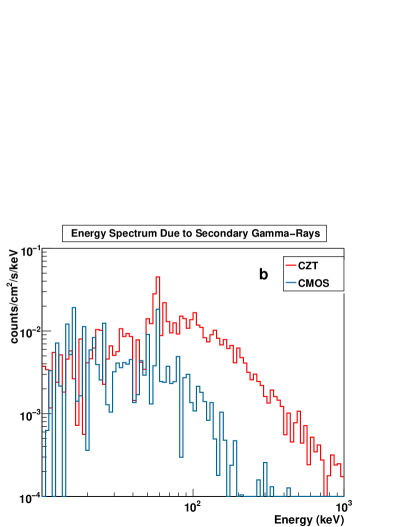
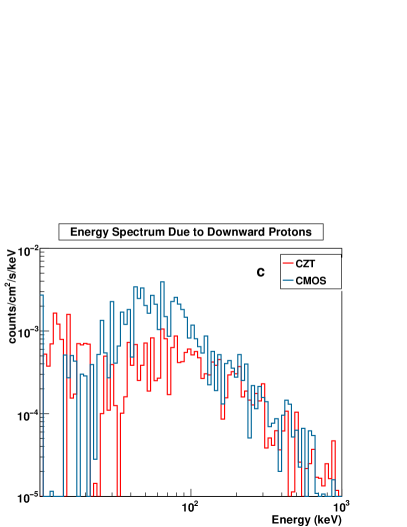
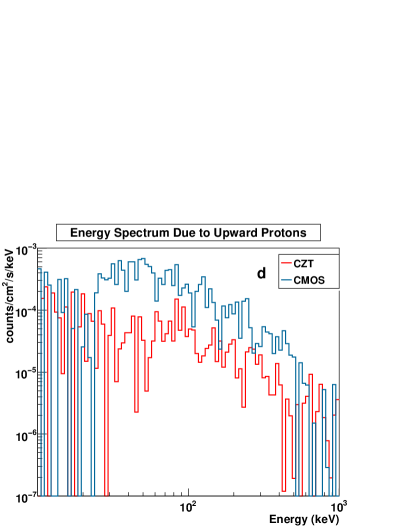
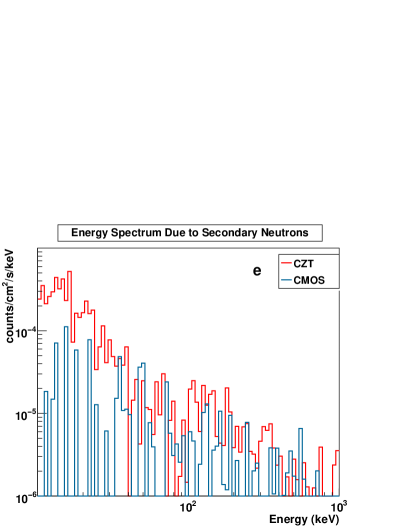
In the same way and for the same purpose as we have discussed for NaI and CsI crystals in RT-2/S instrument, we have calculated the energy response spectrum for the three CZT and one CMOS detectors in RT-2/CZT. In Figure 8a, we have depicted the energy deposition spectrum in one of the CZT and CMOS due to the CDGRB spectrum. For the CZT spectrum, we can see a larger amount of fluorescent photons (emission peak at ) due to Ta shielding of thickness on top plate and around the side plates of the payload. The simulated results for the other two CZT modules are mostly identical and hence not discussed here. The energy response spectrum in CZT and CMOS due to the secondary gamma-ray spectrum is shown in Figure 8b. These spectra also show more or less the same features as the primary gamma-ray (CDGRB) spectrum. Figure 8c presents the energy deposition spectrum in the two crystals for the downward going protons, while Figure 8d shows the same for the upward going protons. In these two cases we can see a relatively higher energy deposition in the CMOS than in the CZT. The energy response of CZT and CMOS for the secondary neutron spectrum is given in Figure 8e. Figure 8(a-e) also shows the dominance of the CDGRB and secondary photon spectrum in the noise contribution.
4.2 Response of a GRB spectrum in RT-2/CZT
We now simulate the detector for a typical GRB spectrum (Eqn. 7) as the incident spectrum shown in Figure 3 for two source location as mentioned in section 3.2.
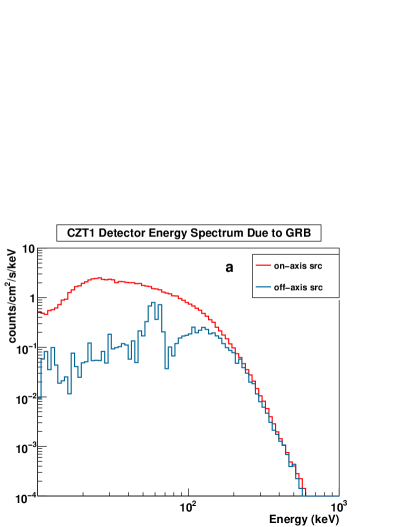
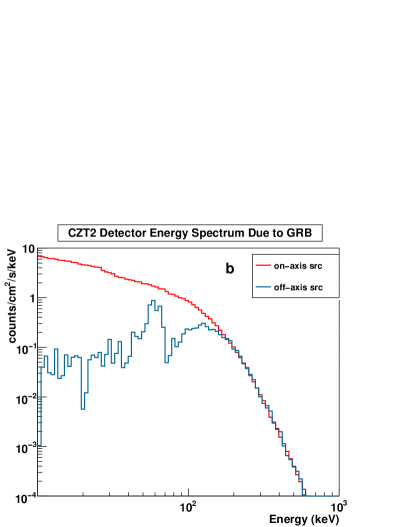
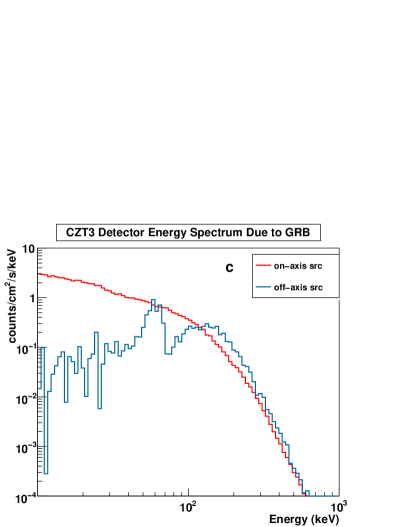
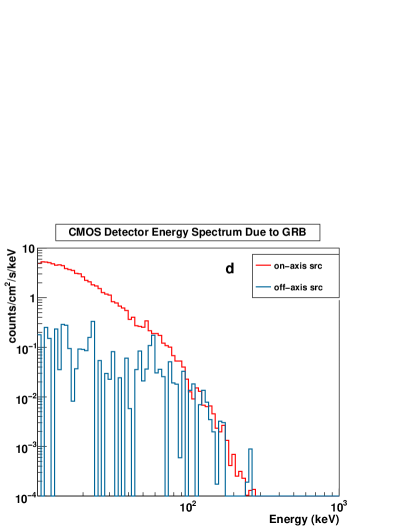
In Figure 9(a-d), we plot the energy deposition spectrum separately for the three CZT modules and CMOS detector both for the on-axis () and off-axis () GRB position. Figure 9a shows the energy deposition spectrum in the CZT (CZT1) containing a CAM along with an thick Al filter in front of the collimator facing the sky. The spectrum in the CZT (CZT2) containing a CAM at the face of the collimator is given in Figure 9b. Figure 9c presents the same in the CZT (CZT3) containing a pair of aligned zone plates (FZPs) placed at apart in third quadrant of the collimator. In Figure 9d we have shown the spectrum of CMOS detector which is also having two aligned zone plates (FZPs) placed in the fourth quadrant of collimator. It is evident from Figure 9(a-c) that all the CZT spectra are roughly the same irrespective of their different configurations (Nandi et al. 2010) of the collimator for the off-axis () source position though they differ for the on-axis source position (low energy photons are absorbed in CZT1 due to Al shielding). This is because for the off-axis source position most of the photons which are depositing their energy into CZT or CMOS are coming through the detector side plates having uniform shielding material. Those photons interacting on the mask pattern are less likely to go to the CZT and CMOS to deposit their energy. All the CZT spectra show a prominent Ta fluorescent peak (around ), caused by the shielding material.
In Table 5, we give the number of photon counts for three CZT modules and for CMOS detector due to the GRB spectrum for the on-axis () and off-axis () source positions and due to total estimated background spectrum along with the prompt background noise as discussed in section 3. We have subdivided the total energy range of into several energy bands. These results could be useful while analyzing the data from real observation (GRB) with RT-2 instruments.
Table 5: Photon counts in the three CZTs and CMOS detector in
different energy ranges due to the GRB spectrum for both on-axis ()
and off-axis () source position and due to total estimated background
spectrum with the simulated total prompt background inside the bracket (see text
for detail).
Energy range
CZT1
CZT2
CZT3
CMOS
(in keV)
on-axis () GRB
off-axis () GRB
total bkg. (prompt)
From the results in Table 5 it appears that with CZT detector, we can detect GRBs quite confidently in the energy range of keV for the on-axis case and for the off-axis case.
5 Comparison with Observed Data
We compare the simulation results for the various background components with the real data measured by the detector in its in-flight operation. We consider one set of onboard NaI spectral data of RT-2/S near the equatorial region and far from the trapped charged particle regions. This data refers to the satellite position when the instruments came out of the polar region, the count rates were found to be dropping slowly. We noticed that the low energy count rates stabilized faster than the high energy count rates. We took the background region near the equatorial region when: (a) the low energy () count rates were steady (better than a percent stability in minutes) and (b) when the high energy count rates () were steady by about in minutes.
The primary energy range of the instrument for spectroscopic measurements is in the NaI detector. Hence we have concentrated on predicting background around this region.
The comparison of the data in the energy range of with the simulated background components of primary and secondary gamma rays, downward and upward going protons (consisting primary CR and secondary protons) and secondary neutrons are shown in Figure 10.
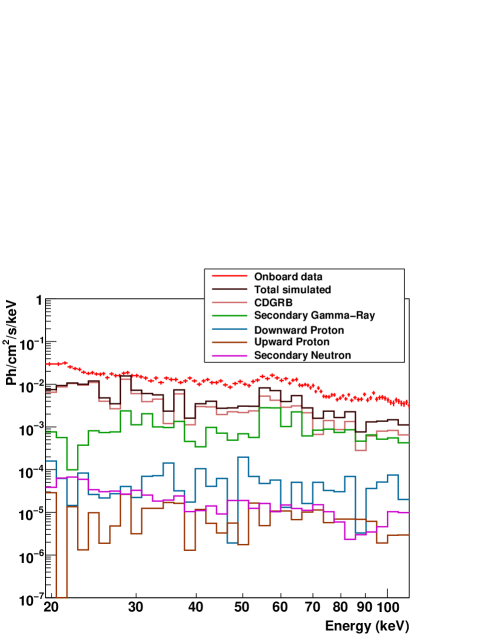
From Figure 10 we observe that the total simulated background noise due to the main sources of the prompt background components are not sufficient to explain the total measured background flux. This prompt background components are able to address only about of the measured background. The rest of the background noise is suspected to be due to the long-term detector activation which is to be considered in a future work. Among the simulated components the most significant contributor () to the background noise in the NaI crystal are the CDGRB photons. albedo photons contribute , downward going protons and rest from the other factors.
For onboard calibration of the detectors (RT-2/S and RT-2/G), we used radioactive source Co-57 (122 keV) that is placed into one of the slats of the collimator. Extensive calibration of both the Phoswich detectors (NaI/CsI) on the ground reveals that the emission line (Debnath et al. 2010) is the intrinsic detector background feature (not due to the Tantalum (Ta) shielding around the collimator mesh). The emission feature of , earlier reported by Gruber et al. (1996) was also observed in the onboard data of RT-2/S and RT-2/G (Nandi et al. 2009). The extra emission line feature at around (cutoff energy of RT-2/S is around ) could be due to the detector’s electronic noise, which was not observed during ground testing and the investigation is still ongoing. These two emission features characteristics will be taken up in a separate paper, while considering the long-term activation aspects of the background components in the detector. Also the comparison of the simulated result with the real data from the other active volumes are under investigation due to the calibration concern of the detectors.
The CsI detector in the phoswich combination is primarily used for background rejection and we use it only for very bright sources like GRBs. To investigate the background in CsI for faint sources, one also needs to simulate the exact instrument characteristics like the pulse shape for partial energy deposition in NaI and CsI. These activities would be taken up in a separate paper. We have, however, looked at the CsI spectra and ensured that the background spectral shape broadly agrees with the model prediction.
6 Discussions and Conclusions
Background simulations of space-borne payloads is one of the challenging tasks to understand the space environment as well as the effect of high energy radiation (photons, charged particles, neutrons) on the detectors itself. The effects of the major prompt background components like cosmic diffused gamma-ray background, secondary gamma-ray photons, primary cosmic-ray protons, secondary protons and albedo neutrons on the RT-2 payloads (RT-2/S, RT-2/G and RT-2/CZT) are studied in detail, which helped the background calibration and source data extraction from the RT-2 Experiment. The weight of the material (Ta) that is used for shielding purpose for RT-2/S (RT-2/G) and RT-2/CZT payload is around and respectively.
The current work of estimating the prompt background noise covers of the measured background. The rest part of the background noise is probably due to the long-term activation of the detector materials due to the CR or trapped charged particles which is to be estimated in subsequent work (Zoglauer et al. 2008; Zoglauer, 2009)
As we have already mentioned that this experiment is primarily designed for the spectroscopic measurement of Solar flares, but it is also capable of detecting GRBs. Since the energy threshold for these GRB detection is about (for off-axis source positions) (see, Figure 6b), they will be sensitive for GRBs . The probability of on-axis detection is less than 1 in 1000 and hence GRBs are not expected to be detected on-axis. As for the uniqueness of the experiment, if we have a reasonable spectral response above , it is possible to constrain the spectral parameters using the data in conjunction with other contemporaneous spectral measurements. The exercise of the present paper is to demonstrate that off-axis response can be handled in a reasonable way.
On 30th January, 2009, the CORONAS-PHOTON satellite was launched successfully and all the RT-2 instruments are functioning to our satisfaction. Already several gamma ray bursts (Rao et al. 2009; Chakrabarti et al. 2009abc) and solar flares have been detected by the instrument. Detailed reports on the on-board data quality and backgrounds would be discussed elsewhere. Detailed results on the observed GRBs and solar flares are also being submitted for publication elsewhere.
Acknowledgements.
RS and TBK thank RT-2/SRF fellowship (ISRO) which supported their research work. The authors are thankful to ICSP/TIFR/VSSC/ISRO-HQ for various supports during RT2 related experiments. We are thankful to an anonymous referee for his very helpful comments which improved the paper substantially.References
- (1) Agostinelli, S. et al.: G4-A Simulation Toolkit, Nuclear Instruments and Methods in Physics Research. A 506, 250-303 (2003)
- (2) Ajello, M. et al.: Cosmic X-Ray Background and Earth Albedo Spectra with SWIFT BAT, ApJ. 689, 666-677 (2008)
- (3) Alcaraz, J. et al.: Protons in Near Earth Orbit, Physics Letters B. 472, 215-226 (2000)
- (4) Armstrong, T. W. et al.: Calculation of Neutron Flux Spectra Induced in the Earth’s Atmosphere by Galactic Cosmic Rays, Journal of Geophysical Research. 78, 2715-2726 (1973)
- (5) Band, D. L. et al.: BATSE observations of gamma-ray burst spectra. I - Spectral diversity. ApJ, 413, 281 (1993)
- (6) Chakrabarti, S. K. et al.:GRB 090820: detection of a strong burst by RT-2 on board CORONAS PHOTON. GCN Circular No. 9833 (2009a)
- (7) Chakrabarti, S. K. et al.:RT-2 observation of the bright GRB 090926A, GCN Circular No. 10009 (2009b)
- (8) Chakrabarti, S. K. et al.:Detection of a short GRB 090929A by RT-2 Experiment. GCN Circular No. 10010 (2009c)
- (9) Dean, A. J., Lei, F., Knight, P. J.: Background in Space-borne Low-energy -ray Telescopes. SSRv, 57, 109D (1991)
- (10) Debnath, D., Nandi, A., Rao, A. R., Malkar, J. P., Hingar, M. K., Kotoch, T. B., Sreekumar, S., Madhav, V. P., Chakrabarti, S. K.: Instruments of RT-2 Experiment onboard CORONAS-PHOTON and their test and evaluation I: RT-2/S and RT-2/G Payloads, Exp. Astron. (2010, in press).
- (11) Gruber, D. E., Matteson, J. L., Peterson, L. E., Jung, G. V.: THE SPECTRUM OF DIFFUSE COSMIC HARD X-RAYS MEASURED WITH HEAO 1, ApJ, 520, 124 (1999)
- (12) Kotoch, T. B., Nandi, A., Debnath, D., Malkar, J. P., Rao, A. R., Hingar, M. K., Madhav, V. P., Sreekumar, S., Chakrabarti, S. K.: Instruments of RT-2 Experiment onboard CORONAS-PHOTON and their test and evaluation II: RT-2/CZT Payload, Exp. Astron. (2010, in press).
- (13) Kotov, Yu., Kochemasov, A., Kuzin, S., Kuznetsov, V., Sylwester, J., Yurov, V.: Set of instruments for solar EUV and soft X-ray monitoring onboard satellite Coronas-Photon. In 37th COSPAR Scientific Assembly, in Montréal, Canada., p.1596 (2008)
- (14) Mizuno, T. et al. : Cosmic-Ray Background Flux Model Based on a Gamma-Ray Large Area Space Telescope Balloon Flight Engineering Model, ApJ, 614, 1113-1123 (2004)
- (15) Nandi, A., Rao, A. R., Chakrabarti, S. K. et. al.: Indian Payloads (RT-2 Experiment) onboard CORONAS-PHOTON Mission, In Proc. of International Conference on Space Technology, Greece, G. Lampropoulos and M. Petrou (Eds.) (2009) (arXiv:0912.4126)
- (16) Nandi, A., Palit, S., Debnath, D., Chakrabarti, S. K., Kotoch, T. B., Sarkar, R., Yadav, V. K., Girish, V., Rao, A. R., Bhattacharya, D.: Instruments of RT-2 Experiment onboard CORONAS-PHOTON and their test and evaluation III: Coded Aperture Mask and Fresnel Zone Plates in RT-2/CZT Payload Exp. Astron. (2010, in press).
- (17) Sreekumar, S., Vinod, P., Samuel, E., Malkar, J. P., Rao, A. R., Hingar, M. K., Madhav, V.P., Debnath, D., Kotoch, T. B., Nandi, A., Begum, S. S., Chakrabarti, S. K.: Instruments of RT-2 Experiment onboard CORONAS-PHOTON and their test and evaluation V: Onboard software, Data Structure, Telemetry and Telecommand, Exp. Astron. (2010, in press).
- (18) Rao, A.R. et al.: Detection of GRB 090618 by RT-2 Experiment onboard the CORONAS-PHOTON Satellite. GCN Circular No. 9665 (2009)
- (19) Zoglauer, A., www.mpe.mpg.de/MEGA/software/Cosima.pdf, (2009)
- (20) Zoglauer, A., Weidenspointner, G. Wunderer, C. B. Boggs, S. E,: Status of Instrumental Background Simulations for Gamma-ray Telescopes with Geant4. IEEE NSS Conference Record (2008)
- (21) Strohmayer, T. E. et al.: ApJ, 500, 873-887 (1998)