∎
22email: dipak@csp.res.in; anuj@csp.res.in; tilak@csp.res.in
(: Posted at ICSP by Space Science Division, ISRO Head Quarters, Bangalore, India) 33institutetext: A. R. Rao, J. P. Malkar, M. K. Hingar, V. P. Madhav 44institutetext: Tata Institute of Fundamental Research, Homi Bhabha Road, Colaba, Mumbai 400005, India
44email: arrao@tifr.res.in; jpm@tifr.res.in; mkhingar@tifr.res.in; vaibhav1881@gmail.com
55institutetext: S. Sreekumar 66institutetext: Vikram Sarabhai Space Centre, VRC, Thiruvananthapuram 695 022, India.
66email: sreekumar_s@vssc.gov.in
77institutetext: Sandip K. Chakrabarti 88institutetext: S.N. Bose National Centre for Basic Sciences, JD Block, Salt Lake, Kolkata 700097, India
(Also at Indian Centre for Space Physics, 43 Chalantika, Garia Station Rd., Kolkata 700084)
88email: chakraba@bose.res.in
Instruments of RT-2 Experiment onboard CORONAS-PHOTON and their test and evaluation I: Ground calibration of RT-2/S and RT-2/G ††thanks: This work was made possible in part from a grant from Indian Space Research Organization (ISRO). The whole-hearted support from G. Madhavan Nair, Ex-Chairman, ISRO, who initiated the RT-2 project, is gratefully acknowledged.
Abstract
Phoswich detectors (RT-2/S & RT-2/G) are major scientific payloads of the RT-2 Experiment onboard the CORONAS-PHOTON mission, which was launched into a polar Low Earth Orbit of around 550 km on 2009 January 30. These RT-2 instruments are designed and developed to observe solar flares in hard X-rays and to understand the energy transport processes associated with these flares. Apart from this, these instruments are capable of observing Gamma Ray Bursts (GRBs) and Cosmic diffuse X-ray background (CDXRB). Both detectors consist of identical NaI(Tl) and CsI(Na) scintillation crystals in a Phoswich combination, having the same diameter ( mm) but different thicknesses. The normal working energy range is from 15 keV to 150 keV, but may be extendable up to 1 MeV. In this paper, we present the RT-2/S and RT-2/G instruments and discuss their testing and calibration results. We used different radio-active sources to calibrate both detectors. The radio-active source 57Co (122 keV) is used for onboard calibration of both instruments. During its lifetime ( 3-5 years), RT-2 is expected to cover the peak of the solar cycle.
Keywords:
Scintillation detectors X- and -ray telescopes and instrumentation Laboratory experiments Solar flarespacs:
29.40.Mc 95.55.Ka 01.50.Pa 96.60.qe1 Introduction
The RT-2 Experiment onboard the CORONAS-PHOTON mission (Kotov et al. 2008, Nandi et al. 2009) is a low energy -ray telescope. The experiment consists of three scientific payloads (two Phoswich detectors and one solid-state imaging device) and one processing electronic payload. The Phoswich detectors are RT-2/S and RT-2/G, which will work in the energy range from 15 to 150 keV, extendable upto 1 MeV. The solid-state imaging payload RT-2/CZT, consists of three CZT (Cadmium Zinc Telluride) detector modules and one CMOS (Complimentary Metal Oxide Semiconductor) detector (Kotoch et al. 2010, Nandi et al. 2010). Data from all these three detectors are processed by an electronic device, namely, RT-2/E (Sreekumar et al. 2010), which also interfaces with the Satellite system.
All three payloads are placed outside the hermetically sealed vessel of the satellite and co-aligned to the Sun pointing axis. The instruments have different field of view (FOV) of for RT-2/S, for RT-2/G and varying FOVs, from to , for RT-2/CZT (see Nandi et al. 2010). Though the experiment is dedicated to solar studies of high energy phenomena, this configuration also allows the study of a large number of galactic and extra-galactic X-ray sources (within around the ecliptic plane below 100 keV and half the sky in the 100 keV to 1 MeV range – the latter being due to the fact that the collimators themselves become transparent in this range). Hard X-ray detectors on board the satellite with different FOV will also help in the measurement of the spectrum of cosmic X-ray background (Sarkar et al. 2010).
The paper is divided into the following Sections. In §2, we discuss the main scientific goals of the RT-2 payloads. In §3, we describe the RT-2/S and RT-2/G instruments characteristics as well as the signal processing methods used. In §4, we present the testing set-up and the results on the test and evaluation of these instruments at the laboratory. Finally, in §5, we present our concluding remarks.
2 Goals and Scientific objectives of RT-2/S & RT-2/G
Being the nearest star, the Sun occupies a special place in astrophysical studies as it can be more closely observed than any other star. Several dedicated satellites (RHESSI, SOHO, GOES etc.) (Lin et al. 1998, Domingo et al. 1994, Harvey 2007) have been launched to understand its behavior in a wide energy band of electromagnetic radiation. Even though its surface temperature is only 6000 K, it emits X-rays and -rays up to a few MeV. This is because of rapid magnetic reconnection which produces energetic solar activities. Apart from the thermal electrons which obey the Maxwell-Boltzmann distribution, the charged particles, especially electrons, are accelerated by shocks and acquire a non-thermal (power-law) distribution. These non-thermal electrons emit energetic synchrotron emission. The Russian satellite CORONAS-PHOTON which was launched on January 30, 2009 is the last in the CORONAS series of satellites dedicated to study these types of solar activities. The RT-2 Experiment along with the high energy gamma-ray instrument (NATALYA-2M; Kotov et al. 2008) and other instruments onboard CORONAS-PHOTON (Kotov et al. 2004, 2008) will cover a wide band of energy from UV to 2000 MeV. One of the main goals of this mission is to understand the energy transport processes on the solar surface. It is may be due to plasma oscillations, or pinching or sausage instabilities in the magnetic field. Apart from this, the main objective of the RT-2 Experiment is to study (i) the time resolved hard X-ray spectra of solar flares, (ii) the galactic and extra-galactic sources near the ecliptic plane, (iii) the gamma ray bursts (GRBs) and (iv) diffuse cosmic X-ray background, in a wide energy range.
Since the mission is expected to be in orbit for the next 3-5 years, it is expected to cover the solar cycle with the peak expected in 2012. During a peak, the number of sunspots and flares go up drastically. The magnetic activities associated with the sunspots which dramatically influence the UV/soft X-ray emissions are therefore expected to peak very soon. The accompanying soft X-rays also have an impact on the Earth upper atmosphere. As it is known extreme ultraviolet radiation and the soft X-ray photons basically form the different layers of the ionosphere (upper atmosphere), which consists of C, D, E and F layers based on their ion-electron densities. During a solar flare, the electron number density and the reflection height change on the sunlit side of the Earth and Very Low Frequency (VLF) radio waves reflected by the upper atmosphere show a sharp rise in intensity. From the ab initio calculation, one can find out the source strength (solar flare) using the ion-electron density distribution in the D-layer.
Solar flares are the most powerful emission in the entire solar system. They could release energies from to ergs over a timescale extending from to seconds. It is also found that during a flare, the electrons are accelerated to keV using a significant fraction of this energy budget. From RHESSI observation, it has been established that the particle acceleration and the energy release process (Lin et al. 2003) are linked together. The instruments RT-2/S and RT-2/G offer a unique opportunity to investigate the energetics of solar flares, and hence the particle acceleration, in the keV energy range in ‘phoswich’ mode (i.e., spectral data from the NaI crystal) and in the keV – MeV energy range in the spectroscopic mode (i.e., spectral data from CsI crystal using both G1 and G2 amplifiers) during the next solar cycle. Apart from these two ‘scientific’ modes, RT-2/S and RT-2/G would be operated in two other modes, namely, the Normal mode and the Event mode. Details of these two operational modes are discussed in Section 3.4.
At the same time as the RT-2/S and RT-2/G observations will be carried about, the RT-2/CZT instrument will enable imaging the hard X-ray solar flares with high spectral and spatial resolution in the 20–150 keV energy range (Kotoch et al. 2010).
Other than this, RT-2 will also focus on the large-scale distribution of magnetic flux on the Sun. The magnetic energy stored at the solar surface may be released gradually or explosively depending on the dynamics of the magnetic field. This released energy heats up the “quiet” corona and also powers the solar wind. Search for nano-flares on the solar surface could be of interesting prospect, as both RT-2/S and RT-2/G instruments can operate in high resolution timing mode of 0.1 sec and on rare occasions (depending on the memory availability) in the time-tagged event mode with a time resolution of 0.3 milliseconds. The transient bursts on the solar surface for short durations with significant energy budget ( ergs) are termed as ‘nano-flares’ (Parker 1998), as compared to the largest solar flares of energy ergs. It has been observed from several satellite data that the time-scale variabilities of nano-flares are of sec (Hudson 1991, Shimizu & Tsuneta 1997).
It is important to study ‘nano-flares’ for several reasons. For several decades, it was a mystery, why the temperature of the solar corona ( K), the Sun’s outer atmosphere, is much higher than the temperatures near the Sun’s surface (e.g. chromosphere temperature K). But observations made by Japan’s Solar-A (Yohkoh) and Solar-B (Hinode) satellites revealed that nano-flares play an important role in the coronal (active-region) heating process (Hudson 1991, Shimizu & Tsuneta 1997, Reale, McTiernan & Testa 2009). Another important aspect is to study the distribution law of energy dependence occurrence rate of nano-flares.
The RT-2 measurements with other mission payloads’ data sets will be useful to infer the composition, flux and anisotropy of energetic ions and electrons with high spatial and temporal resolution.
3 Description of the RT-2/S & RT-2/G instruments
3.1 Phoswich Detector
RT-2/S and RT-2/G payloads consist of NaI(Tl) and CsI(Na) crystals mounted in a scintillator-phoswich assembly viewed by a photomultiplier tube (PMT). This entire assembly is procured from M/S Scionix Holland BV, The Netherlands. The NaI crystal is mm thick and mm in diameter. The CsI crystal is tapered to provide mechanical stability and at the top side it has a diameter of mm. The thickness of the CsI crystal is mm. The two crystals are optically coupled and hermetically sealed with an entrance window on the NaI(Tl) side and a viewing glass window coupled to the PMT through an appropriate light guide on the CsI(Na) side. The Phoswich combination of NaI and CsI crystals has good hard X-ray absorption properties due to the relatively high effective atomic number (32 for NaI and 54 for CsI crystal) and efficient optical light emission (415 nm wavelength emission from NaI and 420 nm wavelength emission from CsI) (Knoll 1999). The NaI(Tl) crystal is sensitive to X-ray photons of keV, whereas CsI(Na) is effective for high energy X-ray/-rays of keV as well as to charged particle background.
Another important use of both crystals in the Phoswich mode is for the background rejection. The light signal from the CsI(Na) crystal has a different scintillation decay time (650 ns) than that from the NaI(Tl) crystal (250 ns) and this distinction is used to eliminate non X-ray background in the NaI crystal. The charge particle background will be removed by the upper energy threshold. The Phoswich assembly is viewed by a mm diameter photomultiplier through a mm thick light guide. A schematic drawing of ‘phoswich’ assembly of NaI(Tl) and CsI(Na) crystals with the PMT is shown in Figure 1.
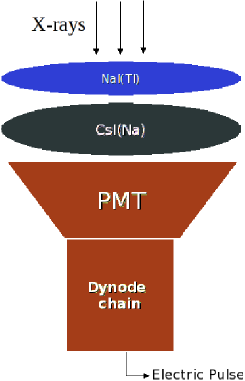
The interaction of X-ray photons of energy up to 100 keV with NaI and CsI crystals is fully dominated by the photoelectric process and thus absorbed radiation (secondary electron-hole pair absorbed by the impurities) converts into light photons (due to the decay of the excited impurities). These light photons eventually strike the photo-cathode of the PMT (Knoll 1999) (gain 106) and converted into narrow electrical pulse whose magnitude (pulse height) is proportional to the energy of the incident radiation.
The energy resolution (FWHM) of the scintillator Phoswich is expected to be at keV and the pulse height across the crystal should be less than 3%. The radioactive isotopes 241Am ( keV), 57Co ( keV), 109Cd ( keV and keV) were used for laboratory calibration (energies in the parentheses correspond to the major emission lines of the respective radio-active sources), and results are discussed in section §4. The entire system will be calibrated in flight using a nano-Curie 57Co source.
Electronics of both instruments (schematic drawing of one of the payloads is shown in Figure 1) are identical, the only difference is that RT-2/G has one thin Al sheet ( 2 mm) above its collimator, to strongly decrease the low energy photons in the energy range of to keV. Indeed, solar flares exhibit a wide range in intensity and spectral shape. A bright solar flare with a steep spectrum would produce copious amount of low energy (10 – 20 keV) photons rendering spectral measurements above 20 keV difficult as the instrument will be saturated. To deal with such contingencies, we covered RT-2/G (identical in all other aspects with RT-2/S) with a filter to decrease low energy photons.
3.2 Electronics of RT-2/S & RT-2/G
Both payloads (RT-2/S & RT-2/G) are interfaced with the satellite system (SSRNI, a Russian acronym which means System of Collection and Registration of Scientific Information or SCRSI in English) through the RT-2 electronic processing device (RT-2/E). RT-2/E receives necessary commands from the satellite system and passes them to the individual detector systems for proper functioning of the detector units and it also acquires data from the detector systems and stores in its memory for further processing. Detailed description of the functioning of RT-2/E and data management scheme are discussed in Sreekumar et al. (2010).
The electronics system in the detector module consists of i) front end electronics for the Phoswich scintillator, ii) electronics for pulse shape (PS) and pulse height (PH), iii) FPGA (Field Programmable Gate Array) based data packaging system, iv) high voltage (HV) DC-DC converters and distribution box and v) low voltage DC-DC converter. The block composition of detector electronics is shown in Figure 2.
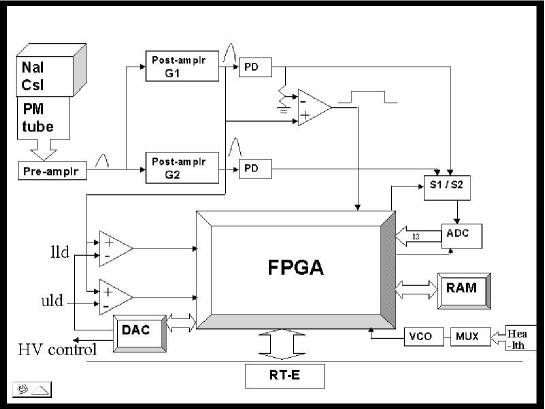
The electronics system receives signals from the NaI(Tl) / CsI(Na) scintillator Phoswich detector assembly. These signals are analyzed and the details are discussed in the next section (§3.3). The data are encoded in the proper format for dispatching to the RT-2/E device. Since it is very difficult to handle a large range of energy by a single amplifier, the entire energy range of the Phoswich detector is covered by two different amplifiers, namely G1 and G2. This is done electronically by comparing the detector pulse output to two analog voltages LLD (Lower Level Discriminator) and ULD (Upper Level Discriminator) so that pulses between LLD and ULD are deemed to be G1 and above ULD is deemed to be G2. G1 contains information pertaining to both NaI(Tl) and CsI(Na) crystals (which can be segregated using the pulse shape) and G2 is presumed to be coming from the CsI(Na) crystal. The pulse shape (PS) is measured using a 7 bit counter and the discrimination is done digitally by comparing the pulse shape with pscut (ps pscut is deemed to be coming from the NaI crystal and ps pscut from CsI).
The pre-amplifier is designed using discrete components. It is used in an inverting operational amplifier mode which converts the -ve input from PMT into +ve pulse with a gain factor of 1 to 2. Two post amplifiers (G1 & G2) with different gains and different filters are used to cover the different energy ranges of interest. These discrete post amplifiers are of non-inverting nature with provision of adjustable gain (during ground testing, not by command). Amplifier G1 will cover energy range from keV (the approximate energy ranges are 15 keV - 100 keV for G1-NaI; 30 keV - 210 keV for G1-CsI) & G2 from keV to MeV. These ranges can be scaled by changing the HV through command and the LLD (15 keV) can be separately changed.
The NaI and CsI crystals have different decay times. The gain from these two detectors (crystals) is a function of the time constant of the pre-amplifiers (which is common for both detectors), resulting in a gain difference (of a factor of 1.8) of the outputs of NaI and CsI for the same energy deposition. These energy ranges were measured during the ground calibration. Also G1-NaI, G1-CsI & G2 spectra and light curves are divided into 8 different counters (4 counters for G1-NaI, 2 counters for G1-CsI and 2 counters for G2). The channel numbers of these counters and the corresponding energy ranges are shown in Table 1, for the default ground settings. These values can be changed by command. The electronics of both instruments are identical and have the same working energy ranges. The basic differences of both payloads are mentioned in Section 1 and Section 3.1.
Table 1: RT-2/S & RT-2/G channel boundary (default) and energy ranges
| Amplifiers | Counters | Channel ranges | Energy Ranges (keV)* | |
| (default) | RT-2/S | RT-2/G | ||
| C1 | 0 - 140 | 13 | 13 | |
| C2 | 141 - 280 | 13 - 27 | 13 - 27 | |
| G1-NaI | C3 | 281 - 560 | 27 - 55 | 27 - 56 |
| C4 | 561 - 1023 | 55 - 102 | 56 - 104 | |
| C5 | 0 - 256 | 33 | 34 | |
| G1-CsI | C6 | 257 - 1023 | 33 - 209 | 34 - 209 |
| C7 | 0 - 64 | 48 | 246 | |
| G2 | C8 | 65 - 255 | 48 - 570 | 246 - 1000 |
*Differences in energy boundaries of all 8 counters (C1,…,C8) of both payloads (RT-2/S and RT-2/G) are due to different technical setting of operational conditions (eg. HV, LLD, ULD, PS cut etc.).
The operational aspects of both payloads are identical. They operate with 27 Volt (Power bus of 27 V, from the satellite system, is routed through RT-2/E). The total power consumption is limited to 4.50.5 Watt for each payload. A low voltage MDI DC-DC converter is used to convert the input voltage (27 Volt) to 15 Volt and +5 Volt to drive the different components of the individual payloads. The +15 Volt is also converted separately through a voltage regulator circuit to high voltage ( 700 Volt) needed for biasing the PMT that is operable in a 400-900 V range. The HV can be commanded to any value in this range with an accuracy of 4.5 Volt. The Pulse Shape Discriminator (PSD) of the two crystals (NaI & CsI) and Lower Level Discriminator (LLD) for the two amplifiers (G1 & G2) can be also commanded. Voltage Control Oscillator (VCO) is used to monitor the instrument health parameters, such as +5 Volt supply, temperature (Thermistor), High Voltage (HV) & LLD.
3.3 Signal processing method in RT-2/S & RT-2/G
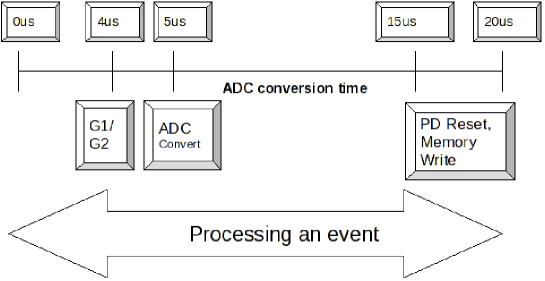
When an incident radiation (X-ray event) interacts with the NaI(TI) or CsI(Na) crystal, it gives out light photons which are converted into electrical pulses by a PMT. Light outputs from NaI and CsI crystals have decay time scales of 250 ns and 650 ns respectively. Pulses from the detector (crystal) are amplified in a pre-amplifier and two post amplifiers (G1 and G2). The output from the selected post amplifier (G1 or G2) is digitized using an analog to digital converter (ADC). The ADC is 12 bits wide and has a typical conversion time of 10 s. The block diagram of time scale for processing of an event is shown in Figure 3 and the events have a fixed dead time of 20 s.
The peak of the pulse output from the detector is proportional to the charge deposition in the crystal and hence the pulse height (PH) denotes the radiation energy. PH is converted into a 12 bit digital data and sent to FPGA. PS denotes the pulse decay time, which gives a hint of whether the event is occurring in NaI or CsI. PSD data is directly transmitted to the FPGA in a 1 bit format. The value of this bit (i.e, based on the PS information) is determined by the FPGA. This data is stored, by the FPGA, into a memory, for a time determined by RT-2/E. RT-2/E will read this data every second. In the Normal mode, the time required to send the data from RT-2/S (RT-2/G) to RT-2/E is sec. In the Event mode, it depends on the number of events occurred and the maximum time required is 1 sec. The maximum number of events to be handled in event mode is 7360 events. This restriction is due to the onboard memory size. Detail discussion of the two operational modes (Normal and Event mode) are given in the next section.
3.4 Data specifications and operation of RT-2/S & RT-2/G
As we already mentioned, there are two different modes in which RT-2/S and RT-2/G can be operated - the Event mode and the Normal mode. In the Event mode, every event is time-tagged with an time accuracy to 0.3 ms and in the Normal mode all the spectral data are accumulated. Here, eight channel count rates are stored every 10 ms and are sent to RT-2/E every second. The Normal mode data are processed in RT-2/E with a best possible time resolution of 1 s for the full spectrum and 10 ms for the 8 channel count rates.
A ‘pure’ event (registered X-ray event on the detector) consists of a pulse height (PH) of 12 bits, a pulse shape (PS) of 7 bit, an amplifier identification (G1 or G2) of 1 bit and the time of registration of the events of 12 bits. Therefore, the first 20 bits carry the spectral information and the last 12 bits carry the time-tagged information of each event. In the Event mode, time-tagged information is associated with the events and it is incremented after every event, whereas in the Normal mode time-tagged information is used to count the total no. of events that are registered in every 10 ms (calculation is done internally by the FPGA of the detector processing electronics). Data specifications of the two different modes are given below.
3.4.1 Event mode
In the Event mode, each detector ‘event’ is coded into 32 bits (4 bytes). The maximum number of events that can be stored in the memory is 7360 events, which are sent to RT-2/E, whenever ‘1 sec’ command is received. The event data structure is given in the following format:
-
Event block: 32 bits number of events (the number of maximum events that can be stored in the memory is 7360). Each event consists of 32 bits (D0-D11: 12 bit ADC, D12: 1 bit G1/G2 Selection, D13-D19: 7 bit PSD and D20-D31: 12 bit Timing) data.
The Event mode is basically used to verify the detector functionality as in this mode, the data directly come to the processing electronic device (RT-2/E) from the detectors. For scientific purposes, this mode could be operated to make high time resolution (0.3 ms) observations such as the Crab Nebula. Due to the onboard memory restriction, ‘memory full signal’ will be noticed for an observation longer than s and the system will go to the ‘BAD’ mode (i.e., non accumulation of scientific data). Restriction of the operation in this mode could be done by time-tagged commands to avoid memory overflow.
3.4.2 Normal mode
In the Normal mode, the event data (20 bits of scientific information and 12 bits of timing data), along with the health parameters encoded in VCO, are packaged by the FPGA and kept in a memory page. They contain a header block including the health parameters and the counts, spectrum block, timing block with high time resolution of the counter. The normal mode data has the following format:
-
Header block (18 bytes): VCO (2 bytes) and 8 counters (16 bits each) based on the PH values. The counter values are total counts over 4 channel intervals (PH between 0 to ch1, ch1 to ch2, ch2 to ch3 and ch3) in G1-NaI; over 2 channel intervals (0 to ch5 and ch5) in G1-CsI and over 2 channel intervals (0 to ch7 and ch7) in G2. Header contains mode ID - 0: Normal mode and 1: Event mode.
-
Spectrum block (4864 bytes): G1-NaI (PH) : bytes + G1-CsI (PH) : bytes + G2 (PH) : bytes + PS : bytes.
-
Timing block (1600 bytes): 100 Timing blocks counters bytes (counters in each bin will count for 10 ms).
Table 2: RT-2/S and RT-2/G data specifications
| VCO data: (2 bytes): | |||
| D15 | D14-D12 | D11-D0 | |
| Mode Id (0/1) | VCO Channel Numbers (0-7) | VCO Counts (values) | |
| Scientific Data in the NORMAL Mode (Id: ‘0’) (Total 6480 bytes): | |||
| G1-NaI | 2048 bytes | 1024 spectral ch. 1 word* | |
| Spectrum | G1-CsI | 2048 bytes | 1024 spectral ch. 1 word |
| G2 | 512 bytes | 256 spectral ch. 1 word | |
| PSD | 256 bytes | 128 spectral ch. 1 word | |
| Timing | 800 words | 1600 bytes | 8 ch. 100 blocks 1 word |
| Counters | 8 words | 16 bytes | 8 counters 1 word |
| Scientific Data in the EVENT Mode (Id: ‘1’) (4 bytes/event): | |||
| Time | PSD | G1/G2 | ADC |
| D31-D20 | D19-D13 | D12 | D11-D0 |
*1 word = 2 bytes = 16 bits.
The data structure of stored (scientific) data of RT-2/S and RT-2/G are summarized in Table 2. On the receipt of a ‘1 sec’ command from RT-2/E (issued every second), the stored data are sent to RT-2/E for further processing in specific formats (Sreekumar et al. 2010). The header, the spectral and the timing blocks are sent in the Normal mode and the header and the event block are sent in the Event mode. These modes of operation could be decided by ground commands (Sreekumar et al. 2010).
4 Tests and Evaluation of the RT-2/S & RT-2/G payloads
It is essential to carry out extensive space qualification tests (on ground) of the scientific payloads in order to ensure that they can sustain and perform according to expectations during their in-flight lifetime. An instrument’s proper functionality (scientific performance) is based on High Voltage (HV) and LLD/ULD operation, stability of Pulse shape (PS) and Pulse height (PH), health parameters, quality of spectral (scientific) data etc. Both payloads (RT-2/S and RT-2/G) were space qualified independently. The space qualification tests we performed include:
-
Vacuum Test: Payloads were kept in Vacuum chamber of pressure 10-6 mm of Hg at 23∘C. During this test, the instrument’s functionality was verified. Major test result of HV variation is summarized in Section 4.3.
-
Thermal Test: Both payloads were tested at various temperature conditions ranging from -10∘C to 40∘C. In this condition, the functional tests results are summarized in Section 4.4 and 4.5.
-
Vibration Test: Vibration test is essential to check the resonance effect on the detector structure as well as electrical card systems of the payloads. Before and after this test, instruments functionality were verified and we did not find any malfunction in both instruments.
-
EMI Test: The electro-magnetic interference (EMI) test is important for the RT-2 instruments. Radiation from the other devices (such as radio transmitting device on the spacecraft) may affect the normal behavior of the RT-2 payloads. While doing this test, functionality of both detectors were verified.
-
SRC Test: The standard room condition (SRC) test was carried to check the normal functionality of both detectors. This test was carried out after each space environment test. This test includes the verification of total power consumption, health parameter, HV and LLD/ULD operation, scientific data etc.
During these laboratory tests, the complete functioning of both RT-2/S and RT-2/G payloads were investigated and we calibrated HV, LLD, PS and PH variation with temperature, energy spectra etc. Testing of both payloads were carried out for a period of three months. The results are discussed in the following sections. In the next section, the lab testing set-up is described.
4.1 Testing set-up of RT-2/S and RT-2/G
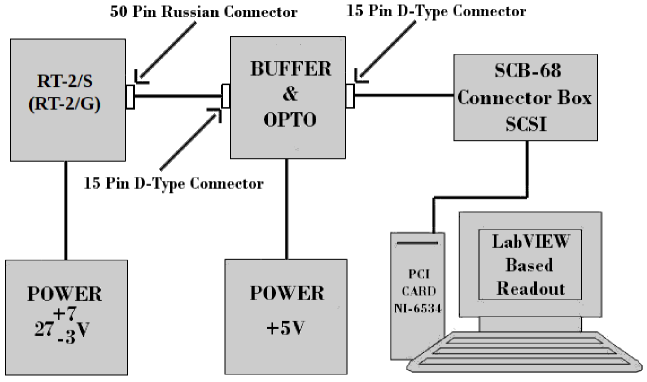
The overall testing of RT-2/S, RT-2/G, RT-2/CZT & RT-2/E were carried out with Ground Check-Out system (KIA, a Russian acronym). In reality, KIA mimics the total functionality of the Satellite system (SSRNI) for the RT-2 system. We used the check-out software written in LabVIEW platform to test the individual and complete packages (payloads). Details of the overall set-up schemes are discussed in Sreekumar et al. (2010).
We tested the instruments by directly interfacing it with a PC via the OPTO device, the SCB-68 connector box and the NI data acquisition card (PCI 6534). The OPTO device was used to isolate the payloads electrically from the PC system using a buffer and an opto-isolator. The LabVIEW based software along with the OPTO device mimics the functioning of the processing electronic device (RT-2/E). Figure 4 shows the schematic block diagram of the testing set-up used.
The complete control of the instrument operation was done by executing series of commands setting the channel boundary, the HV, the PS cut and the LLD value of each payload. The command structure used to set the different instrument parameters is given in Table 3.
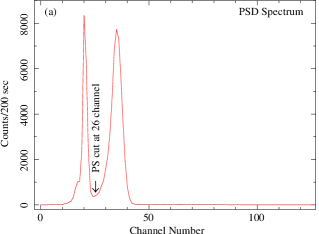
RT-2/S & RT-2/G are normally operated with a high voltage (HV) of 710 Volt (command: hx07A6 for S, hx27A6 for G), a LLD threshold of 0.86 V (command: hx0628 for S, hx2628 for G) and a PS cut value equal to channel 26 (command: hx051A for S) and channel 28 (command: hx251C for G).
Table 3: RT-2/S & RT-2/G detector commands
| Command Type | HEX Command of | Description | |
| RT-2/S | RT-2/G | ||
| ‘1 sec’ | 0800 | 2800 | Set detector in normal mode |
| command | 0801 | 2801 | Set detector in event mode |
| 0802 | 2802 | Corona override* | |
| Range setting | 00xx | 20xx | Set ch. boundary for G1-NaI (ch1) |
| command** | 01xx | 21xx | Set ch. boundary for G1-NaI (ch2) |
| (value = ‘xx’ times 4, | 02xx | 22xx | Set ch. boundary for G1-NaI (ch3) |
| except ch7 boundary) | 03xx | 23xx | Set ch. boundary for G1-CsI (ch5) |
| 04xx | 24xx | Set ch. boundary for G2 (ch7) | |
| PS cut value | 05xx | 25xx | Set PS cut value (pscut) to separate |
| (7bit value) | G1-NaI & G1-CsI spectra | ||
| DAC setting | 06xx | 26xx | Set LLD value from DAC |
| (8bit value) | 07xx | 27xx | Set HV value from DAC |
| RAM select | 0c00 | 2c00 | Select section 1 (256 Kbytes) of RAM |
| command | 0e00 | 2e00 | Select section 2 (256 Kbytes) of RAM |
*A facility is also kept to suppress the automatic corona sensing and this can be activated by the ‘corona-override’ command.
**Range setting command: ‘xx’ refers to HEX value. The actual channel boundary is given by four times of the ‘xx’ value for ch1, ch2, ch3 and ch5, whereas for ch7 the value is just ‘xx’. For example, if channel boundary of ‘ch1’ is to be set at 140 channel, then ‘xx’ value should be hx23 (as hx23 = dx35 and original channel value is 35 x 4 = 140 channel).
4.2 Health parameters of the RT-2/S & RT-2/G instruments
There are eight VCO channels giving health information on each instrument. Six over the eight channels were configured to certain voltage levels, which are given in Table 4. Each VCO channel shows some count values that can be related to a physical or instrumental parameter thanks to a dedicated calibration. As an example, the variation of VCO counts for HV variation is shown in Figure 5. The different health parameters to be monitored during various space environmental tests are given in Table 4. The channels 3 & 7 were kept unused.
Table 4: RT-2/S & RT-2/G health parameters (VCO channels)
| Channel No. | Description | Operating Voltage |
|---|---|---|
| Level | ||
| 0 | Supply Voltage | 5.0 0.5 V |
| 1 | Thermistor | 1.5 - 5.5 V |
| 2 | Supply Analog | 5.0 0.5 V |
| 3 | NC* | 0 V |
| 4 | HV Feedback | 1.5 - 5.0 V |
| 5 | HV Reference | 1.5 - 5.0 V |
| 6 | LLD | 0.5 -1.6 V |
| 7 | NC* | 0 V |
*NC: not configured
4.3 High Voltage (HV) calibration of RT-2/S
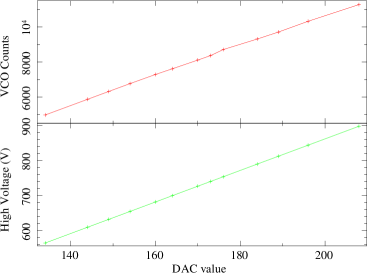
The normal operation of HV in space environment is an important issue, as the present detectors functionality depends on HV operation. So, we calibrated the HV of both instruments during the Vacuum test, which mimics the space environment conditions. The high voltage (HV) calibration of the RT-2/S payload was done by changing input digital to analog converter (DAC) values by steps through commands. Each DAC value corresponds to different HV and so different VCO counts. DAC values were varied from 134 to 208 and corresponding VCO counts (channel 5) were found to be varying from 4976 to 11280. The HV calibration result is shown in Figure 5. It is found that the instrument is operable in the linear regime of HV variation from 565 to 900 Volt (within the specified operating range of PMT). During each step of HV variation, we checked the Pulse height (PH) variation, as it is important for calibration of the energy spectrum. We also found similar behavior of HV variation of the RT-2/G payload.
4.4 Thermistor calibration of RT-2/S
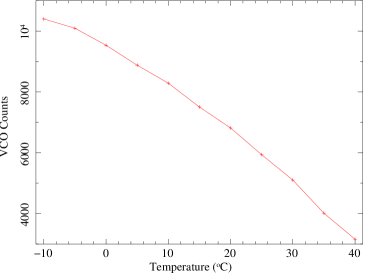
The thermistor is the temperature sensor placed inside each instrument to monitor its temperature variation. The sensor (resistor-type) is the same on both instruments. The thermistor resistance, which changes with temperature, is measured as VCO counts. Through the monitoring of the VCO counts (channel 1), we can calibrate the temperature of the payload. The instrument is operable in the temperature range from -10∘C to +40∘C. Therefore, we measured the temperature variation of the thermistor in the same temperature range. The VCO count variation with temperature is shown in Figure 6. The plot is not a linear function, because the in-built resistance of the thermistor varies non-linearly with temperature. The thermistor resistance is coupled to the VCO circuit to measure the voltage change (see Table 4) and hence the VCO counts. Looking at the VCO counts (channel 1) from the scientific data, one can estimate the onboard payload temperature.
We did the temperature related test of both instruments for long duration. We kept the instruments inside a thermal chamber for at least 3-4 hrs to attain a particular temperature, such that each part of the instrument get heated uniformly. Once the thermal equilibrium is reached, we verified the normal functionality (health parameter, temperature, spectral information etc.) of each instrument. We also found similar behavior in temperature variation for the RT-2/G payload.
The nominal operating temperature of both instruments is 23∘C. Initial results from the onboard data showed that the temperature of both payloads are maintained at comfortable operating range of +18∘C to +25∘C (Nandi et al. 2009).
4.5 Pulse shape (PS) & Pulse height (PH) variation with temperature of RT-2/S
The study of PS and PH variation is important as both change with temperature and therefore this may have some consequences on the operation of the instruments. Indeed, PS denotes whether an event is occurring in the NaI or CsI crystal in the PSD spectrum. Therefore, the stability of PS is crucial to ensure the reability of the spectral information coming from both crystals. So, if there is any change in the PS cut value due to a temperature change, we can adjust the change in PS cut through commands. PH gives some information on the energy of an event. As an example, PH has a value of around channel 600 for 241Am 59.5 keV photons in the NaI crystal. From channel-energy calibration (discussed in the next section), we can derive the energy resolution as well as the gain (keV/Chan) of both instruments. If there is any change in gain, we can adjust the gain through a HV command.
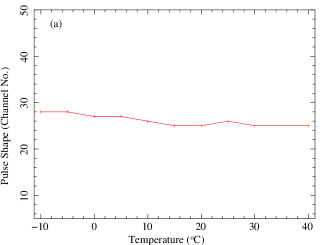
We made a systematic study of PS and PH variation with temperature over the in-flight operating temperature range (from -10∘C to +40∘C). In Figure 7(a), the PS variation with temperature is shown. PS appears to be almost stable over the operating temperature range with a maximum variation of 7% with respect to the average PS value.
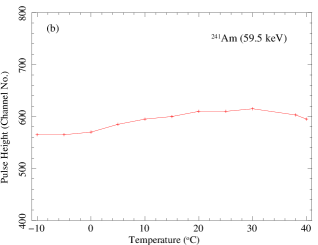
In Figure 7(b), we plotted the pulse height (PH) variation of G1-NaI spectra with temperature varying from -10∘C to 40∘C. To study the temperature effect on PH, we used the 241Am 59.5 keV line as a reference. At the room temperature (+C), PH is stable at around channel 600. The PH variation is observed to be less than 6% over the entire temperature range.
We also performed the same PH measurement for G1-CsI spectrum and found similar PH variation using a 57Co 122 keV line in the G1-CsI spectrum. But, we did not measure the PH variation of G2 spectra. PS measurement is not applicable to G2 spectrum, as G2 spectral data directly come from the CsI crystal.
We also thoroughly studied the PS and PH variation of RT-2/G detector with temperature and we found similar results for PS and PH variation of RT-2/G.
4.6 Calibration of the G1-NaI spectral response of both RT-2/S and RT-2/G
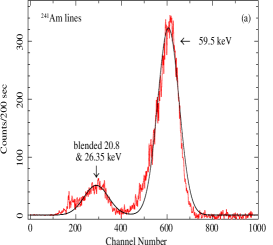
To calibrate the G1-NaI spectrum (of both instruments), which covers 1024 channels, we used two strong radio-active sources (241Am & 109Cd). The main emission line energies of 241Am are at 13.95 (13.3%), 17.74 (19.4%), 20.8 (4.9%), 26.35 (2.4%) & 59.54 (35.8%) keV and for 109Cd are at 22.16 (84%) & 88.04 (4%) keV (in the parenthesis, the source strength of respective emission lines is mentioned. See for reference, http://ie.lbl.gov/education/isotopes.htm). For the calibration purpose, we used only three emission peaks (59.54 keV of 241Am and 22.16, 88.04 keV of 109Cd) of these two sources, as all of the three lines are well separated in energies (no chance of blending with one another). The low energy emission lines (13.95 and 17.74 keV) are not used for calibration, as both lines are not resolved completely in RT-2/S and suppressed in RT-2/G due to the Al filter and too weak when compared to the 22 keV emission line of 109Cd emission. The energy spectra of G1-NaI of both instruments are shown in Figures 8(a,b) and 9(a,b). Both spectra are taken in identical operational condition with the same exposure time of 200 sec. The standard emission lines of 241Am and 109Cd are detected in the NaI spectra along with a weak background continuum. The difference in peak amplitude of 241Am (or 109Cd) emission feature in RT-2/S and RT-2/G is mostly due to the difference in operational setting conditions, such as HV and LLD setting, PS cut value etc. of both instruments. The significant amplitude difference could not be due to Quantum Efficiency (QE) difference (although we did not perform any QE test for both instruments) as both the crystals (detectors) are completely identical in nature.
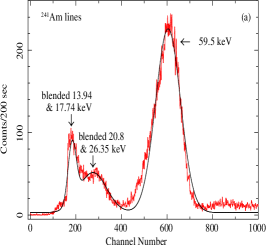
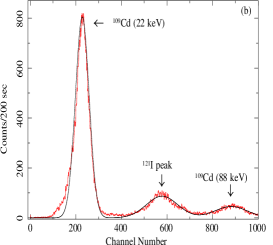

We fitted each peak profile (marked with solid black line) using a Gaussian in order to find their centroid values (channel numbers). Importantly, it is noted that the 241Am (59.5 keV) line is asymmetrical in nature towards the low energy (Figures 8(a) and 9(a)), while other emission lines are almost symmetrical in nature. The asymmetry is due to the superposition of the background line (121I decay peak, channel values are close to the 241Am @ 59.5 keV line, see Table 5). This line is clearly seen in Figures 8(b) and 9(b). The centroid values of all the emission lines are measured in channel number using the background subtracted data. The characteristics of the background spectrum are discussed in the next section.
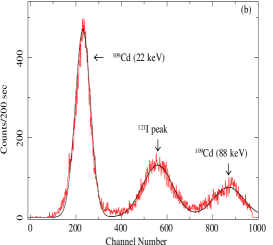

Knowing the channel values of the line centroids, we are able to compute the energy scale. Since the detector spectral response should be linear, we fitted a linear function to our measurements using the least square fit technique. The G1-NaI channel-energy calibration plots are shown in Figure 8(c) and in Figure 9(c) for both instruments. The derived relation is useful to calibrate the first four channel boundaries (see Table 1) of both instruments. The lower and upper energy thresholds of the G1-NaI energy scale are around 13 keV and 100 keV with a gain factor of 0.101 keV/Chan for RT-2/S and of 0.104 keV/Chan for RT-2/G, respectively. The differences in energy boundaries of all four channels between both instruments (see Table 1) are due to the different technical settings of the operational conditions (e.g. the HV setting, LLD/ULD setting and PS cut values etc.).
Figure 8(a) shows two emission lines at low energy. The two features correspond to two blended lines: i) 13.95 keV and 17.74 keV; ii) 20.8 keV and 26.35 keV. Because it is impossible to resolve these lines, we used a single Gaussian line profile to fit these blended lines and to derive their mean line centroid. Note that for RT-2/G only the second blended line (20.8 keV and 26.35 keV) is seen due to the Al filter. The fitted channel numbers and calibrated energy values of all the different emission lines are shown in Table 5 along with their corresponding 1 sigma errors. From Figures 8(a) and 9(a), it is evident that though the lower energy threshold of both instruments are at 13 keV (see Table 1), there is a significant difference in amplitude at lower energies due to the presence of the Al filter.
Table 5: Identification of emission lines and their channel-energy calibration
| Energy Peaks | RT-2/S | RT-2/G | ||
|---|---|---|---|---|
| (keV) | Channel No. | Energy (keV) | Channel No. | Energy (keV) |
| Emission lines used for calibration: | ||||
| 22.00 | ||||
| 59.50 | ||||
| 88.00 | ||||
| Calibrated emission lines: | ||||
| 13.94 & 17.74 | - - - | - - - | ||
| (blended peak) | ||||
| 20.8 & 26.35 | ||||
| (blended peak) | ||||
| 121I decay peak | ||||
| (58.00 keV) | ||||
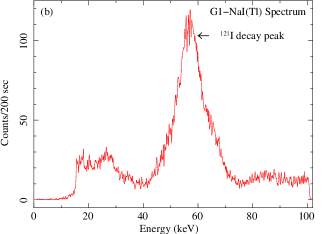
As mentioned earlier, there is a prominent background line observed at around 58 keV (see Figs. 8(b) & 9(b)). This line is due to activation of the Iodine in the NaI/CsI crystal via inelastic scattering of 57Co gamma-rays producing a 121I decay peak (see Gruber et al. 1996, Rothshild et al. 1998, Nandi et al. 2009). As the exact energy of this emission line is ‘unknown’, we could not use it in the calibration of the energy scale even if its intensity is larger than the 88 keV 109Cd line. Using the derived channel-energy relation, the 121I decay peak line is found to be at 57.19 keV and 56.05 keV for RT-2/S and RT-2/G respectively (see Table 5). However, once the energy of this particular line is known, it becomes an useful tool for onboard calibration of G1-NaI spectra for both instruments.
The scintillator crystals are low to medium energy resolution (, where is the FWHM of the Gaussian at the particular energy E) detectors with energy resolution of about 18% at 60 keV. The energy calibration need to be a factor of 10 better than the basic energy resolution, hence we have targeted an energy calibration accuracy of about 1 - 2 keV. The measured G1-NaI energy resolution is around 17.54% and 17.68% at 59.5 keV for the RT-2/S and RT-2/G instruments, respectively. We performed similar energy resolution measurements with other sources to study the behavior of energy resolution vs. energy (Figures 10(a) and 10(b)). The results are quite satisfactory and both the plots (i.e., energy resolution vs energy) are fitted with a simple power-law of index -0.123 and -0.127 for NaI spectra of S and G respectively.


In the next section, we discuss the G1-CsI and G2 energy calibration procedure.
4.7 Laboratory Calibration of RT-2/S & RT-2/G Spectra
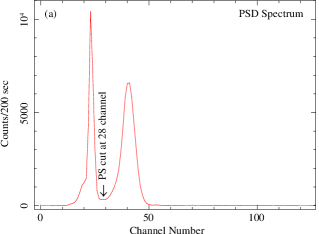
As already discussed, both instruments have three separate energy spectra: G1-NaI, G1-CsI and G2 with different characteristics. The G1-NaI and G1-CsI spectra cover 1024 channels, whereas G2 spectrum covers only 256 channels. PSD technique is used to discriminate the events that are detected in NaI and CsI crystals for G1 amplifier only. The PSD spectrum of both instruments are shown in Figures 11(a) and 12(a) (corresponding PS cut values are marked in the respective Figures). A high gain amplifier G2 is also used to register the high energy events in CsI crystal to have G2 spectrum.
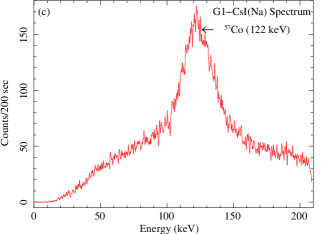
In order to calibrate the G1-CsI and G2 energy scale, we used a 122 keV 57Co line. During the laboratory tests, the G1-CsI and G2 gains were changed by varying the HV, LLD and ULD voltages in order to: i) identify the PH values of the 122 keV line in channel number and ii) study the G1-CsI and G2 gain stability.
The measured G1-CsI and G2 gain values are 0.2289 keV/Chan and 2.732 keV/Chan for RT-2/S and 0.2279 keV/Chan and 3.948 keV/Chan for RT-2/G, respectively. The G1-CsI and G2 energy converted spectra are used to measure the energy resolution of the 122 keV emission line for both instruments. The measured G1-CsI and G2 values, which are consistent with previous experiments (such as BeppoSAX, and RXTE using similar detectors), are 19.79% and 25.73% for RT-2/S and 20.69% and 18.65% for RT-2/G, respectively.
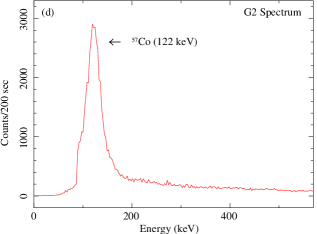
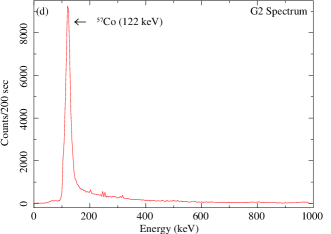
Apart from the energy scale calibration, it is also essential to have the G1-CsI and G2 background for both instruments. The in-flight background calibration is carried out using a 57Co radio-active source (122 keV) placed in one of the slats of the collimator.
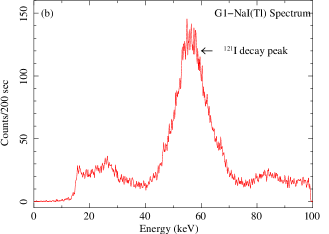
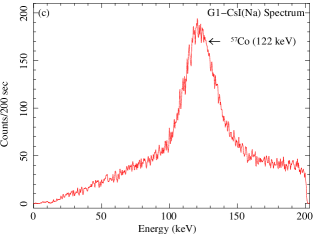
The energy calibrated background spectra of G1-NaI, G1-CsI and G2 for both instruments are shown in Figure 11(b,c,d) and in Figure 12(b,c,d). The G1-NaI spectrum shows the signature of 121I decay peak (due to 57Co, discussed in the previous section) at 57.19 keV and at 56.05 keV for RT-2/S and RT-2/G respectively. The background spectra G1-CsI and G2 are dominated by the line emission of 122 keV of 57Co over the background continuum. The large ‘continuum’ in G1-CsI spectrum is due to high energy background photons that are detected in CsI crystal in wider energy range of 30 keV to 210 keV along with the broad emission feature of 122 keV line (energy resolution 19.79% for RT-2/S and 20.69% for RT-2/G). The G2 spectra of both instruments are from extremely high energy photons (as detected in the laboratory). The 122 keV line intensity is strong enough as compared to the high energy background photons, which causes the G2 spectra a ‘tail’ like continuum.
Although the ‘phoswich’ technique (discussed in §3) is useful for background rejection for charge particles, but we could not perform any specific test in the ground (laboratory test) with charged particles in order to test the particle background rejection process.
5 Concluding remarks
In this paper, we described the complete functionality (e.g., HV calibration, Thermistor calibration, stability of PS and PH variation, validity of spectral data, health parameters etc.) during various environmental tests of RT-2 payloads (RT-2/S & RT-2/G) of RT-2 Experiment onboard the CORONAS-PHOTON mission which has been launched on January 30, 2009. Laboratory results, which include the space environmental tests (e.g., vibration, thermal, vacuum, emi, src tests etc.) and the functionality tests suggest that both instruments are qualified for space use. All these tests were carried out in a period of three months. We found that the scientific results based on functionality test are stable for the entire period of the testing phase. In fact, both instruments (RT-2/S and RT-2/G) are identical (except their FOV and in low energy working range) as far as the configuration details are concerned. However, the basic differences in their spectral characteristics (e.g., amplitude, shape, energy ranges etc.) are due to the difference in technical settings of the operational conditions (e.g., HV, LLD/ULD variation, PSD setting etc.). The energy ranges (channel boundary) of the amplifiers (G1 and G2) of both instruments are very wide and would be quite useful. During the onboard operation, different channel boundaries (energy ranges) would be set to understand the background rejection effect for both instruments (payloads).
To study the particle background rejection process, a ‘robust’ logic was implemented inside the FPGA to process any ‘event’ that is detected in the crystals. PSD technique was used to separate out the event registered in NaI or CsI crystal. The photons with higher energy ( 100 keV) are mostly detected in CsI crystal. Apart from the PSD technique, the in-built logic inside the FPGA also can separate out the high energy photons ( 40 keV) which are detected in CsI crystal of G2 amplifier (G2 spectrum).
During the commissioning phase of both instruments, we found that the initial results (Nandi et al. 2009) are in agreement with the results obtained in the ground condition. In its lifetime ( 3-5 years), RT-2 will cover the peak of the solar cycle. So far, the solar activity has not really taken off. Only a few weak flares which occurred have been successfully detected by RT-2/S and RT-2/G, and the results will be reported elsewhere.
Acknowledgments: DD thanks CSIR/NET scholarship and TBK thanks RT-2/SRF fellowship which supported their research work. The authors are thankful to scientists, engineers and technical staffs from TIFR/ICSP/VSSC/ISRO-HQ for various supports during RT-2 related experiments. The authors also thank the anonymous referee for the very detailed comments to improve the quality of the manuscript.
References
- (1) Domingo, V., Fleck, B., Poland, A. I.: The scientific payload of the space-based Solar and Heliospheric Observatory (SOHO), SSRv, 70, 7 (1994)
- (2) Gruber, D. E., et al.: The high energy X-ray timing experiment on XTE, A&A Suppl. Ser., 120, 641 (1996)
- (3) Harvey, J. E., Krywonos, A., Atanassova, M., Thompson, P. L.: The Solar X-ray Imager on GOES-13: design, analysis, and on-orbit performance, SPIE, 6689, 14 (2007)
- (4) Hudson, H.S.: SOLAR FLARES, MICROFLARES, NANOFLARES, AND CORONAL HEATING, Solar Physics, 133, 357 (1991)
- (5) Knoll, G. F.: Radiation Detection and Measurement, Wiley, New York (1999).
- (6) Kotoch, T. B., Nandi, A., Debnath, D., Malkar, J. P., Rao, A. R., Hingar, M. K., Madhav, V. P., Sreekumar, S., Chakrabarti, S. K.: Instruments of RT-2 Experiment onboard CORONAS-PHOTON and their test and evaluation II: RT-2/CZT Payload, Exp. Astron. (2010, in press).
- (7) Kotov, Yu., Cor-Phot Team.: Satellite project “CORONAS-PHOTON” for study of solar hard radiation, 35th COSPAR Scientific Assembly, in Paris, France., p.1283 (2004).
- (8) Kotov, Yu., Kochemasov, A., Kuzin, S., Kuznetsov, V., Sylwester, J., Yurov, V.,: Set of instruments for solar EUV and soft X-ray monitoring onboard satellite Coronas-Photon. In 37th COSPAR Scientific Assembly, in Montréal, Canada., p.1596 (2008)
- (9) Lin, R. P., Hurford, G. J., Madden, N. W. et al.: High-Energy Solar Spectroscopic Imager (HESSI) Small Explorer mission for the next (2000) solar maximum, SPIE, 3442, 2 (1998)
- (10) Lin, R. P., Krucker, S., Hurford, G. J., Smith, D. M., Hudson, H. S., Holman, G. D., Schwartz, R. A., Dennis, B. R., Share, G. H., Murphy, R. J., Emslie, A. G., Johns-Krull, C., Vilmer, N.: Rhessi observations of particle acceleration and energy release in an intense solar Gamma-ray line flare, ApJ, 595, L69 (2003)
- (11) Nandi, A., Rao, A. R., Chakrabarti, S. K., et. al.: Indian Payloads (RT-2 Experiment) onboard CORONAS-PHOTON Mission, In Proc. of International Conference on Space Technology, Greece, G. Lampropoulos and M. Petrou (Eds.) (2009) (arXiv:0912.4126)
- (12) Nandi, A., Palit, S., Debnath, D., Chakrabarti, S. K., Kotoch, T. B., Sarkar, R., Yadav, V. K., Girish, V., Rao, A. R., Bhattacharya, D.: Instruments of RT-2 Experiment onboard CORONAS-PHOTON and their test and evaluation III: Coded Aperture Mask and Fresnel Zone Plates in RT-2/CZT Payload Exp. Astron. (2010, in press).
- (13) Parker, E. N.: Nanoflares and solar X-ray corona, ApJ, 330, 474 (1988)
- (14) Reale, F., McTiernan, J. M. & Testa, P.: Comparison of Hinode/XRT and RHESSI Detection of Hot Plasma in the Non-Flaring Solar Corona, ApJ, 704L, 58 (2009)
- (15) Rothshild et al.: IN-FLIGHT PERFORMANCE OF THE HIGH ENERGY X-RAY TIMING EXPERIMENT ON THE ROSSI X-RAY TIMING EXPLORER, ApJ, 496, 538 (1998)
- (16) Sarkar, R., Mandal, S., Debnath, D., Kotoch, T. B., Nandi, A., Rao, A. R., Chakrabarti, S. K.: Instruments of RT-2 Experiment onboard CORONAS-PHOTON and their test and evaluation IV: Background Simulations using GEANT-4 Toolkit, Exp. Astron. (2010, in press).
- (17) Shimizu, T. & Tsuneta, S.: DEEP SURBEY OF SOLAR NANOFLARES WITH YOHKOH, ApJ, 486, 1045 (1997)
- (18) Sreekumar, S., Vinod, P., Samuel, E., Malkar, J. P., Rao, A. R., Hingar, M. K., Madhav, V. P., Debnath, D., Kotoch, T. B., Nandi, A., Begum, S. S., Chakrabarti, S. K.: Instruments of RT-2 Experiment onboard CORONAS-PHOTON and their test and evaluation V: Onboard software, Data Structure, Telemetry and Telecommand, Exp. Astron. (2010, in press).