22institutetext: Scuola Normale Superiore, Piazza dei Cavalieri 7, 56126 Pisa, Italy
33institutetext: European Southern Observatory, Karl-Schwarzschild-Strasse 2 85748 Garching bei München, Germany
33email: elena.pian@sns.it 44institutetext: INAF, IASF-Roma, Via del Fosso del Cavaliere, 100, 00133 Roma, Italy
55institutetext: Centre François Arago, APC, Université Paris Diderot, CNRS/IN2P3, 10 rue Alice Domon et Léonie Duquet, 75205 Paris Cedex 13, France
66institutetext: INAF/IASF Milano, Via E. Bassini 15, 20133 Milano, Italy
77institutetext: INAF, Brera Astronomical Observatory, Via E. Bianchi 46, 23807 Merate (LC), Italy
88institutetext: Nordic Optical Telescope, Apartado 474, 38700 Santa Cruz de la Palma, Spain
99institutetext: INTEGRAL Science Data Centre, University of Geneva, Chemin d’Ecogia 16, 1290 Versoix, Switzerland
1010institutetext: Department of Physics, University ”Roma Tre”, Via della Vasca Navale 84, 00146 Roma, Italy
1111institutetext: INAF, IASF-Bologna, Via P. Gobetti, 40129 Bologna, Italy
1212institutetext: Astronomical Institute, Academy of Sciences, Fricova 298, 25165 Ondrejov, Czech Republic
1313institutetext: Czech Technical University in Prague, Faculty of Electrical Engineering, Czech Republic
1414institutetext: INAF, Turin Astronomical Observatory, Via Osservatorio 20, 10025 Pino Torinese (TO), Italy
1515institutetext: Laboratoire AIM - CNRS - CEA/DSM - Université Paris Diderot (UMR 7158), CEA Saclay, DSM/IRFU/SAp, 91191 Gif-sur-Yvette, France 1616institutetext: Department of Physics and Mathematics, University of Insubria, Via Valleggio 11, 22100 Como, Italy
INTEGRAL observations of the GeV blazar PKS 1502+106 and of the hard X-ray bright Seyfert galaxy Mkn 841††thanks: Based on observations made with: INTEGRAL, an ESA project with instruments and Science Data Centre funded by ESA member states (especially the PI countries: Denmark, France, Germany, Italy, Switzerland, Spain), Czech Republic and Poland, and with the participation of Russia and the USA, and the Nordic Optical Telescope, operated on the island of La Palma jointly by Denmark, Finland, Iceland, Norway, and Sweden, in the Spanish Observatorio del Roque de los Muchachos of the Instituto de Astrofisica de Canarias.
Abstract
Context. Extragalactic nuclear activity is best explored with observations at high energies, where the most extreme flux and spectral variations are expected to occur, witnessing changes in the accretion flow or in the kinematics of the plasma. In active galactic nuclei of blazar type, these variations are the most dramatic.
Aims. By following blazar outbursts from their onset and by correlating the observed variations at many different wavelengths we can reconstruct the behavior of the plasma and map out the development of the flare within the jet.
Methods. The advent of the Fermi satellite has allowed the start of a systematic and intensive monitoring program of blazars. Blazar outbursts are very effectively detected by the LAT instrument in the MeV-GeV domain, and these can be promptly followed up with other facilities. Based on a Fermi LAT detection of a high MeV-GeV state, we have observed the blazar PKS 1502+106 with the INTEGRAL satellite between 9 and 11 August 2008. Simultaneous Swift observations have been also accomplished, as well as optical follow-up at the Nordic Optical Telescope.
Results. The IBIS instrument onboard INTEGRAL detected a source at a position inconsistent with the optical coordinates of PKS 1502+106, but consistent with those of the Seyfert 1 galaxy Mkn 841, located at 6.8 arcmin south-west from the blazar, which is therefore responsible for all the hard X-ray flux detected by IBIS. At the location of the blazar, IBIS sets an upper limit of erg s-1 cm-2 on the 15-60 keV flux, that turns out to be consistent with a model of inverse Compton scattering accounting for the soft X-ray and gamma-ray spectra measured by Swift XRT and Fermi LAT, respectively. The gamma-ray spectrum during the outburst indicates substantial variability of the characteristic energy of the inverse Compton component in this blazar. The hard X-ray state of the Seyfert appears to be nearly unchanged with respect to the past. On the other hand, its soft X-ray flux (0.3-10 keV) varies with a 50% amplitude on time scales from days to years. On long time scales this is well correlated with the optical flux, with no measurable delay.
Conclusions. In PKS 1502+106 the critical parameters that control variability are the accelerating power transferred to the relativistic electrons, and the magnetic field in the emitting region. The spectrum of Mkn 841 in the 0.3-100 keV range is well described by a power-law with a cutoff at 150 keV and a Compton reflected continuum.
Key Words.:
galaxies: active – quasars: individual: PKS 1502+106 – Galaxies: Seyfert – galaxies: individual: Mkn 841 – radiation mechanisms: general – gamma-rays: galaxies1 Introduction
The daily survey of the MeV-GeV sky by the Large Area Telescope (LAT) instrument (Atwood et al. 2009) onboard the Fermi gamma-ray satellite has enhanced dramatically the detection rate of flaring blazars, and will allow an accurate determination of their variability duty cycle at the highest energies. The follow-up of these high states at lower energies and the comparison with quiescent states make it possible to isolate the basic parameters that control the variations at all frequencies and ultimately to set constraints on the behavior of the central engine (Ghisellini et al. 2009; Marscher et al. 2010; Abdo et al. 2010a; Böttcher & Dermer 2010).
PKS 1502+106 ( = 1.839, see Abdo et al., 2010b, for a discussion on this preferred redshift value) is a bright, variable and optically polarized blazar (Impey & Tapia 1988; George et al. 1994; Lahteenmaki & Valtaoja 1999; Lister & Homan 2005). An et al. (2004) suggested, based on the detection of remarkable superluminal motion with high resolution radio observations, that it should be a strong gamma-ray emitter. The source is not included in the Third EGRET Catalog (Hartman et al. 1999), however it was detected in the first three months of sky-survey operation with the LAT (Abdo et al. 2009) and then again with the same instrument during a flaring state on 6 August 2008 (Abdo et al. 2010b) with a flux above photons cm-2 s-1 at energies larger than 100 MeV. In January 2009, the source has undergone another flare reaching a comparable gamma-ray flux level (Abdo et al. 2010b). It is one of the brightest, most intrinsically luminous, and violently variable AGNs of the Fermi LAT sample (Abdo et al. 2010c; Abdo et al. 2010d).
The field of PKS 1502+106 had been observed on 24-26 January 2006 by INTEGRAL IBIS for a total integration time of 83 ks. The observation, analysed by Ubertini et al. (2008) in the light of the Fermi report, resulted in the detection of a new source, IGR J15039+1022, at a flux level of 1.6 mCrab (i.e., erg cm-2 s-1 in the 18-60 keV range111Note that this flux supersedes the value of erg cm-2 s-1 reported previously (Ubertini et al. 2008; Abdo et al. 2010b).).
The IBIS source, located at RA = 15:03:53.76 and Dec = +10:22:08.4 (error radius of 5 arcmin), has been tentatively identified with the Seyfert 1 galaxy Mkn 841 (), and has been included in the Fourth INTEGRAL IBIS/ISGRI soft gamma-ray survey catalog (Bird et al. 2010) and in the second INTEGRAL AGN catalog (Beckmann et al. 2009). Ubertini et al. (2008) note that PKS 1502+106 is 11 arcmin away from IGR J15039+1022 and is not detected in the January 2006 IBIS observation. They derive a 2-sigma upper limit flux of 0.7 mCrab for the blazar in the range 18-60 keV, assuming a Crab-like spectrum.
Prompted by the Fermi detection of the gamma-ray outburst, we activated INTEGRAL observations starting on 9 August 2008 (see preliminary images in Blazek & Hudec 2009). Simultaneous observations with Swift XRT and with the Nordic Optical Telescope (NOT) were also organized. We report here the results and discuss them in the context of AGN models.
2 Observations and data analysis
2.1 INTEGRAL
The source PKS 1502+106 (whose catalogued optical J2000 coordinates are RA = 15:04:24.98, Dec = +10:29:39.2) was observed by the INTEGRAL satellite (Winkler et al. 2003) for 203 ks in Revolution 711 between 2008 August 09, 01:53 UT and 2008 August 11, 15:12 UT. The on-source time for IBIS/ISGRI (Ubertini et al. 2003; Lebrun et al. 2003) was 194.5 ks. The target is in the JEM-X (Lund et al. 2003) field of view for 46 ks in Rev. 711.
The screening, reduction, and analysis of the INTEGRAL IBIS/ISGRI and JEM-X data have been performed using the INTEGRAL Offline Scientific Analysis (OSA) v. 7.0 and v. 8.0, respectively, publicly available through the INTEGRAL Science Data Center222http://www.isdc.unige.ch/INTEGRAL/download/osa_sw (ISDC, Courvoisier et al. 2003). The IBIS/ISGRI and JEM-X data have been accumulated into final images with algorithms implemented in the software as described in Goldwurm et al. (2003) and Westergaard et al. (2003), respectively. Following similar methods, we have also re-analyzed the archival INTEGRAL IBIS and JEM-X observation obtained on 24-26 January 2006 (Ubertini et al. 2008).
The source has been also observed with the INTEGRAL OMC (Mas-Hesse et al. 2003) with a standard -band Johnson filter. The data have been extracted with default settings, using a pixels binning, which is appropriate for point-like sources.
2.2 Swift
X-ray and optical/UV observations of the blazar field have been accomplished from 7 to 22 August 2008 with Swift XRT and UVOT (Gehrels et al. 2004; Burrows et al. 2005; Roming et al. 2005), respectively. The pointing included the location of the Seyfert 1 Mkn 841. The results of the analysis of the data of PKS 1502+106 have been reported by Abdo et al. (2010b). Following similar procedures as those adopted by those authors, we have independently reduced the XRT and UVOT data of the blazar and of the Seyfert 1. Like in Abdo et al. (2010b), for the blazar, given its low count rate ( counts s-1), only photon counting data were considered and XRT grades 0–12 were selected. No pile-up correction was required. For the Seyfert, we also considered window timing mode data. The source events were extracted in circular regions centered on the sources with radii depending on the source intensity (10–20 pixels, 1 pixel ), while background events were extracted in source-free annular regions around the sources.
XRT spectra were extracted for each of the two sources from the observation of 8 August 2008, that is the one with the longest exposure time (12.5 ks). Ancillary response files were generated with xrtmkarf and account for different extraction regions, vignetting and Point-Spread Function (PSF) corrections. We used the v010 spectral redistribution matrices in the Calibration Database maintained by HEASARC. All spectra were rebinned with a minimum of 20 counts per energy bin to allow fitting within XSPEC (v11.3.2). For the spectral fitting we fixed the hydrogen column density to the Galactic value of cm-2 (Kalberla et al. 2005).
We extracted XRT light curves from the same image regions as for the spectra for source and background in the band 0.2–10 keV. For our analysis, we considered time bins ranging from 1000 to 12000 s, to ensure that each light curve point would have at least 30 source-plus-background counts. The exposure requirements were that the bins be at least 50 % exposed. In each case, the light curves were corrected for PSF losses, i.e., losses due to the extraction region geometry, and bad/hot pixels and columns falling within this region.
Likewise, the UVOT data of both sources were reduced and analyzed following procedures similar to those used by Abdo et al. (2010b). The photometry of Mkn 841 may include partial contamination from the host galaxy bulge. We used an aperture of 6′′ for the v,b,u filter images and 12′′ for the UV filters. We have also reduced and analyzed the Mkn 841 data of 3 February 2007, that have been included in the Seyfert UVOT study of Grupe et al. (2010).
2.3 Nordic Optical Telescope
We have observed the IBIS field on 13 August 2008 with the ALFOSC camera and optical BVRI filters at the NOT (Canary Islands). The data have been reduced following standard procedures within the IRAF package (overscan subtraction, bias correction, twilight flat fielding). Aperture photometry was performed with the IRAF routine APPHOT. Eight field stars were used to estimate the photometric zero point and their magnitudes were taken from the SDSS DR7 (using CDS/Aladin). The field stars SDSS gri- magnitudes were converted to bands following the transformations333http://www.sdss.org/DR5/algorithms/sdssUBVRITransform.html recommended for the SDSS Data Release 5. See Table 1 for a log of the observations.
| UTa | (s) | Filter | magnitudeb |
|---|---|---|---|
| PKS 1502+106 | |||
| 2008 Aug 13, 21:01:28.0 | 120 | ||
| 2008 Aug 13, 21:05:33.0 | 80 | ||
| 2008 Aug 13, 21:08:51.0 | 60 | ||
| 2008 Aug 13, 21:11:50.0 | 60 | ||
| Mkn 841 | |||
| 2008 Aug 13, 20:47:22.0 | 20 | ||
| 2008 Aug 13, 20:50:43.5 | 15 | ||
| 2008 Aug 13, 20:52:35.0 | 10 | ||
| 2008 Aug 13, 20:54:41.0 | 10 | ||
| a Mid time of observation | |||
| b Not corrected for Galactic dust absorption. Errors are | |||
| standard deviations of the photometric zero point. | |||
3 Results
3.1 INTEGRAL
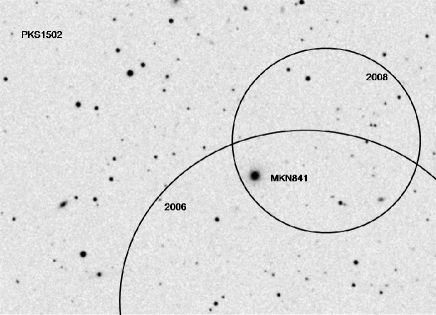
A source is detected in hard X-rays with IBIS/ISGRI at coordinates RA = 15:03:53.5, Dec = +10:26:45, with an error of 2.4 arcmin at 90% confidence level (see Figure 1). The detection has an 8.6- significance in the co-added image of the full observation. The centroid of the error circle of this source is located at 8.3 arcmin from the optical source corresponding to PKS 1502+106, and thus it is inconsistent with the blazar at a 4- significance level (i.e., the association probability is ).
However, it is located at only 1.9 arcmin from Mkn 841 (optical catalogue coordinates J2000: RA = 15:04:01.20, Dec = +10:26:16.2), and therefore consistent with it (see Fig. 1). The error circle of the IBIS detection of January 2006 is also reported in Fig. 1: as already noted, this hard X-ray source is also consistent only with the Seyfert galaxy.
From the count rates measured in our IBIS observation we derive a flux of (2.4 0.3) erg s-1 cm-2 in the range 15-60 keV for Mkn 841, assuming the spectrum measured by BeppoSAX (, Petrucci et al. 2002). The limited signal-to-noise ratio does not allow us to extract a spectrum from the present IBIS observation), and a 3- upper limit of erg s-1 cm-2 in the same energy range for the blazar. These values are similar to the ones determined by Ubertini et al. (2008) from the January 2006 IBIS observation, taking into account the slight difference in energy range.
Neither PKS 1502+106 nor Mkn 841 are detected by JEM-X in both 2006 and 2008. Assuming a Crab-like spectrum, we estimate 3- upper limits on the 3-10 keV flux of both sources of erg s-1 cm-2 and erg s-1 cm-2 for 2006 and 2008, respectively (consistent with the XRT measurements, see below).
The OMC has measured an optical magnitude of for PKS 1502+106. Since this is substantially brighter than the V-band flux measured by NOT (see Table 1) and considering the relatively large OMC pixel size (about 18 arcsec), we have checked for possible contamination from nearby sources. Four USNO stars are located within 1 arcmin of the blazar: the summed contribution of their magnitudes, when added to the flux of the blazar as measured with the NOT, is comparable to the measured magnitude so that they contaminate significantly the blazar. Therefore, we will ignore its OMC optical measurement. The OMC field of view included also Mkn 841, for which we measured an average magnitude of with no significant variability. No nearby source contaminates significantly the Seyfert optical emission.
3.2 Fermi LAT
We have re-analyzed the Fermi LAT spectrum in outburst state presented by Abdo et al. (2010b) using 2 different time intervals for signal integration: for the same period of five days between 5 and 10 August 2008 adopted by Abdo et al. (2010b) we obtain a photon index of , consistent with that measured by those authors (). For the day of the gamma-ray flare peak, 8 August 2008, we find a photon index of . These indices are reported in Figure 3 (see Discussion).
3.3 Swift
Comparison of our results with those of Abdo et al. (2010b) for PKS 1502+106 and of Grupe et al. (2010) for Mkn 841 shows a general consistency. Swift XRT and UVOT light curves for PKS 1502+106 in August 2008 have been reported by Abdo et al. (2010b), who found a decreasing trend in X-rays, the aftermath of the gamma-ray outburst, and a fully resolved flare in optical/UV, correlated with the gamma-ray event. In Figure 2a we show the light curves of Mkn 841 during the present campaign and in Figure 2b we report all XRT and UVOT V-band flux measurements of the Seyfert galaxy, to compare its long- and short-term variability in X-ray and optical. Significant X-ray variability of up to 60% was detected on a time scale of 10 days and of 50% in almost 2 years. The V-band variability is less pronounced on both time scales, only about 15-20%. The light curves in the other UVOT filters have a behavior similar to the V-band, with somewhat larger variability amplitude, although the UV filter data have a larger error than the optical ones. It is interesting to note that the long-term X-ray and optical variations are correlated (Fig. 2b).
The XRT spectrum of the blazar on 8 August 2008 is satisfactorily ( for 28 d.o.f.) fitted by a single power-law with photon index (errors on fitted X-ray spectral parameters are at 90% confidence), and the flux in 2-10 keV is erg s-1 cm-2. These results are consistent with those of Abdo et al. (2010b), who integrated the X-ray spectral signal over 4 days around the outburst. The extrapolation of the XRT flux to the IBIS energy range of 15-60 keV yields a flux of erg s-1 cm-2, which is 6 times lower than the flux measured by IBIS for the detected source. This independently suggests that, barring an improbably large spectral change between the soft and hard X-ray ranges, the IBIS source does not coincide with the blazar.
A single power-law describes well ( for 52 d.o.f.) the spectrum of Mkn 841 of 8 August 2008. The photon index is and the fitted flux in 2-10 keV is erg s-1 cm-2. The extrapolation to the IBIS energy range yields a flux of erg s-1 cm-2 (15-60 keV), which is 2.4 times lower than measured by IBIS, and therefore compatible with it, both taking into account the not exact simultaneity of the XRT spectrum and IBIS detection and assuming a spectral change between soft and hard X-ray range due to the emergence of a reflected Compton hump (see Discussion). No significant X-ray spectral variability is seen during the August 2008 campaign. Comparing our XRT spectrum of Mkn 841 with those of previous epochs reported by Grupe et al. (2010) we find some modest, marginally significant X-ray spectral variability, correlated with the flux in the sense of a harder spectrum in lower X-ray emission state. The broad-band UVOT spectra indicate a rather constant UV-optical spectral slope.
3.4 Nordic Optical Telescope
The results of the NOT observations are reported in Table 1. For the photometry of Mkn 841 we used a rather small aperture (5 pixel radius equivalent to 0.95 arcsec) in order to reduce the host galaxy contribution. However, we noted that the profile of one of the comparison star and the target are very similar in - and -band images, leading us to conclude that the host galaxy contribution is negligible. The NOT measurement in -band of Mkn 841 is consistent with the INTEGRAL OMC measurement within the errors and taking into account the difference in filter central wavelength.

4 Discussion
4.1 PKS 1502+106
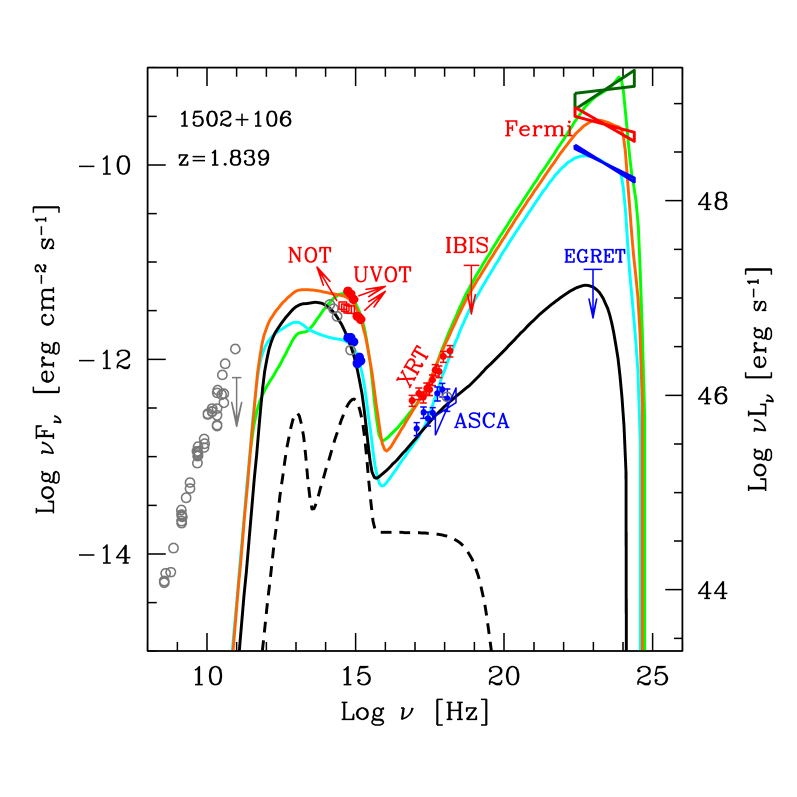
The data of our multiwavelength campaign in August 2008 are reported in Figure 3, together with archival non-simultaneous data that sample a quiescent broad-band spectral state. Also shown is the Fermi LAT spectrum detected during the first 3 months of the survey (Abdo et al. 2009). Abdo et al. (2010b) have modeled the SED of PKS 1502+106 with a synchrotron component at the radio-to-UV wavelengths and inverse Compton scattering at the higher energies. In particular, synchrotron self-Compton radiation is mostly responsible for the X-ray spectrum, while external Compton upscattering is invoked to reproduce the MeV-GeV spectrum that has a curved shape in the lower state and a power-law slope during the flare (5-10 August 2010).
In order to fit both the August 2008 low and high states and the archival SEDs we applied a simple, one–zone, homogeneous leptonic model based on synchrotron radiation at radio-to-UV frequencies, and inverse Compton upscattering of both synchrotron photons (self-Compton) and external photons of the broad emission line region (BLR), dominating at X-ray and gamma-ray frequencies, respectively, following an approach similar to that of Abdo et al. (2010b). The details of the model are described in Ghisellini, Tavecchio, & Ghirlanda (2009) and Ghisellini et al. (2010). A strong constraint of the model is the variation of the MeV-GeV spectrum in August 2008, indicating that the peak frequency of the external Compton component changes significantly from low to outburst state. Note that the INTEGRAL IBIS upper limit also sets a stringent constraint. Although the optical-UV spectrum follows a steep single power-law and does not require an additional thermal component (Fig. 3), the presence of an external Compton component at gamma-rays demands a powering source of the BLR. We identify this with an accretion disk whose luminosity is limited by the smooth shape of the optical-UV spectrum to be no larger than erg s-1, consistent with that postulated by Abdo et al. (2010b). This is 11% of the Eddington luminosity for an assumed central black hole mass of , therefore in this blazar the jet power exceeds by a large amount the accretion power (see Ghisellini et al. 2010). The radius of the BLR is assumed to be cm. The total X–ray corona luminosity is assumed to be 30% of , its spectral shape is assumed to be . The model parameters for the present SEDs are reported in Table 2 and the corresponding model curves are overplotted to the data in Figure 3 in the same colors indicated in the table. The jet viewing angle is for all states.
Our SED analysis differs from that of Abdo et al. (2010b) in the changes of the parameters that are responsible for variability among the various emission states (see Table 2). At variance with Abdo et al. (2010b) the parameters that exhibit the largest variations in our modeling are: the magnetic field , that increases by an order of magnitude between the highest and lowest gamma-ray state; the total power injected in the jet , that is a factor 10 higher in the highest than in the lowest gamma-ray state; the random Lorentz factor of the electron distribution cooling break, that is significantly larger in the highest gamma-ray state, consistent with the harder spectrum. The variation of the magnetic field is consistent with the dominance of the inverse Compton cooling in the brightest gamma-ray state of 8 August 2008: a higher intensity of the inverse Compton scattering radiation implies that the ratio between the radiation energy density and the magnetic field energy density is relatively large, while the magnetic energy density dominates this ratio in lower inverse Compton states. The increase of the injected power is related to an enhancement of the activity of the acceleration mechanism, so that the observed correlation between and is not unexpected. We also find that the shape of the particle distribution changes between the low and the hard states, with harder slopes below and steeper above. The synchrotron component, traced by the optical data, does not vary as dramatically as the inverse Compton component (MeV-GeV) in the same time scale, a behavior seen, for instance, in the blazars 3C 279 (see Wehrle et al. 1998 and Giuliani et al. 2009) and PKS 1454-354 (Ghisellini et al. 2009), but different from that of other well monitored blazar sources like 3C 454.3 (Bonning et al. 2009; Vercellone et al. 2009; Donnarumma et al. 2009; Vercellone et al. 2010; Pacciani et al. 2010) and PKS 1510-089 (Abdo et al. 2010e; D’Ammando et al. 2010), where the correlated variations in optical and gamma-rays have comparable amplitudes on time scales from days to years (see however Ghisellini et al. 2007).
A multiwavelength monitoring of few bright Fermi blazar sources on a range of time scales from days to few years would allow us to obtain sensitive insight into the undoubtedly complex jet behavior. If used systematically in these campaigns, INTEGRAL will sample, or will set constraining limits on, the flux at hard X-ray energies, that is crucial for locating precisely the peak of the high energy component. Besides this intrinsic merit, INTEGRAL IBIS – with its large field-of-view – often allows serendipitous detections of sources located within a few degrees of the primary target. Both in the present case, with the detection of the Seyfert Mkn 841, and in other previous circumstances (e.g., Pian et al. 2005), this advantage has led to an additional contribution in the study of the hard X-ray extragalactic sources.
4.2 Mkn 841
BeppoSAX observations of the Seyfert 1 Mkn 841 in 1999 and simultaneous XMM-Newton and BeppoSAX observations in 2001 showed a high energy cut-off at around 100 keV (Bianchi et al. 2001; Petrucci et al. 2002; Bianchi et al. 2004). As noted by Ubertini et al. (2008), this strongly suggests that this source, despite being 20 times brighter in X-rays than PKS 1502+106 when quiescent, is unlikely to emit in the Fermi LAT domain at the reported level (Abdo et al. 2010b). Therefore, the Fermi LAT detection can be firmly identified with emission from the blazar. On the other hand, the imaging and spectral arguments made in the previous section suggest that the hard X-rays detected by IBIS should be entirely attributed to the Seyfert.
From the January 2006 and present INTEGRAL IBIS observations there is no evidence of significant variability of the hard X-ray flux of Mkn 841. This source was first detected in hard X-rays (50-150 keV) in 1996 by CGRO OSSE (Zdziarski, Poutanen, & Johnson 2000), at a flux level of (6 2) erg s-1 cm-2, an order of magnitude higher than the extrapolation of the IBIS flux in the OSSE band using a reflected Compton spectrum (see below and Fig. 4), a difference that is not to be considered dramatic owing to the low significance of the OSSE detection (we tend to exclude contamination of the OSSE detection by PKS 1502+106, see below). On the other hand, the Swift BAT detection of Mkn 841 obtained during the first 39 months of the mission (Cusumano et al. 2010) is somewhat lower than the IBIS flux (see Figure 4). This indicates a moderate secular variability of the hard X-ray emission. The softer (0.3-10 keV) X-ray flux varies more substantially during the Swift mission lifetime, and exhibits maximum amplitude variability of about 50% on both months and days time scales (Fig. 2), in agreement with the behavior observed by other satellites, that detected even faster variations (George et al. 1993; Nandra et al. 1995; Bianchi et al. 2001; Petrucci et al. 2007).
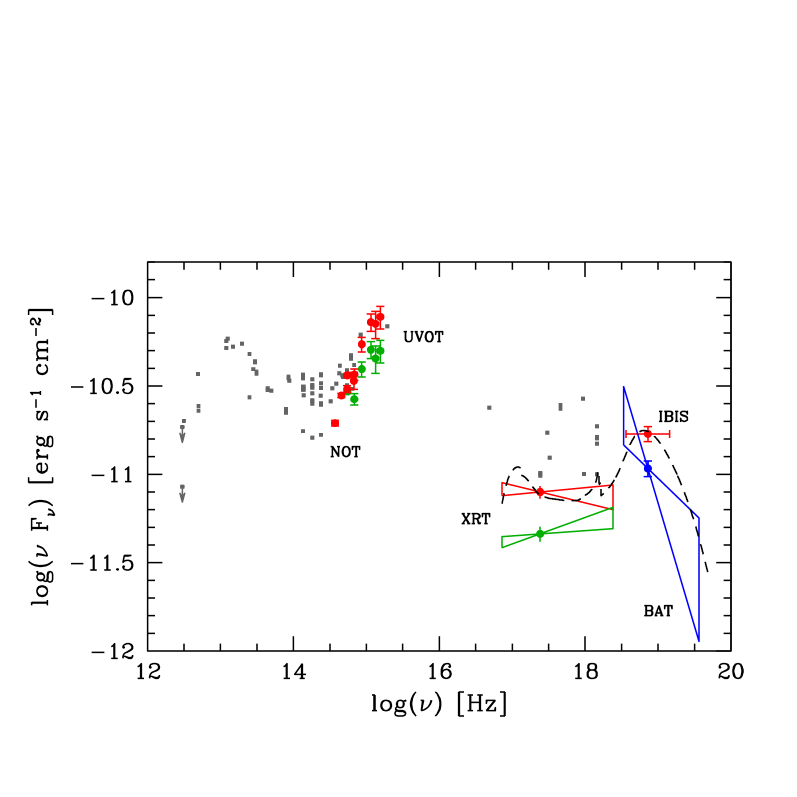
In Figure 4 we report the spectral energy distribution of Mkn 841 based on the INTEGRAL, Swift, and NOT quasi-simultaneous (within few days) observations of August 2008, and compare it with the historical data and with the Swift XRT and UVOT observations of February 2007. The Swift BAT average flux and spectrum from the 39-month survey (Cusumano et al. 2010) are also shown. The spectrum has the overall typical shape of a Seyfert 1 nucleus, with a prominent rising optical/UV component, a relatively soft spectrum in the 0.3-10 keV range and a hard X-ray component with a cutoff around 150 keV, that suggests a relatively high coronal maximum temperature. The NOT, UVOT and XRT measurements of August 2008 indicate a relatively high state. The limited accuracy of XRT does not allow us to appreciate the possible presence of the soft X-ray excess, that is often observed in Seyferts and has been first detected precisely in this object (Arnaud et al. 1985). However, as already noted, the lower state of February 2007 is also harder, suggesting a variable soft component, more prominent in the high states. The correlation between X-ray spectral index and flux (harder X-ray spectrum during lower X-ray states) is confirmed by all Swift XRT observations of this source (see Grupe et al. 2010).
We have overimposed to the data, without any scaling, the model of a black body with characteristic temperature of 100 eV to reproduce phenomenologically the soft X-ray excess, plus a power-law due to Compton upscattering of the coronal soft X-rays, with a cutoff at 100 keV, and a reflected continuum and fluorescent iron line component at the hard X-rays, proposed by Bianchi et al. (2001) as the best description of the 1999 BeppoSAX spectrum (see also Ponti et al. 2008 for a Suzaku observation of the hard X-ray spectrum). Apart from the iron line, that is out of the reach of the limited sensitivity and spectral resolution of XRT, the model reproduces satisfactorily the XRT, IBIS and BAT data (Fig. 4).
The average optical-to-X-ray colour index obtained from the present and previous (Grupe et al. 2010) XRT and UVOT observations of Mkn 841 is consistent with the relationship between and UV luminosity found in optically selected AGNs (Strateva et al. 2005; Steffen et al. 2006), although this is not the case when the values of the individual Swift observations are compared, because the X-ray variations are larger than the optical ones. Correlated X-ray and optical variability with larger amplitude in X-rays than optical has been seen in other Seyferts (e.g., Breedt et al. 2010), although the opposite is also seen in objects of this AGN class. This behavior of Mkn 841 optical-X-ray variability and the correlated X-ray flux and spectral variations (steeper spectrum for brighter states) must be both taken into account when constructing an emission scenario for this source. However, our data are not adequate to provide a detailed physical characterization of the soft X-ray excess component and its relation to the optical-UV bump. This requires a complex model (see e.g. Petrucci et al. 2007; Ponti et al. 2008; Longinotti et al. 2010) and an accurate and sensitive simultaneous monitoring in optical/UV and X-rays.
We conclude with a note on the issue of possible contamination of the hard X-ray flux of Mkn 841 in the observations that preceded the INTEGRAL one: the model we used to reproduce the broad-band spectrum of PKS 1502+106 (Fig. 3) predicts an intensity of about erg s-1 cm-2 in hard X-rays, with little variability among very different MeV-GeV emission states. This is a rather negligible fraction (20%) of the IBIS detected flux. Assuming therefore that neither the blazar nor the Seyfert vary dramatically in hard X-rays, both the BeppoSAX PDS measurement of Mkn 841 (Bianchi et al. 2001; Petrucci et al. 2002), which is consistent with IBIS, and the CGRO OSSE measurement (Johnson et al. 2000) do not contain significant contribution from the blazar, which lies in the field of view of the two instruments during Mkn 841 observations. The uncertainty circle of the Swift BAT Mkn 841 detection has a radius of 2.5 arcmin (Cusumano et al. 2010), which excludes contamination from PKS 1502+106.
| datea | ||||||||||||
| (1) | (2) | (3) | 4) | (5) | (6) | (7) | (8) | (9) | (10) | (11) | (12) | (13) |
| Fermi LAT, 8 Aug 2008 (light green) | 300 (1000) | 0.16 | 0.75 | 19 | 3000 | 6000 | –1 | 2.6 | 46.8 | 44.8 | 44.9 | 47.2 |
| Fermi LAT, 5-10 Aug 2008 (orange) | 195 (650) | 0.1 | 2.2 | 19 | 500 | 5000 | –1 | 2.4 | 47.1 | 45.4 | 45.0 | 47.2 |
| 15-22 Aug 2008 (cyan) | 210 (700) | 0.05 | 2.2 | 19 | 250 | 4300 | –1 | 2.3 | 46.3 | 45.5 | 44.8 | 47.1 |
| historical (black) | 120 (400) | 0.015 | 7.3 | 10 | 800 | 2000 | 0.25 | 2.2 | 45.1 | 45.5 | 45.5 | 45.9 |
| a epoch/state (colors refer to the model curves in Fig. 3) | ||||||||||||
| b dissipation radius in units of cm and (in parenthesis) in units of gravitational radii | ||||||||||||
| c power injected in the blob calculated in the comoving frame, in units of erg s-1 | ||||||||||||
| d magnetic field, in Gauss | ||||||||||||
| e bulk Lorentz factor at | ||||||||||||
| f break random Lorentz factors of the injected electrons | ||||||||||||
| g maximum random Lorentz factors of the injected electrons | ||||||||||||
| h slope of the injected electron distribution [] below | ||||||||||||
| i slope of the injected electron distribution [] above | ||||||||||||
| j Logarithm of the jet power in the form of radiation, in erg s-1 | ||||||||||||
| k Logarithm of Poynting flux, in erg s-1 | ||||||||||||
| l Logarithm of bulk motion power of electrons, in erg s-1 | ||||||||||||
| m Logarithm of bulk motion power of protons, in erg s-1 | ||||||||||||
Acknowledgements.
We thank C. Winkler, P. Kretschmar and C. Sanchez for assistance with the INTEGRAL observations scheduling, and P. Lubinski and the INTEGRAL Science Data Center staff for help with data reduction. We benefitted from financial support through contracts ASI-INAF I/023/05/0 and ASI-INAF I/088/06/0. RH acknowleges support from ESA PECS 98023 and by the GA CR 102/09/0997 and 205/08/1227. This research has made use of NASA’s Astrophysics Data System Bibliographic Services, of the SIMBAD Astronomical Database, and of the NASA/IPAC Extragalactic Database (NED), which is operated by the Jet Propulsion Laboratory, California Institute of Technology, under contract with the National Aeronautics and Space Administration.References
- (1) Abdo, A.A., Ackermann, M., Ajello, M., et al. 2009, ApJ, 700, 597
- (2) Abdo, A.A., Ackermann, M., Agudo, I., et al. 2010a, ApJ, 716, 30
- (3) Abdo, A.A., Ackermann, M., Ajello, M., et al. 2010b, ApJ, 710, 810
- (4) Abdo, A.A., Ackermann, M., Ajello, M., et al. 2010c, ApJ, 710, 1271
- (5) Abdo, A.A., Ackermann, M., Ajello, M., et al. 2010d, ApJ, 722, 520
- (6) Abdo, A.A., Ackermann, M., Agudo, I., et al. 2010e, ApJ, in press (arXiv:1007.1237)
- (7) An, T., Hong, X.Y., Venturi, T., Jiang, D.R., & Wang, W.H. 2004, A&A, 421, 839
- (8) Arnaud, K.A., Branduardi-Raymont, G., Culhane, J.L., et al. 1985, MNRAS, 217, 105
- (9) Atwood, W. B., Abdo, A. A., Ackermann, M., et al. 2009, ApJ, 697, 1071
- (10) Beckmann, V., Soldi, S., Ricci, C., et al. 2009, A&A, 505, 417
- (11) Bianchi, S., Matt, G., Haardt, F., Maraschi, L., Nicastro, F., Perola, G.C., Petrucci, P.O., & Piro, L. 2001, A&A, 376, 77
- (12) Bianchi, S., Matt, G., Balestra, I., Guainazzi, M., & Perola, G.C. 2004, A&A, 422, 65
- (13) Bird, A. J., Bazzano, A., Bassani, L., et al. 2010, ApJS, 186, 1
- (14) Blazek, M., & Hudec, R. 2009, Proceedings of The Extreme sky: Sampling the Universe above 10 keV. October 13-17 2009, Otranto (Lecce) Italy. Published onilne at http://pos.sissa.it/cgi-bin/reader/conf.cgi?confid=96, p.15
- (15) Bonning, E.W., Bailyn, C., Urry, C.M., et al. 2009, ApJ, 697, L81
- (16) Böttcher, M., & Dermer, C.D. 2010, ApJ, 711, 445
- (17) Breedt, E., McHardy, I.M., Arévalo, P., et al. 2010, MNRAS, 403, 605
- (18) Burrows, D.N., Hill, J.E., Nousek, J., et al. 2005, Space Sci. Rev., 120, 165
- (19) Cardelli, J. A., Clayton, G. C. & Mathis, J. S. 1989, ApJ, 345, 245
- (20) Courvoisier, T. J.-L., Walter, R., Beckmann, V., et al. 2003, A&A, 411, L53
- clps (10) Cusumano, G., La Parola, V., Segreto, A., et al. 2010, A&A, 510, A48
- (22) D’Ammando, F., Raiteri, C.M., Villata, M., et al. 2010, A&A, submitted
- (23) Donnarumma, I., Pucella, G., Vittorini, V., et al. 2009, ApJ, 707, 1115
- (24) Fukugita, M., Shimasaku, K., & Ichikawa, T. 1995, PASP, 107, 945
- (25) George, I.M., Nandra, K., Fabian, A.C., Turner, T.J., Done, C., & Day, C.S.R. 1993, MNRAS, 260, 111
- (26) George, I. M., Nandra, K., Turner, T. J., & Celotti, A. 1994, ApJ, 436, L59
- (27) Gehrels, N., Chincarini, G., Giommi, P., et al. 2004, ApJ, 611, 1005
- (28) Ghisellini, G., Foschini, L., Tavecchio, F., & Pian, E. 2007, MNRAS, 382, L82
- (29) Ghisellini, G., Tavecchio, F., & Ghirlanda, G. 2009, MNRAS, 399, 2041
- (30) Ghisellini, G., Tavecchio, F., Foschini, L., Ghirlanda, G., Maraschi, L., & Celotti, A. 2010, MNRAS, 402, 497
- (31) Giuliani, A., D’Ammando, F., Vercellone, S., et al. 2009, A&A, 494, 509
- (32) Goldwurm, A., David, P., Foschini, L., et al., 2003, A&A 411, L223
- (33) Grupe, D., Komossa, S., Leighly, K.M., & Page, K.L. 2010, ApJS, 187, 64
- (34) Hartman, R.C., Bertsch, D.L., Bloom, S.D., et al. 1999, ApJS, 123, 79
- (35) Impey, C.D., & Tapia, S. 1988, ApJ, 333, 666
- (36) Kalberla, P.M.W., Burton, W.B., Hartmann, D., Arnal, E.M., Bajaja, E., Morras, R., Pöppel, W.G.L. 2005, A&A, 440, 775
- (37) Lahteenmaki, A., & Valtaoja, E. 1999, ApJ, 521, 493
- (38) Lebrun, F., Leray, J.P., Lavocat, P., et al., 2003, A&A, 411, L141
- (39) Lister, M.L., & Homan, D.C. 2005, AJ, 130, 1389
- (40) Longinotti, A.L., Costantini, E., Petrucci, P.-O., et al. 2010, A&A, 510, A92
- (41) Lund, N., Budtz-Jørgensen, G., Westergaard, N.J., et al. 2003, A&A, 411, L231
- (42) Marscher, A.P., Jorstad, S.G., Larionov, V.M., et al. 2010, ApJ, 710, L131
- (43) Mas-Hesse, J.M., Giménez, A., Culhane, L., et al. 2003, A&A, 411, L261
- (44) Nandra, K., Turner, T.J., George, I.M., Fabian, A.C., Shrader, C., & Sun, W.-H. 1995, MNRAS, 273, 85
- (45) Pacciani, L. Vittorini, V., Tavani, M., et al. 2010, ApJ, 716, L170
- (46) Petrucci, P. O., Henri, G., Maraschi, L., et al. 2002, A&A, 388, L5
- (47) Petrucci, P. O., Ponti, G., Matt, G., et al. 2007, A&A, 470, 889
- (48) Pian, E., Foschini, L., Beckmann, V., et al. 2005, A&A, 429, 427
- (49) Ponti, G., Petrucci, P. O., Matt, G., et al. 2008, SF2A-2008: Proceedings of the Annual meeting of the French Society of Astronomy and Astrophysics Eds.: C. Charbonnel, F. Combes and R. Samadi. Available online at http://proc.sf2a.asso.fr, p.263
- (50) Poole, T.S., Breeveld, A.A., Page, M.J., et al. 2008, MNRAS, 383, 627
- (51) Roming, P. W. A., Kennedy, T. E., Mason, K. O., et al. 2005, Space Sci. Rev., 120, 95
- (52) Schlegel, D.J., Finkbeiner, D.P., & Davis, M. 1998, ApJ, 500, 525
- (53) Steffen, A.T., Strateva, I.V., Brandt, W.N., Alexander, D.M., Koekemoer, A.M., Lehmer, B.D., Schneider, D.P., & Vignali, C. 2006, AJ, 131, 2826
- (54) Strateva, I.V., Brandt, W.N., Schneider, D.P., Vanden Berk, D.G., & Vignali, C. 2005, AJ, 130, 387
- (55) Ubertini, P., Lebrun, F., Di Cocco, G., et al. 2003, A&A, 411, L131
- (56) Ubertini, P., Bazzano, A., Bird, A.J., McBride, V., Bassani, L., Malizia, A., & Cavazzuti, E. 2008, The Astronomer’s Telegram N. 1652
- (57) Vercellone, S., Chen, A.W., Vittorini, V., et al. 2009, ApJ, 690, 1018
- (58) Vercellone, S., D’Ammando, F., Vittorini, V., et al. 2010, ApJ, 712, 405
- (59) Wehrle, A.E., Pian, E., Urry, C.M., et al. 1998, ApJ, 497, 178
- (60) Westergaard, N.J, Kretschmar, P., Oxborrow, C.A., et al. 2003, A&A, 411, L257
- (61) Winkler, C., Courvoisier, T.J.-L., Di Cocco, G., et al. 2003, A&A, 411, L1
- (62) Zdziarski, A.A., Poutanen, J., & Johnson, W.N. 2000, ApJ, 542, 703