A Wide Field Survey of Satellite Galaxies around the Spiral Galaxy M106
Abstract
We present a wide field survey of satellite galaxies in M106 (NGC 4258) covering a field around M106 using Canada-France-Hawaii Telescope/MegaCam. We find 16 satellite galaxy candidates of M106. Eight of these galaxies are found to be dwarf galaxies that are much smaller and fainter than the remaining galaxies. Four of these galaxies are new findings. Surface brightness profiles of 15 out of 16 satellite galaxies can be represented well by an exponential disk profile with varying scale length. We derive the surface number density distribution of these satellite galaxies. The central number density profile (d kpc) is well fitted by a power-law with a power index of , similar to the expected power index of isothermal distribution. The luminosity function of these satellites is represented well by the Schechter function with a faint end slope of . Integrated photometric properties (total luminosity, total colour, and disk scale length) and the spatial distribution of these satellite galaxies are found to be roughly similar to those of the Milky Way and M31.
keywords:
galaxies: individual (M106) —galaxies: morphology and photometry — galaxies: dwarf galaxies| Parameter | Values | References |
|---|---|---|
| RA(2000), Dec(2000) | 12h18m57.5046s, +47∘ 18 14 | 1 |
| Ellipticity | 0.611 | 2 |
| P.A. | 150 deg | 2 |
| Standard radius, | 9.3 arcmin | 2 |
| Total magnitudes | , | 2 |
| X-ray luminosity | erg s-1 | 3 |
| Heliocentric radial velocity, | km s-1 | 1 |
| Foreground reddening | 4 | |
| Distance | d=7.2 Mpc () | 5,6 |
(1) NASA Extragalactic Database (NED); (2) RC3; (3) Panessa et al (2006) (nuclear flux - Chandra observation); (4) Schlegel et al. (1998); (5) Herrnstein et al. (1999); (6) Mager et al. (2008)
1 Introduction
Dwarf galaxies are believed to be the most abundant population in the universe. The preponderance of dwarf galaxies has been predicted by cold dark matter (CDM) simulations (eg., Klypin et al. (1999)) but the slope of the observed luminosity function of faint galaxies is too shallow to be matched with the predictions of CDM cosmology. Another important prediction of hierarchical structure formation in the CDM or CDM cosmology is that most of the dwarf galaxies are thought to be satellites of giant galaxies because galaxies are assembled by sub-structures of sub-galactic masses (Frenk et al., 1988) and many low-mass haloes can survive after major and minor mergers.
To date there are only a few giant spiral galaxies which are known to have more than dozens of satellite galaxies: the Milky Way Galaxy (MW), M31 and the M81 group. The number of satellite galaxies in MW and M31 has been doubled recently due to new discoveries (Zucker et al., 2004; Willman et al., 2005a, b; Belokurov et al., 2006, 2007a, 2007b; Grillmair, 2006; Sakamoto & Hasegawa, 2006; Zucker et al., 2006a, b, 2007; Martin et al., 2006; Majewski et al., 2007; Ibata et al., 2007; Walsh et al., 2007), mostly from the Sloan Digital Sky Survey (SDSS) (York et al., 2000). Three of them (Willman 1, Segue 1, Bootes II) are very faint () and it is uncertain whether they are genuine dwarf galaxies (Willman et al., 2005b; Belokurov et al., 2007b; Walsh et al., 2007). The number of satellite galaxies in the M81 group has been doubled too by the recent discoveries of 22 new satellite galaxies (Chiboucas et al., 2009) from a deep survey of area using MegaCam of CFHT. Among them, the satellite galaxies of the M81 group are of particular interest because they are faint enough to be compared with those of MW and M31, and provide unique information about the formation of satellite systems in a group environment that is thought to be different from that of the Local Group. Because of the very wide searching area of , corresponding to 500 kpc500 kpc at the distance of 3.6 Mpc, Chiboucas et al. (2009) fairly well covered all the satellite galaxies within the virial radius of M81. The dramatic increase of the number of satellite galaxies in these systems seems to greatly alleviate the missing satellite problem.
However, there is still a discrepancy between the number of observed dwarf satellite galaxies and those predicted by the CDM hierarchical models (Klypin et al., 1999; Moore et al., 1999), because the number of observed MW satellites corrected for the sky coverage of the SDSS is still a factor of 4 smaller than the model predictions (Simon & Geha, 2007). There have been several explanations to solve the discrepancy between the predicted and observed numbers of dwarf galaxies. Some solutions modify the primordial density fluctuations (Kamionkowski & Liddle, 2000; Zentner & Bullock, 2003) or the dark matter properties by invoking warm dark matter (Colin et al., 2000; Bode et al., 2001). However, more appealing explanations employ astrophysical solutions to suppress gas accretion on the low mass dark haloes or to prevent star formation in these haloes so that they can not be observed as dwarf galaxies. Among others photoionization squelching after re-ionization (Bullock et al., 2000; Somerville, 2002; Benson et al., 2002) seems to be the most attractive because it provides a natural low mass cutoff (Koposov et al., 2009). However, Kravtsov et al. (2004) argued that the star formation history in the low mass dwarf galaxies is not sensitive to UV background and re-ionization but sensitive to the physics of galaxy formation. They proposed tidal stripping as an alternative mechanism for the paucity of observable dwarf galaxies at the present epoch.
Owing to the recent discoveries of new satellite galaxies in MW, M31, and the M81 group and some models that can explain the observed properties of satellite galaxies belonging to these galaxy haloes, the missing satellite problem seems to be less severe than before. However, satellite galaxies in the Local Group (LG) may not be a representative population of dwarf galaxies surrounding dark haloes because LG is located in a underdense region. Since the number of bright members of the M81 group is similar to that of LG and their local background densities seem to be not much different due to the very close distance between LG and M81. Thus, we need more sample in different environment to understand this problem.
The purpose of the present study is to find dwarf satellite galaxies surrounding a giant spiral galaxy which is similar to MW and M31 to address the missing satellite problem in different group environment. We selected M106 (NGC 4258) as the best target for our deep and wide imaging survey to search for satellite galaxies because of its proximity (Mpc) and brightness () that allow us to detect faint satellite galaxies down to . M106 is the brightest member of CVn II group which is thought to be one of the most dense groups in the local universe according to the catalogue of Fouque et al. (1992). Turner & Gott (1976) assigned M106 to their Group 50 of which some galaxies are members of CVn II.
The morphology of M106 is classified as a barred spiral galaxy (SAB(s)bc). M106 is known as a LINER harboring nuclear water masers which can be used for an accurate distance estimate by geometrical means. The distance estimated from the water maser is Mpc (Herrnstein et al., 1999), which is consistent with the distances determined using the PeriodLuminosity relation of Cepheids and TRGB (Macri et al., 2006; Benedict et al., 2007; Mager et al., 2008; Bono et al., 2008). At this distance one arcsec corresponds to a linear scale of pc. The luminosity of M106 is slightly fainter than those of MW and M31. Its systemic velocity is km s-1. Its maximum rotation velocity, 208 km s-1, is slightly smaller than that of MW (Erickson et al., 1999). It is known to have one satellite galaxy, NGC 4248 ( arcmin from the centre of M106). Foreground reddening toward M106 is low: , and (Schlegel et al., 1998). Basic information on M106 is summarized in Table 1.
We surveyed an area of centered on M106, which corresponds to 215 kpc 260 kpc, using and filters. Our surveyed area is expected to cover about half of the virial radius where most of the dwarf satellite galaxies are considered to reside. The model of Moore et al. (1999) predicted that about 75% of the dwarf satellite galaxies are located within kpc from the centre of the host dark halo. Thus, we expect to detect more than 75% of the satellite galaxies from the present survey.
| Field | Filter | Exp.Times | Airmass | Seeinga | Date(UT) | Sky Brightnessb | Lunar Anglec | Lunar Phase |
|---|---|---|---|---|---|---|---|---|
| F1 | g | s | 1.15 | 2005 Feb 11 | 22.420.05 | 133 | 0.15 | |
| F1 | r | s | 1.17 | 2005 Feb 11 | 21.580.03 | 133 | 0.15 | |
| F2 | g | s | 1.19 | 2005 Feb 16 | 22.190.06 | 95 | 0.63 | |
| F2 | r | s | 1.15 | 2005 Feb 16 | 21.500.03 | 94 | 0.63 | |
| F3 | g | s | 1.18 | 2005 Mar 17 | 21.260.05 | 79 | 0.46 | |
| F3 | r | s | 1.15 | 2005 Mar 17 | 20.940.02 | 78 | 0.46 | |
| F4 | g | s | 1.15 | 2005 Apr 06 | 21.770.02 | 140 | 0.01 | |
| F4 | r | s | 1.17 | 2005 Apr 06 | 21.110.02 | 140 | 0.01 |
aTypical seeing size at the centre of focal plane. Significant image quality degradation occurs in the outer regions due to the large-format CCDs.
bIn units of mag arcsec-2.
cIn units of degree.
In this paper we report on the candidate satellite galaxies of M106 some of which are newly discovered dwarf galaxies from a deep MegaCam survey. Observations and data reduction are described in §2. We present the main results of the present study in §3. In §4 we discuss the misdentifications found in the present study and missing satellite galaxies, and compare the satellite system of M106 to those of LG and the M81 group. We summarize the main results of this study in the last section.
2 Observations and Data Reduction
2.1 Observations
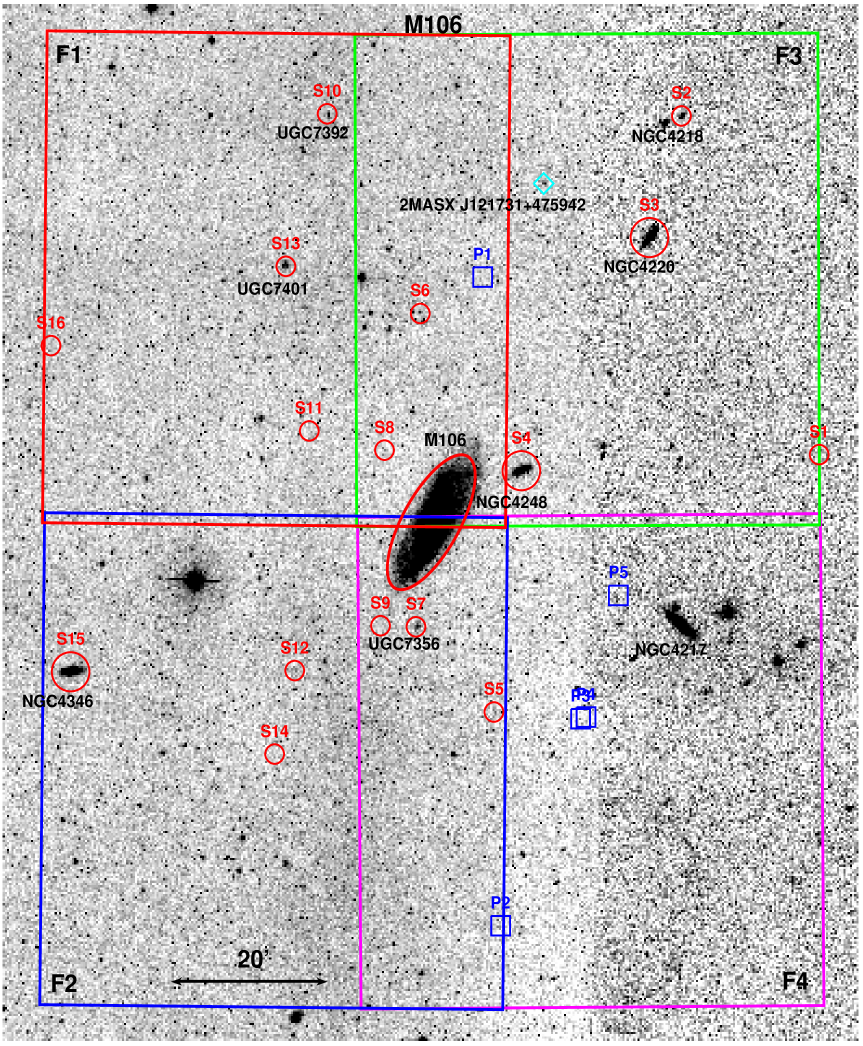
CCD images of M106 were obtained on the 4 nights from February 11 2005 to April 6 2005 (UT) using the wide-field camera, MegaPrime/MegaCam at CFHT. Most of observations were carried out under a good photometric condition except for the observations of March 17 2005 when it was cloudy. MegaCam is made of 36 pixel CCDs (4 rows 9 columns of CCDs), and it covers field of view with a resolution of 0.185 arcsec per pixel at CFHT MegaPrime focus. SDSS- and filters were used for our observation. Four fields around M106 (F1, F2, F3, and F4) were observed and the total field coverage is , as displayed in Fig. 1. All fields were observed to be partially overlapped with each other to check internal photometric accuracy. The observation log is given in Table 2. Exposure times are s for filter, and s for filter. Each image was taken with dithering of arcsec. These dithered observations turned out to be very useful to fill the gaps in the mosaic CCDs in the same row. The dithering pattern used in the present observation, however, could not cover the large gaps ( arcmin) between different rows of CCDs, a gap between the first and the second rows and a gap between the third and the fourth rows. This uncovered sky region will reduce the efficiency of finding satellite galaxies, especially small systems (smaller than ). The seeing ranged from 0.58 to 1.16 arcsec with a median value of 0.74 arcsec.
2.2 Photometry
The raw images were preprocessed using Elixir system by CFHT staff. Elixir is a collection of programs, databases, and other tools specialized in processing and evaluation of the large mosaic data. Detailed information about the Elixir system can be found in Magnier & Cuillandre (2004).
We combined the dithered exposures of each CCD to get rid of bad pixels, defective columns and spurious cosmic rays by taking a median of pixel values. We utilize the resulting images for the detection of point source objects with the digital photometry program DAOPHOT (Stetson, 1994). We adopt 3 as a detection threshold. Instrumental magnitudes of the detected objects in the images are derived using the aperture photometry with aperture radii of 0.6 to 1.2 arcsec depending on the seeing FWHM of a point source on each CCD. The value of the aperture correction was derived from the difference between these small aperture magnitude and large aperture magnitude for well isolated bright stars.
To derive the radial surface brightness profiles of the satellite galaxies we perform surface photometry. We define the rough boundary of the satellite galaxies by estimating major axis radius, ellipticity and position angle for each satellite galaxy (4th, 5th and 6th columns in Table 3) by visual inspection. Then we obtain the radial surface brightness profiles of the satellite galaxies using a custom software Ellipsephot. Ellipsephot performs a radial surface photometry using elliptical apertures by dividing an elliptical annulus into sectors to deal with unexpected spurious sources and/or bad columns. For the surface photometry of candidate satellite galaxies of M106 we divide an elliptical annulus into 8 sectors and take the median value of surface brightness of these sectors as the surface brightness of certain radius. This process is useful to remove the effect of spurious sources and/or bad columns in the surface photometry of a galaxy. Preliminary version of Ellipsephot was successfully applied in a study of the surface photometry of dwarf galaxies in the Local Group (Lee et al., 1999). Ellipsephot is useful to obtain the radial surface photometry of non-elliptical shaped and/or very low surface brightness galaxies, because it is not involved with fitting process. Therefore, Ellipsephot can be used for the surface photometry of all extended sources irrespective of their shapes. Users need to determine the centre, ellipticity, and position angle of the extended structure to run Ellipsephot. For galaxies with elliptical structures we obtain their surface photometry using IRAF/STSDAS/ellipse task. IRAF/ellipse task performs ellipse fitting to the observed isophotes (Jedrzejewski, 1987). A comparison of the surface photometry for elliptical galaxy NGC 4346 (S15, see Table 3) shows an excellent agreement between the results using Ellipsephot and that of IRAF/ellipse.
2.3 Standard Calibration
CFHT staff provided the transformation equations for a standard calibration from the photometry of the standard stars observed during the same night. We obtained the instrumental magnitudes of the standard stars using the aperture radius of 7.5 arcsec as used in Geisler (1996). The standard transformation equations are: with rms=0.019 and N=72, and with rms=0.008 and N=66, where the lower case letters represent the standard magnitudes, the primed lowercase letters the instrumental magnitudes (with a DAOPHOT system zero point of 25.0), and the air mass. Zero-points of these transformation relations are slightly different for different observed field. We transformed the instrumental magnitudes of the sources detected in fields F1 and F2 onto the standard system using these transformation equations. The instrumental magnitudes of the point sources detected in F3 and F4 were transformed onto the standard system by comparing the magnitudes of the point sources common between F1 and F3 and between F2 and F4, respectively.
SDSS Data Release 5 (DR5, Adelman-McCarthy et al. (2007)) covers the entire field of the present MegaCam observation of M106, though SDSS observation is significantly shallower than MegaCam observation. We find common point sources between SDSS DR5 catalogue and this study, and derive the magnitude difference between the transformed standard magnitudes of this study and the point-spread function fitting magnitudes of point sources in SDSS DR5. We adjust the standard magnitudes of the point sources by adding these magnitude differences in each CCD image.

2.4 Sky Brightness
Sky brightness is a critical parameter to find faint satellite galaxy. Detection efficiency of the extended sources (e.g., galaxies) strongly depends on both surface brightnesses of the sources and the background, while that of the of point sources depends mainly on the total source brightness. Therefore it is important to carry out observations on the dark night to find as many faint satellite galaxies as possible.
We measure the sky brightnesses of the individual fields, and list their values in Table 2. We select a few sky regions around the satellite galaxies to measure the sky brightness located times of the outer radii (see Table 3 for the values of the outer radii of the satellite galaxies) where no foreground and background sources are included. The mean sky brightnesses of F1 and F2 in and bands are 22.31 and 21.54 mag arcsec-2, respectively, corresponding to 22.78 and 21.86 mag arcsec-2 in and bands. We transform the SDSS and magnitudes to Johnson and magnitudes using the transformation relation in Chonis & Gaskell (2008), derived by comparing SDSS DR5 magnitude of standard stars of Landolt (1992) to their standard magnitude. The derived sky brightness is slightly fainter than the typical dark sky brightness at the CFHT site (22.00 and 21.40 mag arcsec-2 in and bands). The mean sky brightness of F3 is significantly brighter than those of F1 and F2 by 0.8 and 0.6 mag in and bands, respectively. Sky brightness of F4 is slightly fainter than that of F3, but is brighter than those of F1 and F2 by mag. The cause of the relatively brighter mean sky brightness of F3 compared to F1 and F2 might be due to the scattered moon light by the cloud and rather smaller lunar angle, and larger lunar phase. The extinction by cloud for F3 might affect the detection limiting magnitude and limiting surface brightness, therefore, the detection efficiency of satellite galaxies in F3 might be lower than those of the other fields. We list the lunar angle and the lunar phase of each observation field in Table 2.
| ID | R.A. | Dec. | Name | Type | Selectiona | ||||||
|---|---|---|---|---|---|---|---|---|---|---|---|
| S1 | 12 14 05.00 | 47 26 08.6 | 12.9 | 0.329 | 146 | 19.200.06 | 18.470.05 | – | – | dE | 2 |
| S2 | 12 15 46.41 | 48 07 51.0 | 39.8 | 0.294 | 48 | 13.490.06 | 12.880.05 | 766b | NGC4218 | Sd | 1,3 |
| S3 | 12 16 11.71 | 47 52 59.7 | 124.5 | 0.636 | 50 | 11.880.04 | 10.950.03 | 920b | NGC4220 | Sa | 3 |
| S4 | 12 17 49.90 | 47 24 33.0 | 113.0 | 0.553 | 20 | 12.860.24 | 12.120.16 | 484c | NGC4248 | Im | 1,3 |
| S5 | 12 18 11.07 | 46 55 00.7 | 41.0 | 0.725 | 110 | 16.290.06 | 16.290.09 | 431b | – | Sm | 1,3 |
| S6 | 12 19 06.21 | 47 43 49.8 | 10.3 | 0.100 | 170 | 19.300.06 | 18.740.08 | – | KK132 | dSph | 1 |
| S7 | 12 19 09.39 | 47 05 27.5 | 48.1 | 0.250 | 70 | 15.370.03 | 14.750.03 | 202b | UGC7356 | dE,N | 1,3 |
| S8 | 12 19 33.21 | 47 27 05.3 | 16.7 | 0.111 | 170 | 17.320.22 | 16.760.44 | 780d | KK134 | dE | 2 |
| S9 | 12 19 35.96 | 47 05 35.2 | 11.1 | 0.000 | 0 | 18.820.10 | 18.130.05 | – | – | dSph | 2 |
| S10 | 12 20 17.49 | 48 08 15.6 | 55.6 | 0.727 | 97 | 15.950.04 | 15.560.03 | 797c | UGC7392 | Sd | 1,3 |
| S11 | 12 20 30.07 | 47 29 24.8 | 18.5 | 0.450 | 140 | 20.100.54 | 19.420.45 | – | – | dSph/dIrr | 1 |
| S12 | 12 20 40.18 | 47 00 03.2 | 22.5 | 0.231 | 80 | 17.410.03 | 16.690.02 | – | KK136 | dE | 2 |
| S13 | 12 20 48.42 | 47 49 33.4 | 39.3 | 0.667 | 115 | 15.660.20 | 15.230.21 | 762b | UGC7401 | Im | 1,3 |
| S14 | 12 20 54.86 | 46 49 48.8 | 13.1 | 0.214 | 45 | 19.220.16 | 18.490.16 | – | – | dSph | 2 |
| S15 | 12 23 27.94 | 46 59 37.8 | 121.1 | 0.539 | 187 | 11.690.04 | 10.960.04 | 770c | NGC4346 | S0/SB0 | 1,3 |
| S16 | 12 23 46.18 | 47 39 31.9 | 22.3 | 0.417 | 140 | 18.390.09 | 17.820.09 | – | – | dE,N | 1 |
| P1 | 12 18 18.76 | 47 48 17.0 | 6.5 | 0.000 | 0 | 19.860.16 | 19.860.12 | – | – | dsph | - |
| P2 | 12 18 06.54 | 46 28 50.1 | 2.7 | 0.188 | 135 | 20.960.17 | 21.070.22 | – | – | dIrr/dSph | - |
| P3 | 12 17 06.33 | 46 54 08.2 | 2.2 | 0.146 | 130 | 19.940.07 | 20.190.07 | – | – | dIrr/dSph | - |
| P4 | 12 17 02.25 | 46 54 20.2 | 4.1 | 0.475 | 172 | 19.770.06 | 19.870.06 | – | – | dIrr/dSph | - |
| P5 | 12 16 37.40 | 47 09 12.0 | 1.8 | 0.000 | 0 | 20.330.10 | 20.690.23 | – | – | dIrr/dSph | - |
aApplied criteria for individual candidate satellite galaxies.
bAn average value of NED and SDSS.
cRadial velocity from NED.
dRadial velocity from SDSS.
3 Results
3.1 Selection of Satellite Galaxies
Distinguishing the satellite galaxies from the background galaxies and foreground objects is one of essentials in the present study. Based on the simple hypothesis of similarity in physical properties of the satellite galaxies of M106 and the Local Group, the satellite galaxies of M106 are expected to have a variety of size, total magnitudes, colours and surface brightnesses. We therefore, need to explore a large set of searching parameters to complete the finding of satellite galaxies of M106. Most efficient and complete method suitable for finding satellite galaxies in the wide field survey is human visual inspection. Three of the authors search both the combined fits images and true color images independently and repeat the searching process until three authors agree one another. The galaxies identified as satellite galaxies by either one or two authors are classified as probable satellite galaxies.
All the extended sources detected in the images might be potential satellite galaxy candidates of M106. However, considering the total mass (similar to or smaller than the mass of Milky Way), M106 is expected to host a few tens of satellite galaxies. Therefore many of the extended sources in the images are not the satellite galaxies of M106. To select genuine satellite galaxies while keeping as many candidate galaxies as possible, we construct the following steps to find the satellite galaxies.
(1) If a galaxy that shows some resolved stars, it is considered to be a satellite galaxy. Since we can resolve a significant portion of M106 into individual sources, the partially resolved galaxies near M106 could be the most plausible candidates of satellite galaxy of M106.
(2) We consider galaxies with no resolved structure but showing rather extended () and faint surface brightness structure (extremely faint surface brightness) as candidate satellite galaxies.
(3) Galaxies with similar radial velocity to that of M106 are considered to be satellites.
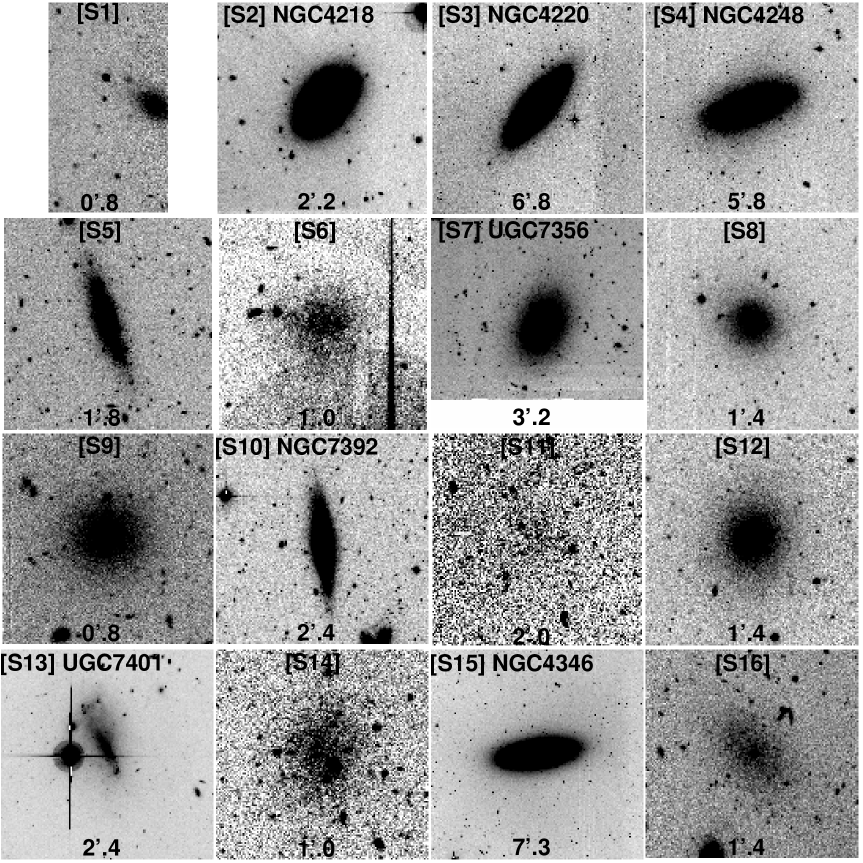
Finally we find 16 satellite candidates and five probable satellite candidates of M106. Hereafter, we call the candidate satellite galaxies as satellite galaxies. Twelve of the satellite galaxies are previously known, and four of them are new findings. We list the properties of these satellite galaxies in Table 3. The galaxy type is estimated based on the morphology of a galaxy on CCD images and the surface brightness profiles. We display an atlas of 16 satellite galaxies in Fig. 2. Relatively large satellite galaxies (S2, S3, S4, S7, and S15) show elliptical shapes. Two intermediate-size galaxies, S5 and S10 are typical edge-on disk galaxies. S13 has a structure of typical irregular galaxy, being close to a very bright foreground star. We masked out the sky regions of this bright star before deriving the surface photometry. Two satellite galaxies S6 and S9 showing spherical shapes with relatively low central surface brightness seem to be dwarf spheroidal galaxies. Surface brightness profiles of satellite galaxies S8 and S9 with spherical appearance are well represented by exponential profiles for the entire radial ranges. Two satellite galaxies showing spherical shapes with extremely low surface brightness, S11 and S14, are morphologically similar to dwarf spheroidal galaxies. S16 shows an elongated shape and its surface brightness profiles for the outer region are well represented by an exponential law. S16 is a dwarf elliptical galaxy with a central nucleus. S1 was located at the boundary of CCD chip, so that we could not estimate its morphological type. The surface photometry of S1 indicates that the morphological type of S1 is close to a dwarf elliptical galaxy. We classify P1 as probable satellite galaxy of M106 because its central surface brightness is much fainter than all the satellite galaxies. Remaining galaxies, P2, P3, P4, and P5, which have extremely small effective radii ( arcsec), are also classified as probable satellite galaxies of M106.
| ID | Fit rangesd | slopee | ||||||
|---|---|---|---|---|---|---|---|---|
| S1 | 23.694 | 6.3 | 3.5 | 8.9 | 4.090.17 | 3.990.16 | 0.210 | 0.0180.119 |
| S2 | 19.634 | 11.9 | 30.8 | 40.6 | 6.820.10 | 7.110.11 | 0.220 | –0.0350.078 |
| S3 | 17.463 | 32.0 | 99.3 | 134.6 | 22.880.40 | 22.890.40 | 2.0100 | –0.1470.066 |
| S4 | 20.244 | 43.9 | 86.0 | 128.7 | 27.020.30 | 28.550.33 | 0.390 | 0.0570.040 |
| S5 | 21.433 | 15.3 | 21.8 | 34.5 | 9.540.21 | 10.050.24 | 1.550 | 0.1760.090 |
| S6 | 25.004 | 8.1 | – | 7.4 | 6.850.30 | 6.420.27 | 1.012 | –0.1150.172 |
| S7 | 20.712 | 23.9 | 24.8 | 44.9 | 16.760.46 | 16.300.44 | 0.250 | –0.0410.046 |
| S8 | 23.181 | 11.6 | 7.6 | 17.3 | 7.250.10 | 7.270.10 | 0.240 | 0.0450.053 |
| S9 | 23.792 | 7.7 | 0.7 | 7.6 | 5.940.14 | 5.900.14 | 0.225 | –0.0280.071 |
| S10 | 21.744 | 15.5 | 27.3 | 40.4 | 9.280.19 | 9.880.22 | 0.330 | 0.0690.075 |
| S11 | 25.593 | 18.5 | – | 0.7 | 16.430.63 | 18.400.80 | 0.230 | 0.0540.061 |
| S12 | 23.501 | 14.4 | 6.8 | 18.7 | 9.190.14 | 9.110.14 | 0.230 | 0.0030.061 |
| S13 | 21.253 | 30.9 | 33.5 | 70.2 | 22.460.87 | 20.340.69 | 2.540 | 0.1930.140 |
| S14 | 25.444 | 11.4 | – | 7.6 | 7.490.26 | 8.910.36 | 0.325 | –0.0160.067 |
| S15 | 16.70 | 21.5 | 91.6 | 135.3 | – | – | 10.0150 | –0.0600.151 |
| S16 | 22.122 | 13.5 | 1.8 | 14.0 | 11.910.61 | 12.350.65 | 2.030 | 0.0410.139 |
| P1 | 25.77 | 9.2 | – | 1.3 | 5.390.34 | 3.870.17 | 0.520 | -0.3280.074 |
| P2 | 23.80 | 1.8 | – | 4.9 | 1.030.04 | 0.730.02 | 0.54 | -0.4890.239 |
| P3 | 22.99 | 2.3 | 3.2 | 5.1 | 1.710.04 | 1.600.03 | 0.510 | -0.2130.111 |
| P4 | 22.80 | 2.5 | 4.2 | 5.8 | 1.600.03 | 1.600.03 | 0.510 | -0.1560.111 |
| P5 | 24.59 | 3.4 | 1.3 | 5.3 | 2.900.24 | 2.430.17 | 0.56 | -0.3010.170 |
denotes the central surface brightness in units of mag arcsec-2.
bEffective radius(), standard radius(), and Holmberg radius() measured in -band images are given in units of arcsec.
cDisk scale length() in and bands in units of arcsec.
dRadial ranges for linear fit of () colour profiles in units of arcsec.
e() colour gradient in units of mag/logr where r in units of arcsec.
1,2,3,4 Categories for surface brightness profiles and central surface brightness as described in §3.2.
3.2 Surface Brightness and Color Profiles
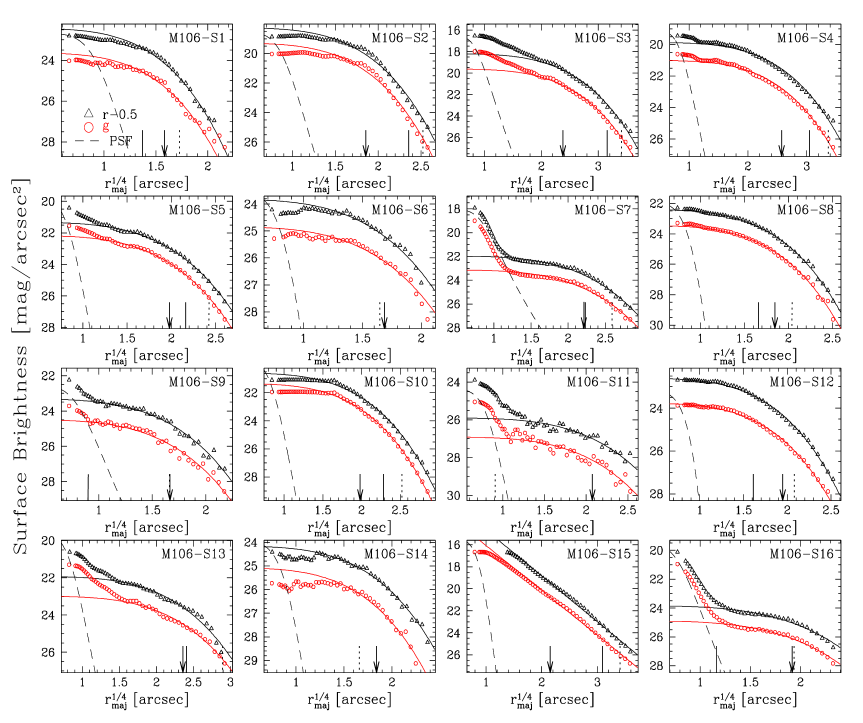
We display the radial surface brightness profiles of all the satellite galaxies of M106 in Fig. 3, and list the results of surface photometry including colour gradient in Table 4. The radial profiles of surface magnitude in and bands are displayed in open circles and open squares, respectively. We marked the position of the effective radius () within which half of the total galaxy luminosity is emitted by thin arrows, together with the positions of two characteristic radii, and , by the vertical solid lines and the vertical dotted lines. and are defined as the radii where the -band surface brightness becomes mag arcsec-2 and mag arcsec-2, respectively.
Most of the satellite galaxies of M106 show surface brightness profiles typical of a disk galaxy, while the surface brightness profiles of S15 resemble those of an elliptical galaxy. Surface brightnesses of three satellite galaxies S6, S11, and S14 are extremely low so that we could not determine the two characteristic radii, , and for these galaxies. These low surface brightness galaxies are expected to be an analogy of Sextans and Sagittarius dwarf spheroidal galaxies in the Local Group. Radial surface brightness profiles of the satellite galaxies, S7, S9, and S16 show a strong signature of the presence of the central nucleus. The radial surface brightness profile of S7 near the galaxy centre is found to be very close to that of the point source profile, implying the presence of the central nucleus. On the other hand, the central structures of S9 and S16 are slightly extended compared with the typical point source profile.
We fit the derived radial surface brightness profiles with a single exponential law (thin solid lines over data points) except for S15, for which we use the de Vaucouleures law. The physical properties of the satellite galaxies of M106 derived by fitting the radial surface brightness profiles are listed in Table 4. The radial surface brightness profiles of the outer regions of the satellite galaxies of M106 are fitted well by an exponential profile. However, near the galaxy centre there are seen a variety of structures. We divide the satellite galaxies of M106 with exponential disk into 4 categories based on their central surface brightness profiles: (1) galaxies with surface brightness profiles represented well by a single exponential law (S8 and S12), (2) galaxies expected to host a clear/marginal central nucleus (S7, S9, and S16), (3) satellite galaxies showing brighter central surface brightness than the exponential law but more extended than the PSF (S3, S4, S5, S11, and S13), and (4) galaxies with fainter central brightness than the exponential disk profiles (S1, S2, S6, S10 and S14).
The central structures of the satellite galaxies in category 3 might be explained by the presence of the central bulge in these galaxies. The appearances of these galaxies are, however, quite different from one another. Moreover, two galaxies, S5 and S10, showing typical shapes of disk edge have quite different central structure.
We present the derived radial colour profiles of the satellite galaxies of M106 in Fig. 4. For clear appearance we apply the box car smoothing kernel to the data (solid lines). surface colour of the satellite galaxies ranges from 0.1 to 1.0 mag arcsec-2, corresponding to 0.2 and 1.2 mag arcsec-2 in . We note that the expected foreground reddening toward M106 is negligible (, Schlegel et al. (1998)). We plot the radial colour profiles of 16 satellite galaxies using the same scale in y-axis for clear comparison. We derive the colour gradient of colour profiles of these galaxies and summarized the results in Table 4. For the linear fit of the surface colour profile we only include the data in the intermediate radial range as summarized in Table 4. The surface colour profiles of S3 and S15 get bluer with increasing radius, while those of S5 and S13 get redder as radius increases. The radial surface colour profiles of remaining 12 galaxies do not show any clear signature of colour gradient. Despite the similar trend in the radial surface brightness profiles, the colour profiles of S3 and S5 differ clearly: slow increase in colour with increasing radius near the central region followed by a slower decrease (getting bluer) for S3, but the trend is quite opposite for S5. The marginally visible resolved stars in S5 might indicate the presence of young MS stars and/or AGB stars, which are brighter than the tip of the red giant branch stars. This indicates the recent star formation in S5. For three galaxies (S6, S11, and S14) with extremely low surface brightness, we found no trend in the colour profiles due to the large photometric errors.
3.3 Spatial Distribution
The two dimensional distribution of the 16 satellite galaxies of M106 (see Fig. 1) shows (1) the central concentration of the satellite galaxies toward M106 and (2) the higher probability to find satellite galaxies along the major axis of M106. We investigate these features in more detail using quantitative analysis as shown in Fig. 5.
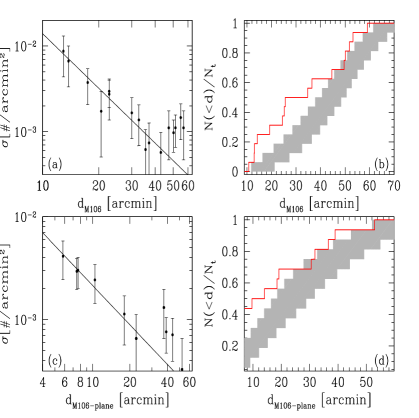
We show one dimensional spatial distributions of the 16 satellite galaxies in Fig. 5. Fig. 5 (a) and (c) present the surface number density profiles as a function of the projected distance from the centre of M106 and from the major axis of M106. Both profiles show clear signatures of concentration toward the centre of M106 and toward the major axis of M106, respectively. We fit the radial number density profile of the satellite galaxies using a power-law for the radial range of arcmin, finding a power index of . A power index of a power-law profile for Fig. 5(c) is much flatter compared to the power index for galacto-centric radial distribution (Fig. 5(a)). The derived power-law index for the galacto-centric surface number density profile is very similar to the expected value for isothermal distribution. This implies that 12 of 16 candidate satellite galaxies with arcmin ( kpc) found in this study are probably genuine satellite galaxies of M106.
Because we are dealing with small number statistics (), the derived power index of power-law for the number density profiles might be affected significantly by the binning method. To examine the effect of binning for the number density profiles we derive the number density profiles using four different binning methods; (1) an equal number of data points in each bin, (2) binning the data points in an equal linear interval, (3) binning the data points in an equal logarithmic interval, and (4) binning the data points in an equal interval. We applied four different binning methods to obtain the radial number density profiles of 16 satellite galaxies of M106. We then, fit the data with arcmin to the power-law for the each density profile, obtaining power indices of , , , and , respectively. All of the power indices agree well within the errors, and the derived power-index () is close to the weighted mean of the values.
The satellite galaxies in the outer region ( kpc) show more or less like a flat distribution rather than the power-law. We fit the radial number density profile of the satellites including the galaxies in the outer region of M106 ( kpc), obtaining a power index of . This is somewhat shallower than the power index for the radial number density profile of 12 satellite galaxies. However due to the large uncertainty it is quite uncertain whether the satellite distribution of the outer region of M106 is flat or not. One of the causes for the flat distribution of M106 satellite located at the outer region may be the inclusion of the background galaxies in the list of the M106 satellite galaxies.
Fig. 5 (b) and (d) show the cumulative number distribution of satellite galaxies against the projected distance from the centre of M106, and that of the projected distance from the major axis of M106, respectively (solid lines). For comparison we display the expected cumulative number distribution of 16 artificial sources assuming spatially uniform distribution with shaded regions. The width of the shaded regions represents boundary. The concentrated distribution of the satellite galaxies toward the centre of M106 is also shown clearly with a high statistical confidence (). For the outer region ( arcmin) the observed distribution of the satellite galaxies is very similar to that of the uniform distribution (This is also observed in Fig. 5 (a)). In addition to the central concentration toward the centre of M106, they are located preferentially along the major axis of M106. This implies that a large portion of the satellite galaxies of M106 were formed around M106 and are captured by M106 moving along the merging filaments, which are spatially aligned with the major axis of M106.

4 Discussion
4.1 Misidentification and Missing Satellite Galaxies
The sample of 16 satellite galaxies of M106 found in this study might contain non members. Most of the misidentifications are expected to be connected with faint background galaxies. The probability to include background galaxies as the satellite galaxies of M106 can be higher in applying the criterion (3) in §3.1 because the background galaxies (but still within a few Mpc from M106) with large peculiar motion could possibly be identified as the satellite galaxies of M106. In Table 3, there are 9 galaxies with known radial velocities. Considering the radial velocity of M106 (kms-1), S3 that shows the largest radial velocity difference (km-1) still seems to be within the expected dynamical boundary of M106 ( kms-1). Thus we conclude that the probability including misidentification in 9 satellite galaxies with radial velocity information is negligible.
For the remaining 7 galaxies without radial velocity information, we are not able to discriminate the genuine satellites from the misidentified ones. We need to measusre their radial velocities by spectroscopic observations or to derive their distances by high resolution photometry. Observations with higher spatial resolution using space telescope and/or ground-based observations equipped with adapted optics at near-infrared wavelengths are crucial to confirm these galaxies as the satellite galaxies of M106, by detecting a significant number of red giant branch stars in the satellite galaxies.
One of the possible contaminations in the current list of satellite galaxies of M106 is the inclusion of background galaxies especially for the outer region of M106. The number of satellite galaxies at arcmin is four. Two (S2 and S10) of these 4 galaxies have the radial velocity of km/sec, somewhat larger than the radial velocity of M106 but still smaller than or similar to the radial velocity of S3 and S8. For the remaining two galaxies (S1 and S16) without radial velocity information we are not able to decide if they are dynamically bound to M106.
To examine the misidentification of background galaxies as the satellite galaxies of M106, we show the central surface brightness versus total magnitude of both candidate satellite galaxies (open circles) and probable satellite galaxies (star symbols) in Fig. 6. Two candidate satellite galaxies (S4 and S16) are located somewhat outside of the boundary, but still within boundary. For the probable satellite galaxies, we find that only P1 is located well inside the boundary. The fitting error for the best-fit linear relation using all the data (16+5 galaxies) is % larger than that for the best-fit linear relation using 16 candidate satellite galaxies. S16 shows some resolved stars with an extended halo, which satisfies the most strong selection criterion. S4 (NGC4248) also shows some resolved stars, and the radial velocity ( km s-1) is very similar to that of M106. Therefore, we conclude that both S4 and S16 are candidate satellite galaxies of M106.
In addition to the misidentification of the satellite galaxies of M106, there might be a number of galaxies not included in the current list of satellite galaxies of M106 because of incomplete photometry. We estimate the expected number of missing satellite galaxies due to the gaps in the present CFHT mosaic observations (see §2 for the description of gaps). The width of the each gap is arcmin, resulting in arcmin2 in the entire observed field. This corresponds to of the whole observational field of view. Since the gap is rather narrow the probability of missing a large (size arcmin) satellite galaxy is considerably small. We estimate the expected number of missing small satellite galaxies ( arcmin) located in these gaps as follows: First we assume a uniform distribution of the satellite galaxies. We then assume that if a half of a galaxy is located in this gap we fail to find this galaxy as the satellite galaxy of M106. The expected number of missing satellite galaxies due to the gaps of mosaic observation is . Because the distribution of the satellite galaxies of M106 is concentrated toward the centre of M106 and the distribution of the gaps is roughly uniform, the number might be smaller than 0.7. We compared the catalogue of dwarf galaxies around M106 of Karachentsev et al. (2007) with our list of satellite galaxies. We found that all dwarf satellite galaxies of Karachentsev et al. (2007) near M106 are common in our list except for the dwarf galaxy, d1217+4703 that is found to be located in one of the gaps. This is consistent with the expected number of missing satellite galaxies due to the gaps between CCDs in the present study. We do not include this satellite galaxy, d1217+4703 for the subsequent analysis because we do not have its morphology and photometric properties.


It is more difficult to estimate the number of missing satellite galaxies not located in these gaps. One of the causes that make it difficult to identify the faint satellite galaxies of M106 is the observational limits; poor spatial resolution and shallow photometric depth. Identification of satellite galaxies of M106 based on the present observations is mainly dependent on surface brightness rather than the total magnitude. Two satellite galaxies (S11 and S14) have low central surface brightness ( mag arcsec-2). Therefore we conclude that satellite galaxies with extremely faint surface brightness may be missing in the present list of satellite galaxies of M106. This is more severe for the galaxies located in F3 because the measured sky brightness of F3 is much brighter than F1 and F2.
We discuss qualitatively the limit of our detection method by comparing our results th those of Chiboucas et al. (2009) because their observations were also performed using CFHT MegaCam. Chiboucas et al. (2009) found 22 new dwarf galaxies in the M81 group using a larger field ( square degree) MegaCam survey of the M81 group, resulting in a total of 44 galaxies in the M81 group including M81. To find the satellite galaxies they chose two different methods; visual inspection by two of three authors, and a 2-point correlation auto-detection routine. They detected 17 out of 22 new candidates of the M81 group by visual inspection of the MegaCam images. To find the satellite galaxies missed in the visual inspection they applied a 2-point correlation auto-detection routine for the photometric catalogue of point sources. The auto-detection method calculates the 2-point correlation function for the point sources with on scales of kpc, then a spatial region with a higher correlation values might be a candidate satellite galaxy. Chiboucas et al. (2009) applied this method for their photometric catalogue of the M81 group because they were able to detect a large number of TRGB stars in the dwarf galaxies of the M81 group. Assuming and typical colours of TRGB of , and (Lee, 1993), is detected at , corresponding to at the distance of M81. They argued that since their observational limit () is slightly fainter than the TRGB brightness they detected a significant amount of TRGB stars in the satellite galaxies of the M81 group. Auto detection method adds 5 more satellite galaxies to the catalogue of satellite galaxies of the M81 group, mostly galaxies with faint surface brightness.
To investigate the limit of our detection method we compare the observational parameters of both MegaCam observations. Our MegaCam observations of M106 is rather deeper (exposure times in -band is times longer than -band observations of the M81 group). The atmospheric seeings of the both observations are similar to arcsec, and both observations were carried out at dark nights. Therefore, the photometric limiting magnitude of the present observation is expected to be mag fainter than the MegaCam observations of the M81 group. However, because the distance to M106 is times farther than the distance to M81 (Mpc), TRGB is expected to be detected at for our MegaCam survey, similar to or fainter than the magnitude limit of the present MegaCam observation of M106. Therefore, we expect to detect no or an extremely small number of TRGB stars in satellite galaxies of M106. Since 2-point correlation auto-detection method needs a catalogue of points sources in the satellite galaxies we are not able to apply this method for our MegaCam observations. Our catalogue of satellite galaxies of M106 does not include the galaxies with extremely faint central surface brightness, which were detected in the M81 group (4 out of 22 galaxies with ). We might miss those extremely faint galaxies in the present catalogue of satellite galaxies of M106.
4.2 Comparison with LG and the M81 group
MW and M31 in LG have a large number of satellites whose properties are well known. The M81 group is known to have 43 satellite galaxies of which about half are new findings (Chiboucas et al., 2009). We compare the properties of the satellite galaxies of M106 with those of MW, M31, and the the M81 group. Because the brightness of 16 satellite galaxies of M106 is much brighter than those of the extremely faint galaxies of MW, we only consider the brighter () satellite galaxies of MW (samples in Mateo 1998; van den Bergh 2000; Metz et al. 2007).
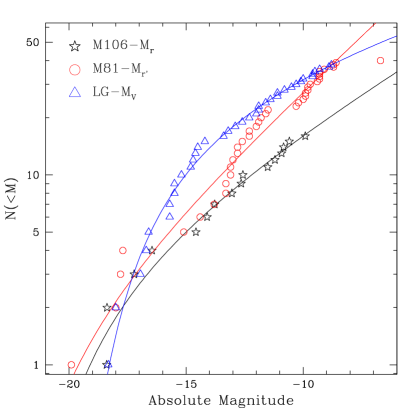
We show the cumulative luminosity function (LF) of satellite galaxies of M106 compared to those of the satellite galaxies in LG and the M81 group in Fig. 7. For M106 and the M81 group we show the -band and -band cumulative LFs while we display -band cumulative LF for LG galaxies. We exclude the error bars of data points in Fig. 7 for the clear comparison. Then we fit the observed cumulative LFs to cumulative Schechter LFs (solid lines). To compare the LFs of satellite galaxies we do not include the host galaxies of each system (MW, M31, M81, and M106). For the M81 group, we also exclude the faintest sample from the fit to the Schechter LF, which is significantly fainter than the majority of satellite galaxies of the M81 group. The faint end slopes of Schechter LFs for M106, LG, and the M81 group are , , and , respectively. The faint end slope of the M81 group is basically identical to that of Chiboucas et al. (2009). The faint end slope of Schechter LF of M106 is slightly steeper than that of LG but flatter by compared to the M81 group. The cumulative LF of the M81 group rises suddenly at due to the inclusion of a large number of satellite galaxies found in MegaCam survey (Chiboucas et al., 2009). A significantly larger number of satellite galaxies of the M81 group compared to M106 might be due to inclusion of some artifacts and/or background galaxies as pointed out by Chiboucas et al. (2009) (See the comments of their Table 1). They performed spectroscopic confirmation of only 3 BCD candidates among 22 new satellite candidates, which turned out to be the members of the M81 group. The cumulative LFs of LG and M106 satellite galaxies are represented well by the cumulative Schechter function, while the cumulative Schechter LF does not represent well the observed cumulative LF of the M81 group as shown in Fig. 7. The faint end slope of cumulative LF of M106 is much flatter than the expected faint end slope by CDM model of (Trentham & Tully, 2002).
In Fig. 8, we display colour-magnitude diagram of 16 satellite galaxies in M106 (open circles with error bars). We transform SDSS and magnitudes to Johnson and magnitudes using the transformation relation by Chonis & Gaskell (2008). Since Chiboucas et al. (2009) have observed the M81 group using only -band, we show only the colour-magnitude distribution of M106 and LG satellites. The distribution in the colour-magnitude diagram (CMD) for LG dwarf galaxies associated with neither MW nor M31 are shown as a comparison. The solid line is a boundary based on observations to divide the dwarf galaxies into early type galaxies of dSph or ellipticals (redder of the solid line) and late type galaxies of spirals or irregulars (Mateo 1998). The locations of dwarf satellite galaxies of M106 in the CMD coincide roughly with early type galaxies of M31 and MW. However the CMD distribution of LG dwarf galaxies not related with large spiral galaxies is quite different from that of M106 satellites.
The mean colour of dwarf satellite galaxies of M106 is estimated to be , consistent with that of the dwarf satellite galaxies of MW and M31. Interestingly two brightest satellite galaxies of M106 (S3 and S15) have much redder colour than the dwarf galaxies of MW with similar luminosity. This difference is related with the morphological difference between them. The brightest satellite galaxy of M106 is an early type spiral galaxy, while that of MW is a late type spiral. James et al. (2008) reported that it is quite rare to find star forming late type spiral galaxies as a satellite galaxy of a giant spiral galaxy like MW. However, there is a high probability of morphology conformity between host and satellite galaxies (Ann et al., 2008) and similar conformity is present between a target galaxy and its companion, especially when the companion is close enough to be located inside the virial radius of the target galaxy (Park et al., 2008).
The spatial distribution of the satellite galaxies in M106 shows two distinct features; (1) galacto-centric concentration toward M106 and (2) preferred concentration toward the major axis of M106. We compare the spatial distribution of the satellites of M106 to those of the dwarf satellite galaxies in LG and the M81 group and display the results in Fig 9. The galacto-centric Cartesian coordinates of the satellite galaxies of Milky Way and M31 are from Metz et al. (2007) and Koch & Grebel (2006), respectively. To mimic the sky-projected two dimensional distribution of M106, we transform their Cartesian coordinates by rotating along the semi-minor axis of the disk. We determine the inclination angle of M106 using the known major and minor-axis radii assuming zero-thickness of the disk of M106 following Ma et al. (1997), obtaining . Due to the limited survey area of the present study, the distribution of the satellite galaxies of M106 is truncated at kpc, corresponding to .
The surface number density profiles against the sky-projected galacto-centric distance (Fig. 9(a)) are very similar to one another among four satellite systems with an indication of slightly higher number density of the satellite galaxies of the M81 group compared to MW, M31, and M106. The surface number density of the M81 group is higher by a factor of than that of LG satellite galaxies for for the radial ranges of kpc. We fit the radial surface number density profiles of the satellites of MW, M31, and the M81 group with the power-law, obtaining the power indices of , , and , respectively. For the brighter sample of the M81 group with , we obtain the power index of . The radial surface number density profiles of the satellites of MW, M31, and the M81 group decrease gradually roughly following the power-law with varying power indices. On the contrary, the radial distribution of satellites of M106 shows some hint of flat distribution for the outer region (kpc). M106 is expected to be located in rather denser environment than MW, M31, and M81, this might affect the distribution of satellite galaxies of M106 compared to those of MW, M31. and the M81 group. However, since the number density profile of M106 satellites is only available for the radial ranges of kpc, we are not able to conclude that if the outer distribution of M106 satellites follows the uniform distribution. To reconcile this issue, it is need to extend the survey area to cover the whole dynamical boundary of M106. We show the surface number density of the satellite galaxies of M106, MW, M31, and the M81 group with increasing projected distance from the semi-major axis of each galaxy in Fig. 9(b). The distributions of the satellite galaxies of these galaxies are similar within the uncertainties. We also compute the number of satellite galaxies of M106 by assuming that the flat distribution in Fig. 5(a) ( arcmin) is mainly due to background galaxies. We find that the number of satellite galaxies located between arcmin from M106 is by assuming flat background distribution. This number might be the lower limit of the actual satellite galaxies of M106, corresponding to some half of candidate satellite galaxies found in this study.
To estimate the number of satellite galaxies of M106 located outside of the surveyed region (kpc) of M106, we count the number of satellite galaxies outward of this distance of MW, M31, and the M81 group by assuming that the virial mass of each system is similar to each other. We find the numbers 4(), 8(), and 18() for MW, M31, and the M81 group, respectively, with an average of 40% of total satellite galaxies in these galaxies. This simply implies that there might be satellite galaxies with in the outer region of M106. This estimation might be an upper limit because the virial mass of M106 might be somewhat smaller than MW, M31, and the M81 group and the catalogue of the satellite galaxies of the M81 group includes some very faint galaxies down to . We compute the expected number of satellite galaxies of M106 located beyond the surveyed region of M106 (kpc) by extrapolating the measured power-law slope of , resulting in N(kpc) . This number is quite similar to that of M31, but significantly lower than those of MW (), and the M81 group(). Thus, to find the expected number of satellite galaxies in M106 we need to increase the survey area by a factor of .
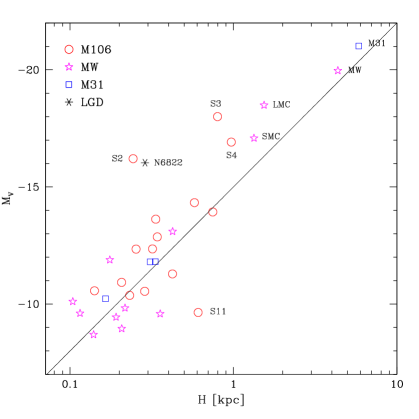
We show the distribution of dwarf galaxies of M106 in versus disk scale length () diagram in Fig. 10 (open circles). For comparison the distribution of LG dwarf galaxies are shown with different symbols. We do not include the data for the M81 group because Chiboucas et al. (2009) presented only the effective radii of the satellite galaxies. The scale length data for LG galaxies including spirals, dIrr, and dSph are from van den Bergh (2000). Most of dwarf galaxies of M106 are scattered in the domain of the distribution of dSph of LG. S11 classified as dSph in this study has relatively large disk scale length than the other dSph galaxies with similar luminosity. Late-type spiral satellite galaxies of M106 (S2, S3 and S4) are seen to lie well above the relation for dSph galaxies. Overall the distribution of dwarf galaxies in M106 is very similar to that of dIrr and dSph of LG in this diagram.
5 Summary and Conclusion
We present the result of a wide-area survey for satellite galaxies around M106. Our survey is based on the large field deep and images obtained using the CFHT MegaCam so that we could perform a systematic searching for satellite galaxies of M106. We summarize the main conclusions of the present study as follows.
1. Based on deep observations of M106, we found 16 candidate satellite galaxies of M106, located as far as kpc from the centre of M106. Four of them are new findings. Due to the limited exposure times and the large atmospheric seeing we are able to detect only a small number of TRGB stars in the satellite galaxies of M106. Our survey area might be significantly smaller than the physical boundary of M106 dark halo. Therefore we might miss several satellite galaxies outside of kpc from M106.
2. A satellite system of M106 shows a clear signature of central concentration toward M106 and is more concentrated toward the semi-major axis of M106. We fit the inner region of the radial surface number density profiles with a power-law, resulting a power index of , similar to that of the isothermal distribution.
3. The surface brightnesses of 15 satellites galaxies are found to fit well with an exponential profile while the remaining brightest satellite galaxy of M106 (S15) shows a radial profile of the typical early type galaxy.
4. The luminosity of 16 satellite galaxies spans a large range ( mag), but colours have a mean value of 0.73 with a small dispersion. The luminosity function of the satellite galaxies of M106 is well represented by the Schechter function with a faint end slope of .
5. The spatial distribution of the satellite galaxies of M106, Milky Way, M31, and the M81 group is found to be similar to one another.
Acknowledgments
Authors thank the anonymous referee for constructive comments and suggestions. EK was supported in part by the National Research Foundation of Korea to the Center for Galaxy Evolution Research and by the second phase of the Brain Korea 21 Program in 2010. MK was supported by Basic Science Research Program through the National Research Foundation of Korea (NRF) funded by the Ministry of Education, Science and Technology (2010-0007713). NH was supported in part by Grant-in-Aid for JSPS Fellow No. 20-08325. MGL was supported by Mid-career Researcher Program through NRF grant funded by the MEST (No.2010-0013875). HBA thanks to ARCSEC for the support from the National Research Foundation of Korea grant funded by the Korea government (2010-001308).
References
- Adelman-McCarthy et al. (2007) Adelman-McCarthy et al. 2007, ApJS, 172, 634
- Ann et al. (2008) Ann, H. B., Park, C., & Choi, Y.-Y. 2008, MNRAS, 389, 86
- Belokurov et al. (2006) Belokurov, V. et al. 2006, ApJ, 647, L111
- Belokurov et al. (2007a) Belokurov, V. et al. 2007a, ApJ, 658, 337
- Belokurov et al. (2007b) Belokurov, V. et al. 2007b, ApJ, 654, 897
- Benedict et al. (2007) Benedict, G. F. et al. 2007, AJ, 133, 1810
- Benson et al. (2002) Benson, A. J., Frenk, C. S., Lacey, C. G., Baugh, C. M., & Cole, S. 2002, MNRAS, 333, 177
- Bode et al. (2001) Bode, P., Ostriker, J. P., & Turok, N. 2001, ApJ, 556, 93
- Bono et al. (2008) Bono, G., Caputo, F., Fiorentino, G., Marconi, M., & Musella, I. 2008, ApJ, 684, 102
- Bullock et al. (2000) Bullock, J. S., Kravtsov, A. V., & Weinberg, D. H. 2000, ApJ, 539, 517
- Carignan et al. (1997) Carignan, C., Cote, S., Freeman, K. C., & Quinn, P. J. 1997, AJ, 113, 1585
- Chiboucas et al. (2009) Chiboucas, K., Karachentsev, I. D., & Tully, R. B. 2009, AJ, 137, 3009
- Chonis & Gaskell (2008) Chonis, T. S., & Gaskell, C. M. 2008, AJ, 135, 264
- Colin et al. (2000) Colin, P., Avila-Reese, V., & Valenzuela, O. 2000, ApJ, 542, 622
- Erickson et al. (1999) Erickson, L. K., Gottesman, S. T., & Hunter, J. H. Jr. 1999, ApJ, 515, 153
- Fouque et al. (1992) Fouque, P., Gourgoulhon, E., Chamaraux, P., & Paturel, G. 1992, A&AS, 93, 211
- Frenk et al. (1988) Frenk, C. S., White, S. D. M., Davis, M., & Efstahou, G. 1988, ApJ, 327, 507
- Fry et al. (1999) Fry, A. M., Morrison, H. L., Harding, P., & Boroson, T. A. 1999, AJ, 118, 1209
- Geisler (1996) Geisler, D. 1996, AJ, 111, 480
- Grillmair (2006) Grillmair, C. J. 2006, ApJ, 645, L37
- Gutiérrez & Azzaro (2004) Gutiérrez, C. M. & Azzaro, M. 2004, ApJS, 155, 395
- Helmi et al. (2003) Helmi, A., White, S. D. M., & Springel, V. 2003, MNRAS, 339, 834
- Herrnstein et al. (1999) Herrnstein, J. R., Moran, J. M., Greenhill, L. J. Diamond, P. J., Inoue, M., Nakai, N., Miyoshi, M., Henkel, C., & Riess, A. 1999, Nature, 400, 539
- Ibata et al. (2007) Ibata, R., Martin, N. F., Irwin, M., Chapman, S., Ferguson, A. M. N., Lewis, G. F., & McConnachie, A. W. 2007, ApJ, 671, 1591
- James et al. (2008) James, P. A., O’Neill, J., & Shane, N. S. 2008, A&A 486, 131
- Jedrzejewski (1987) Jedrzejewski, R. I. 1987, MNRAS, 226, 747
- Kamionkowski & Liddle (2000) Kamionkowski, M., & Liddle, A. R. 2000, Phys. Rev. Lett., 84, 4525
- Karachentsev (1996) Karachentsev, I. D. 1996, A&A, 305, 33
- Karachentsev et al. (2007) Karachentsev, I. D., Karachentseva, V. E., & Huchtmeier, W. K., 2007, Astronomy Letters, 33, 512
- Kauffmann et al. (1993) Kauffmann, G., White, S. D. M., & Guiderdoni, B. 1993, MNRAS, 264, 201
- Klypin et al. (1999) Klypin, A., Kravstov, A. V., Valenzuela, O., & Prada, F. 1999, ApJ, 522, 82
- Koch & Grebel (2006) Koch, A., & Grebel, E. K. 2006, AJ, 131, 1405
- Koposov et al. (2009) Koposov, S. E., Yoo, J., Rix, H.-W., Weinberg, D. H., Macciò, A. V., & Escudé, J. M. 2009, ApJ, 696, 2179
- Kravtsov et al. (2004) Kravtsov, A. V., Gnedin, O. Y., & Klypin, A. A. 2004, ApJ, 609, 482
- Landolt (1992) Landolt, A. U. 1992, AJ, 104, 340
- Lee (1993) Lee, M. G. 1993, ApJ, 408, 409
- Lee et al. (1999) Lee, M. G., Aparicio, A., Tikonov, N., Byun, Y.-I., & Kim, E. 1999, AJ, 118, 853
- Ma et al. (1997) Ma, J., Peng, Q.-H., & Gu, Q.-S. 1997, ApJ, 409, L51
- Macri et al. (2006) Macri, L. M., Stanek, K. Z., Bersier, D., Greenhill, L. J., & Reid, M. J. 2006, ApJ, 652, 1133
- Mager et al. (2008) Mager, V. A., Madore, B. F., & Freedman, W. L. 2008, ApJ, 689, 721
- Magnier & Cuillandre (2004) Magnier, E. A., & Cuillandre, J.-C. 2004, PASP, 116, 449
- Majewski et al. (2007) Majewski, S. R. et al. 2007, ApJ, 670, L9
- Makarova et al. (2002) Makarova, L. N., Grebel, E. K., Karachentsev, I. D., Dolphin, A. E., Karachentseva, V. E., Sharina, M. E., Geisler, D., Guhathakurta, P., Hodge, P. W., Sarajedini, A., & Seitzer, P. 2002, A&A, 396, 473
- Martin et al. (2006) Martin, N. F., Ibata, R. A., Irwin, M. J., Chapman, S., Lewis, G. F., Ferguson, A. M. N., Tanvir, N., & McConnachie, A. W. 2006, MNRAS, 371, 1983
- Mateo (1998) Mateo, M. L. 1998, ARA&A, 36, 435
- Metz et al. (2007) Metz, M., Kroupa, P., & Jerjen, H. 2007, MNRAS, 374, 1125
- Moore et al. (1999) Moore, B., Ghigna, S., Governato, F., Lake, G., Quinn, T., Stadel, J., & Tozzi, P. 1999, ApJ, 524, L19
- Newman et al. (2001) Newman, J. A., Ferrarese, L., Stetson, P. B., Maoz, E., Zepf, S. E., Davis, M., Freedman, W. L., & Madore, B. F. ApJ, 553, 562
- Panessa et al. (2006) Panessa, F., Bassani, L., Cappi, M., Dadina, M., Barcons, X., Carrera, F. J., Ho, L. C., & Iwasawa, K. 2006, A&A, 455, 173
- Park et al. (2008) Park, C., Gott, J. R., III, & Choi, Y.-Y. 2008, ApJ, 674, 784
- Sakamoto & Hasegawa (2006) Sakamoto, T., & Hasegawa, T. 2006, ApJ, 653, L29
- Sales et al. (2007) Sales, L. V., Navarro, J. F., Abadi, M. G., & Steinmetz, M. 2007, MNRAS, 379, 1475
- Schlegel et al. (1998) Schlegel, D. J., Finkbeiner, D. P., & Davis, M. 1998, ApJ, 500, 525
- Simon & Geha (2007) Simon, J. D., & Geha, M. 2007, ApJ, 670, 313
- Somerville (2002) Somerville, R. S. 2002, ApJ, 572, L23
- Stetson (1994) Stetson, P. B. 1994, PASP, 106, 250
- Trentham & Tully (2002) Trentham, N. & Tully, R. B. 2002, MNRAS, 335, 712
- Turner & Gott (1976) Turner, E. L., & Gott, J. R., III 1976, ApJS, 32, 409
- van Leeuwen et al. (2007) van Leeuwen, F., Feast, M. W., Whitelock, P. A., & Laney, C. D. 2007, MNRAS, 379, 723
- van den Bergh (2000) van den Bergh, S. 2000, The Galaxies of the Local Group, Cambridge: Cambridge University Press
- Walsh et al. (2007) Walsh, S. M., Jerjen, H., & Willman, B. 2007, ApJ, 662, L83
- Willman et al. (2005a) Willman, B. et al. 2005a, ApJ, 626, L85
- Willman et al. (2005b) Willman, B. et al. 2005b, AJ, 129, 2692
- York et al. (2000) York, D. G. et al. 2000, AJ, 120, 1579
- Zaritsky et al. (1997) Zaritsky, D., Smith, R., Frenk, C., & White, S. D. M. 1997, ApJ, 478, 39
- Zentner & Bullock (2003) Zentner, A. R., & Bullock, J. S. 2003, ApJ, 598, 49
- Zucker et al. (2004) Zucker, D. B. et al. 2004, ApJ, 612, L121
- Zucker et al. (2006a) Zucker, D. B. et al. 2006a, ApJ, 643, L103
- Zucker et al. (2006b) Zucker, D. B. et al. 2006b, ApJ, 650, L41
- Zucker et al. (2007) Zucker, D. B. et al. 2007, ApJ, 659, L21