Searching for Young M Dwarfs with GALEX 11affiliation: This paper is based on data gathered with the 6.5 m Magellan Telescopes
located at Las Campanas Observatory, Chile, the Keck II telescope, and the GALEX, 2MASS and HST/GSC v2.3 photometric catalogs. GALEX is operated for NASA by the California Institute of Technology under NASA contract NAS5-98034.
Abstract
The census of young moving groups in the solar neighborhood is significantly incomplete in the low-mass regime. We have developed a new selection process to find these missing members based on the GALEX All-Sky Imaging Survey (AIS). For stars with spectral types K5 () and younger than 300 Myr, we show that near-UV (NUV) and far-UV (FUV) emission is greatly enhanced above the quiescent photosphere, analogous to the enhanced X-ray emission of young low-mass stars seen by ROSAT but detectable to much larger distances with GALEX. By combining GALEX data with optical (HST Guide Star Catalog) and near-IR (2MASS) photometry, we identified an initial sample of 34 young M dwarf candidates in a 1000 sq. deg. region around the 10-Myr TW Hydra Association (TWA). Low-resolution spectroscopy of 30 of these found 16 which had H in emission, which were then followed-up at high resolution to search for spectroscopic evidence of youth and to measure their radial velocities. Four objects have low surface gravities, photometric distances and space motions consistent with TWA, but the non-detection of Li indicates they may be too old to belong to this moving group. One object (M3.5, 9319 pc) appears to be the first known accreting low-mass member of the 15 Myr Lower Centaurus Crux OB association. Two objects exhibit all the characteristics of the known TWA members, and thus we designate them as TWA 31 (M4.2, 11011 pc) and TWA 32 (M6.3, 535 pc). TWA 31 shows extremely broad (447 km s-1) H emission, making it the sixth member of TWA found to have ongoing accretion. TWA 32 is resolved into a 0.6″ binary in Keck laser guide star adaptive optics imaging. Our search should be sensitive down to spectral types of at least M4–M5 in TWA and thus the small numbers of new member is puzzling. This might indicate TWA has an atypical mass function or that the presence of lithium absorption may be too restrictive a criteria for selecting young low-mass stars.
1 Introduction
Observational studies of planet formation have been energized by the discovery of young (100 Myr) solar-type stars close to Earth (e.g. Jeffries 1995; Webb et al. 1999), identified from multiple indicators of youth including chromospheric activity and strong X-ray emission. The combination of distances, proper motions, and radial velocities (RVs) has allowed many of these stars to be kinematically linked to coeval moving groups (e.g., Zuckerman & Song 2004; Torres et al. 2008). These young moving groups (YMGs) are several times closer to Earth than the traditional well-studied star-forming regions such as Taurus and Orion (150–500 pc). More importantly, these groups have ages of 10–100 Myr, a time period in stellar evolution that has been largely underrepresented in previous studies. This is expected to be a key epoch for understanding planet formation, coinciding with the end of giant planet formation and the active phase of terrestrial planet formation (e.g. Mandell et al. 2007; Ida & Lin 2008).
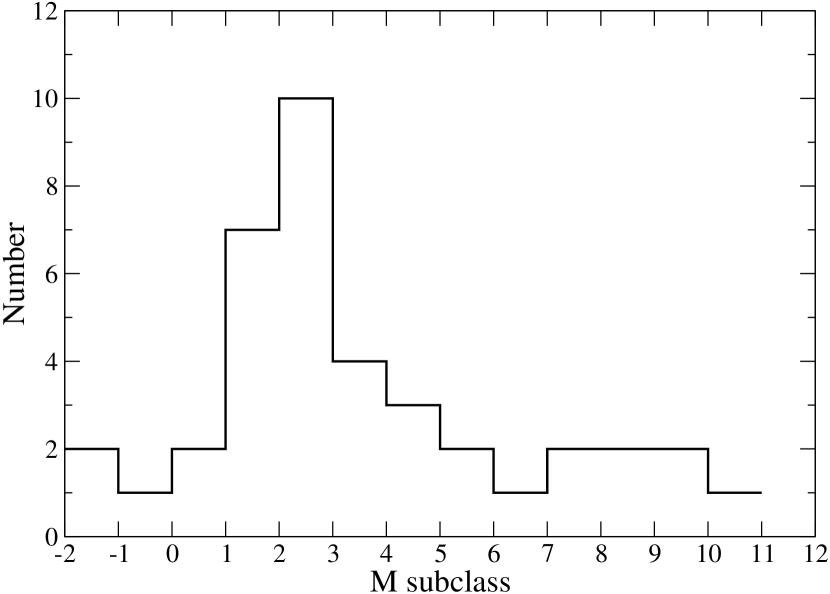
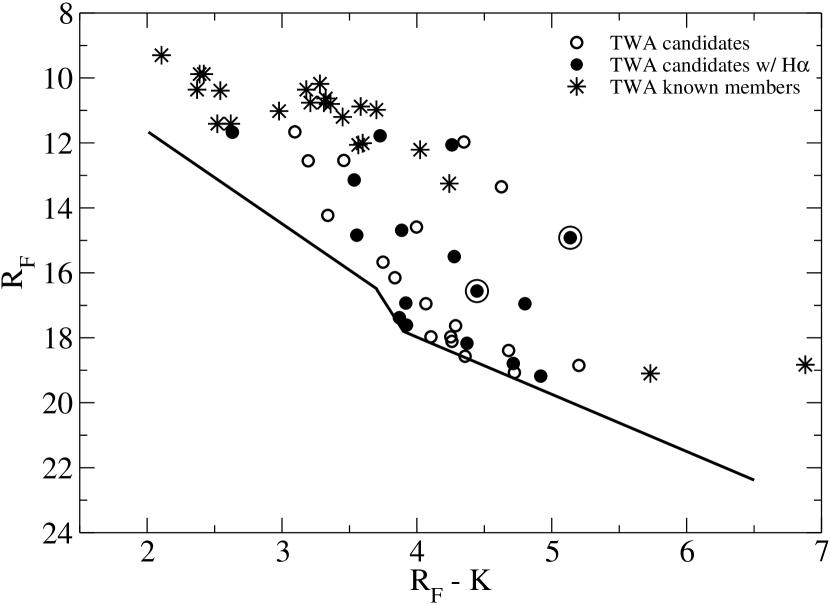
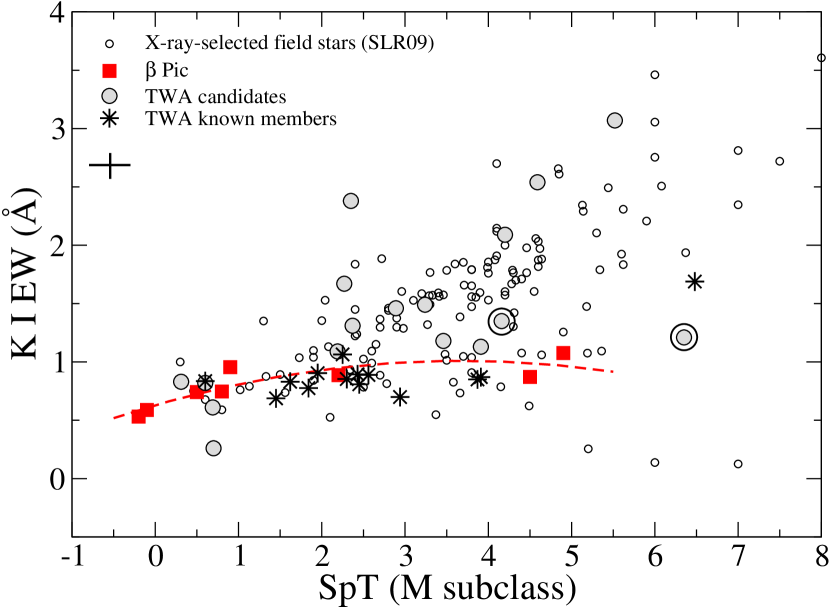
One of the best studied of these YMGs is the TW Hydrae Association (TWA; Kastner et al. 1997). Its unique combination of youth (10 Myr; Barrado Y Navascués 2006; Mentuch et al. 2008), proximity (30–100 pc) and (relative) compactness on the sky, makes it is a particularly promising observational test bed for theories describing disk evolution and planet formation. TWA is named for the actively accreting K7 star with a circumstellar disk (Henize 1976; Rucinski & Krautter 1983; de la Reza et al. 1989). The discovery of such a young star far from any star-forming region prompted several searches for additional T Tauri stars in the same part of the sky. These searches used infrared excesses with IRAS (Gregorio-Hetem et al. 1992), ROSAT X-ray activity (Sterzik et al. 1999; Webb et al. 1999), and common space motion (Song et al. 2003; Scholz et al. 2005), plus near-IR photometric searches for brown dwarfs (Gizis 2002; Looper et al. 2007). The current census of accepted TWA members is up to 25 objects (plus 2 discovered by us), including either late-K or early-M stars and a few brown dwarfs, making TWA seem unusual in its initial mass function compared to other star forming regions (e.g. Torres et al. 2008; Slesnick et al. 2008). In particular, there appears to be a dearth of M3–M7 stars (Figures 1 and 2; Mamajek 2005 and references therein). It is possible that this large incompleteness arises from the fact that most young star searches have mostly relied on bright optical catalogs (e.g., Hipparcos) as a starting point, which are deficient in M dwarfs, or perhaps TWA may have an unexpected mass function.
Over the last few years, we have been undertaking a systematic effort to complete the young low-mass census through multi-catalog selection and followup spectroscopy. Our initial work focused on the immediate solar neighborhood (25 pc), identifying the youngest M dwarfs from the known (Gliese & NStars) catalogs. Our spectroscopy had a very productive (80%) confirmation rate, identifying 144 new young ( 300 Myr) M dwarfs using X-ray selection (ROSAT Bright Source Catalog; Voges et al. 1999) as a first cut (Shkolnik et al. 2009, hereafter SLR09; Shkolnik et al. 2008, 2010). By scrutinizing the GALEX NUV and FUV properties of this 25-pc sample, we have constructed efficient selection criteria to expand the search for young M dwarfs to 100 pc thereby making the M dwarfs of many of the YMGs accessible. In this paper, we apply our new methodology to TWA to find its ‘missing’ M stars.
2 Selection of Young Stars using the GALEX All-sky Imaging Survey
Stellar activity is a well-established indicator of youth (e.g., Preibisch & Feigelson 2005), and the only all-sky surveys suited for finding active, young stars have been the ROSAT X-ray catalogs (e.g. Voges et al. 1999). However, since the luminosities of M dwarfs are 10–300 lower than solar-type stars, ROSAT is generally limited to the nearest, earliest-type M dwarfs.
The NASA Galaxy Evolution Explorer (GALEX; Martin et al. 2005) provides a new resource that enables a major expansion of the young low-mass census, far beyond previous data sets. The GALEX satellite was launched on April 28, 2003 and has imaged most of the sky simultaneously in two bands: near-UV (NUV) 1750–2750 Å and far-UV (FUV) 1350–1750 Å, with angular resolutions of 5″and 6.5 across a 1.25∘ field of view. The full description of the instrumental performance is presented by Morrissey et al. (2005). The GALEX mission is producing an All-sky Imaging Survey (AIS) which is archived at the Multi-mission Archive at the Space Telescope Science Institute (MAST).111One can query the AIS through either CasJobs (http://mastweb.stsci.edu/gcasjobs/) or a web tool called GalexView (http://galex.stsci.edu/galexview/). The NUV/FUV fluxes and magnitudes are produced by the standard GALEX Data Analysis Pipeline (ver. 4.0) operated at the Caltech Science Operations Center (Morrissey et al., 2005). The data presented in this paper made use of the fourth data release of the AIS (GR4), covering 2/3 of the sky.222See details at http://www.galex.caltech.edu/researcher/techdoc-ch2.html.
For M dwarfs, the flux in the GALEX bandpasses is made up of an abundance of emission lines. Stellar flare activity on M dwarfs observed by Robinson et al. (2005) and Welsh et al. (2007) has shown that GALEX’s FUV flux is mainly due to transition region C IV (50%), while weaker emission lines and continuum provide the remaining 50%. In the NUV band, flux is primarily due to continuum emission plus Mg II (10%), Fe II (17%), Al II and C III (14%) lines. In addition, coronal lines provide 2% of the FUV and 10% of the NUV emission. (See also Pagano 2009.) This makes GALEX ideal for finding active low-mass stars (e.g. Findeisen & Hillenbrand 2010).
We first tested GALEX’s sensitivity for finding young M dwarfs by correlating the X-ray-selected sample of M dwarfs within 25 pc described in SLR09 with the GALEX/AIS archive. Sixty-seven percent were detected in the NUV band, corresponding to the 67% sky coverage of the AIS in the GR4 data release, i.e. all those observed by GALEX were detected. This indicates that GALEX is at least as sensitive as ROSAT in identifying young M dwarfs. The GR4 release also detected 17 of the 25 (68%) known M dwarfs in TWA (not double-counting visual binaries (VBs) not resolved by GALEX), with 7 of the 8 remaining not yet observed. The only TWA members observed by GALEX but not confidently detected were TWA 30 A and B (Looper et al., 2010a, b).333GALEX does have a weak (2.4) detection in the NUV bandpass 26 away from TWA 30 A’s 2MASS coordinates, with no corresponding FUV detection. The non-detection of TWA 30 A may be related to the unusually low H EW and spectral variability observed for this target. Looper et al. (2010a) speculate this is due to an accretion disk viewed nearly edge-on with the stellar rotation axis inclined to the disk. Similarly, there is an 8 detection 27 away in a different direction from TWA 30 B (Looper et al., 2010b).
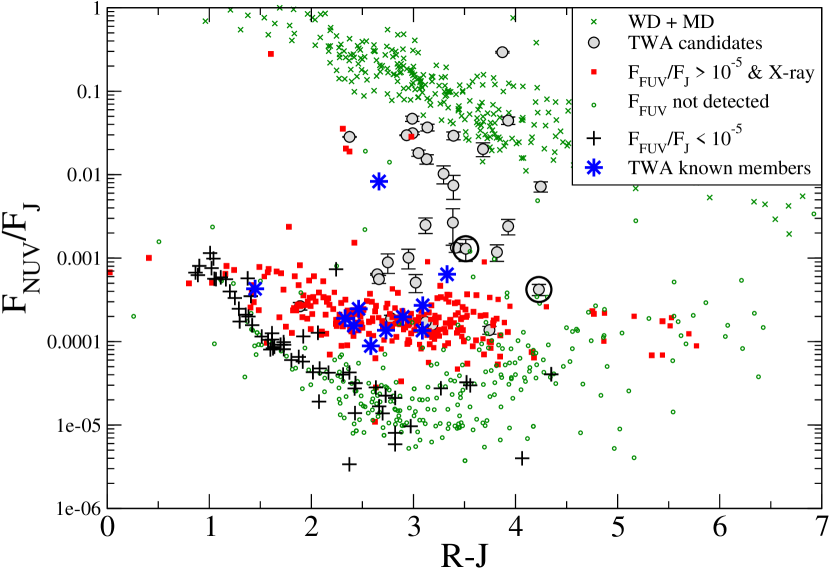
We then carried out a search for UV detections with the NStars 25-pc census (1500 M dwarfs; Reid et al. 2007). Those with NUV detections are plotted in Figure 3 as a function of color as a proxy for effective temperature. From the results of this GALEX 25-pc analysis, we found that NUV data yield many candidates, but applying FUV criteria provide an excellent means to distinguish between the (never-before-delineated) quiescent emission of old stars ( 10-5), the faint sources (FUV not detected), and the truly young targets with high levels of NUV and FUV emission, where , and are the stellar fluxes in the respective bandpasses. We find that for 4 (SpT M4), we can detect young M dwarfs at least out to several hundred parsecs. And for young stars later than 6 (SpT M7), we can probe out to distances of 75 – 100 pc and further for very active stars. Thus GALEX offers an enormous advantage for detecting young M dwarfs compared to ROSAT.
In principle, flaring M dwarfs could contaminate our sample since UV flares would be mistaken for strong steady-state UV excesses. However, we expect the contribution of these objects to be less than 3%, based on the fraction of short-term flaring M dwarfs from GALEX results thus far (Welsh et al. 2006).
To summarize, the GALEX/AIS is substantially more sensitive than previous ROSAT catalogs, meaning that young M dwarfs can be identified at much greater distances and to later spectral types. In this study, we use the GALEX NUV and FUV data combined with existing optical and NIR photometric catalogs to identify TWA candidate members within 100 pc of the Sun.444While this manuscript was under review, a preprint by Rodriguez et al. (2010) presented a NUV+NIR search for members of TWA and the Scorpius-Centaurus, including the star we refer to as TWA 32. However, their RV and UVW of this star are inconsistent with our measurements. They exclude it as a member of any known YMG.
3 Sample Selection of TWA Candidates
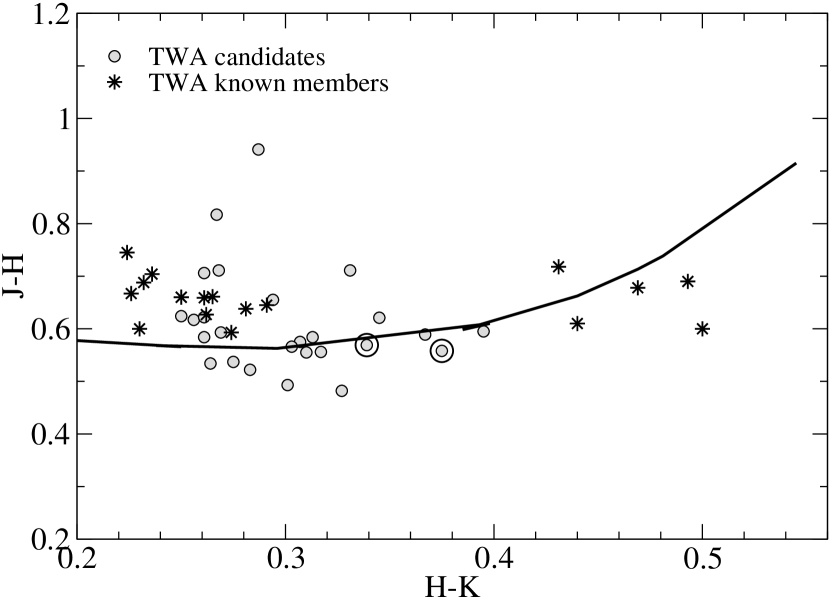
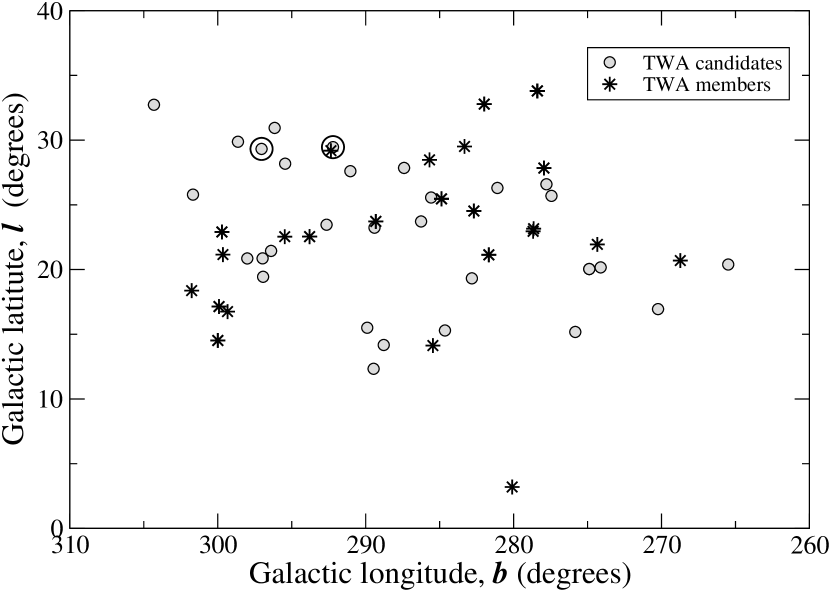
Late-K and M dwarfs have distinctive photometric properties, and we can use these to identify stars within 100 pc. We combined optical photometry from the HST Guide Star Catalogue (GSC 2.3; Lasker et al. 2008) with photometry from the 2MASS Point Source Catalogue (Cutri et al. 2003) to identify candidate late-type dwarfs. We first queried the 2MASS catalog for all sources with 0.25 (Figure 2), aiming to include everything with SpT later than M2 within a 1000 sq. deg. region around the known TWA members bounded by these position limits: RA=10 to 13 hrs, DEC=–30 to –60 degrees, 10 degrees (Figure 4). This yielded 261,547 objects. Cross-matching these against the GSC 2.3 catalog returned 183,361 targets. A 10″ cross-matching with the GALEX/AIS returned 1968 targets with 3 detections in both the NUV and FUV, as well as eliminated any background early-M giants.
The distance limit was set using an optical/near-infrared color-magnitude diagram, vs. – (Figure 5, Reid et al. 2007), where is GSC 2.3’s photometric optical band with a wavelength range from 6000 to 7500 Å, very similar to the standard passband. This method has proven extremely effective at identifying cool dwarfs within 25 pc, and
it was a simple matter to extend it to larger distances. For young pre-main-sequence (PMS) stars which are over-luminous compared to dwarfs, the effective distance limit becomes 120 pc for the early M’s
based on PMS models by Baraffe et al. (1998).
Our resulting photometric cuts were:
2.85(–)+5.94; 2 (–) 3.7
6.5(–)–7.55; 3.7 (–) 3.9
1.76(–)+10.94; 3.9 (–) 6.5
Fifty-five targets remained after applying these color-cuts. The TWA candidates chosen have both high NUV and FUV fractional luminosities ( 10-5 and 10-4), comparable to or greater than strong X-ray emitting M dwarfs (SLR09) and known TWA members. This generated a target list of 38 stars (including 4 previously known TWA members, TWA 3A, 3B, 10 and 12)555The known TWA members not listed here were outside of our search criteria, i.e. had 0.25, had declinations above –30 degrees, or, as is the case for the brown dwarf members, were not detected in the FUV bandpass at the 3 level. for spectroscopic followup (Figures 3 and 5).
4 Spectroscopic Confirmation
We then subjected our compiled list of GALEX-selected TWA candidates through a two-step process of ground-based spectroscopy to assess their potential membership in TWA. We first acquired low-resolution spectra to search for the activity-sensitive emission line H always present in young low-mass stars (400 Myr; West et al. 2008). Thirty of the 34 candidates were observed with the Magellan Echellette Spectrograph (MagE; Marshall et al. 2008) mounted on the 6.5-m Clay telescope on UT 2009 February 10 (Table 1). MagE is a moderate resolution, cross-dispersed echellette, covering the optical wavelengths from 3100 – 10000 Å. We used the 0.7 slit which produced a resolution of 4100. Wavelength calibration was performed with the ThAr exposures taken before and after each stellar target.
Of these 30, 16 exhibited H in emission (EW –1 Å), for which we acquired high-resolution spectra using the Magellan Inamori Kyocera Echelle (MIKE) spectrograph also at the Clay telescope over several nights: UT 2009 April 15, June 6 - 8, December 31 and 2010 January 1. We also observed 14 of the known TWA M dwarfs666Our spectrum of TWA 23 revealed it to be a double-lined spectroscopic binary (SB2). (Tables 2 and 3). We used the 0.5 slit which produces a spectral resolution of 35000 across the 4900 – 10000 Å range of the red chip. These data were reduced using the facility pipeline (Kelson, 2003). Each stellar exposure was bias-subtracted and flat-fielded for pixel-to-pixel sensitivity variations. After optimal extraction, the 1-D spectra were wavelength calibrated with a ThAr arc. To correct for instrumental drifts, we used the telluric molecular oxygen A band (from 7620 – 7660 Å) which aligns the MIKE spectra to 40 m s-1, after which we corrected for the heliocentric motion of the Earth. The final spectra are of moderate S/N ( 25 per pixel at 8000 Å).
The MIKE data provide RV measurements to better than 1 km s-1 in almost all cases. We measured RVs of our 16 candidates and 14 known TWA members by cross-correlating their spectra with those of two RV standards taken on the same night, namely GJ 179 (SpT = M4; Marcy et al. 1987) and/or GJ 908 (SpT = M1; Nidever et al. 2002). We cross-correlated each of 9 spectral orders between 7000 and 9000 Å (excluding those orders with strong telluric absorption) where M dwarfs emit most of their optical light using IRAF’s777IRAF (Image Reduction and Analysis Facility) is distributed by the National Optical Astronomy Observatories, which is operated by the Association of Universities for Research in Astronomy, Inc. (AURA) under cooperative agreement with the National Science Foundation. fxcor routine (Fitzpatrick 1993). We measured the RVs from the gaussian peak fitted to the cross-correlation function of each order and adopted the average RV of all orders. The target RVs and their standard deviations are listed in Table 4.
The high-resolution spectra also allowed us to identify multi-lined binaries whose excess UV emission may be due to the tidal locking of a close-in binary system rather than youth. We found 2 (possibly 3) of the 16 to be SB2s consistent with the 16% low-mass spectroscopic binary fraction of our ROSAT study (SLR09, Shkolnik et al. 2010). With single epoch observations we are unable to exclude SB1s from the remaining sample, however, given the results of SLR09, we do not expect any to be found with orbital periods less than 1–2 years.
5 Spectral Types
The spectra of M dwarfs are dominated by the strong TiO molecular bands, which are particularly diagnostic of the star’s temperature. To estimate spectral types (SpT) we used the TiO-7140 index defined by Wilking et al. (2005) as the ratio of the mean flux in two 50-Å bands: the ‘continuum’ band centered on 7035 Å and the TiO band on 7140 Å. We calibrated the TiO-7140 index for our data sets using 126 M dwarfs from the NStars 25-pc sample (Reid et al. 2007) we observed with MIKE that have published spectral types plus several RV standards and known members of TWA (Reid et al. 1995; Riaz et al. 2006, Wenger et al. 2007 and references therein). The relationship we used to convert the TiO-7140 index to SpT for M0 – M6 stars is:
SpT=(TiO, rms= 0.5 subclasses (1)
Here, M0 corresponds to SpT=0, M1 1, M2 2, etc. The linear fit to the calibration is consistent to better than 0.2 subclasses with that used for the Keck/HIRES and CFHT/ESPaDoNS data presented in SLR09. We determined the errors of our measurements for the TiO index (and subsequent indices discussed below) by taking the mean standard deviations measured for 5 RV standards stars observed with the same setup on multiple nights. We calculated an average error of 0.012 in the TiO index measurement, which translates to only 0.07 subclasses in SpT. Although this uncertainty is small, the calibration is based on a sample with SpTs binned to half a subclass, imposing a 0.5 subclass uncertainty in the calculated SpTs listed in Table 1.
6 Identifying the Young Stars
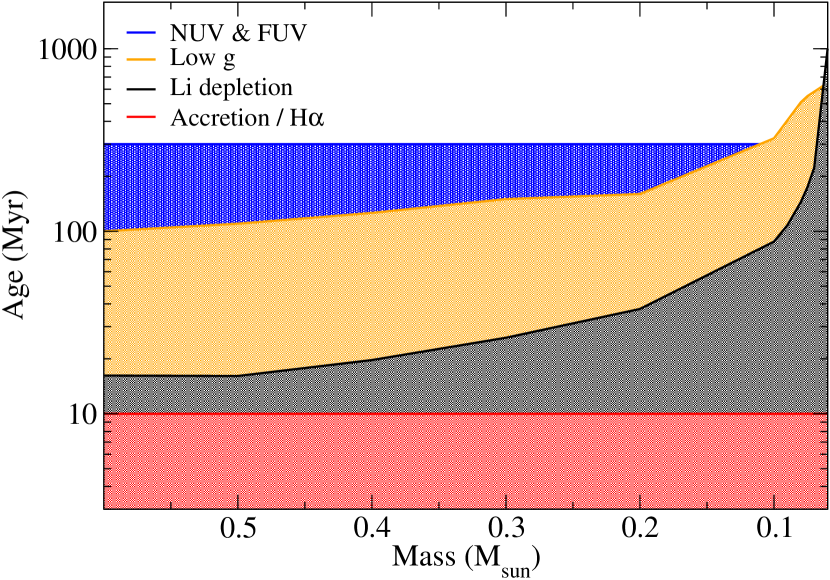
Our preliminary selection criterion of strong fractional NUV and FUV flux coincides with the UV emission levels of the strong X-ray emitters of SLR09 and Riaz et al. (2006) as shown in Figure 3. This implies a rough upper limit to the age of our sample of 300 Myr as estimated for the two ROSAT samples. After identifying the strongest UV emitters in our sample ( 10-5 and 10-4), we used the same spectroscopic age-dating criteria discussed in detail in SLR09 and summarized in Figure 6, i.e. low gravity, lithium absorption and strong H emission as diagnostics of youth.
6.1 Spectroscopic Youth Indicators
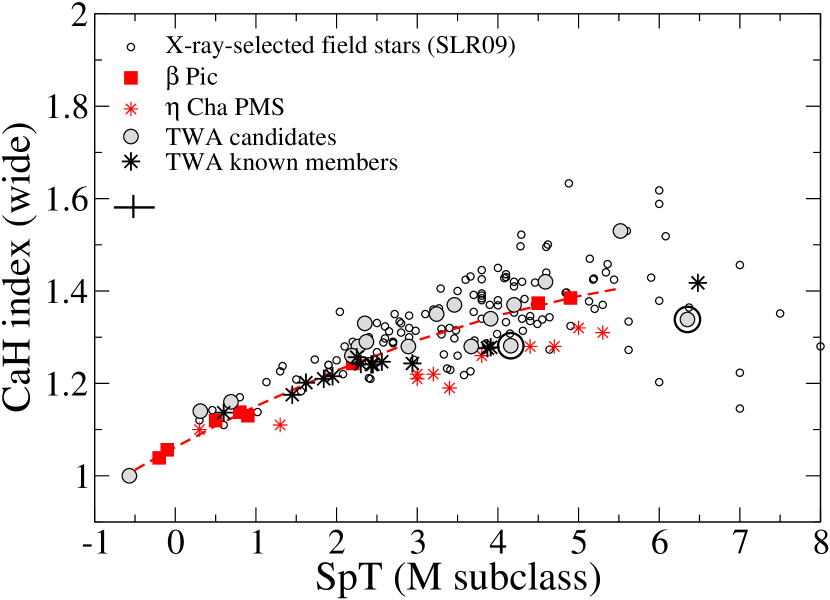
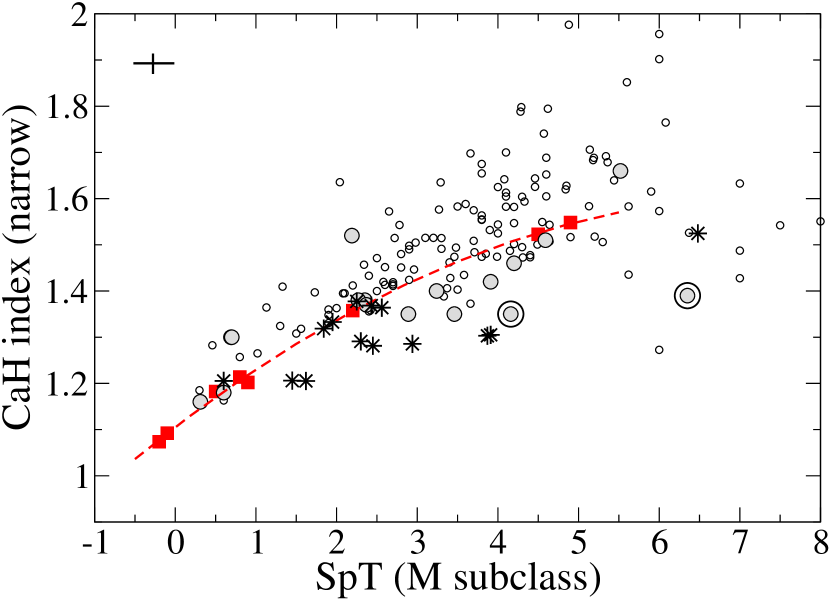
Models of PMS stars show that lower-mass stars take longer to contract to the main-sequence (MS), e.g. a 0.5 M⊙ star will reach the MS within 100 Myr whereas a 0.1 M⊙ star will do so in 300 Myr (Baraffe et al., 1998) and thus determining if a M star has low surface gravity provides an upper limit to its age. We used the CaH gravity index from Kirkpatrick et al. (1991) defined as the ratio of the mean intensity in two passbands, a ‘continuum’ band and a molecular absorption band of CaH 6975: [7020-7050 Å]/[6960-6990 Å]. Since we have 15–20 times the resolution of previous M dwarf surveys, we also used a narrower 5-Å CaH index [7044–7049]/[6972.5–6977.5] providing a more discriminating scale with which to identify low-gravity stars (SLR09). Both indices are plotted as function of SpT in Figure 7.
An important caveat to using the TiO and CaH molecules as temperature and gravity diagnostics is their dependence on metallicity. Higher metallicity will mimic later spectral types and lower surface gravities. (See discussion in Section 5.1.1 of SLR09.) We thus also used the K I 7699 Å line as a gravity indicator (e.g. Slesnick et al. 2006). Care is required with this line as well as it is affected by stellar activity such that higher levels of chromospheric emission fill in the absorption cores and reduce the measured EWs.
Combining the effects of the chromosphere on K I with the uncertainties in metallicity on the TiO and CaH indices, we considered a target as having low-g only if both the CaH and K I measurements indicate that it is so. We flagged a target as such in Table 4 if it falls on or below (within error bars) the best-fit curves to the observed Pic members in Figures 7 and 8. Data for the 12-Myr old Pic members were taken from SLR09. Out of the 16 UV-bright stars with H in emission, 8 have low surface gravity with upper age limits of less than 160 Myr (Baraffe et al., 1998). Three of these 8 show additional indications of youth and will be discussed in more detail in the following sections.888The 5 stars with no additional signs of youth have SpTs ranging from M0.3 to M3.9. For these early SpTs, the difference in their predicted masses for a given age produce negligible results in the upper age limits set by the models. If the SpTs were known more precisely, the most significant difference would be in the upper age limit set for the M3.9 star, which would change from 160 Myr to 120 Myr.
Lower limits on the stellar ages for early M dwarfs are provided for those stars with no lithium absorption (6708 Å) using the lithium depletion time scales calculated by Chabrier et al. (1996). However, it has been recently shown empirically for at least the Pic moving group, that lower age limits of individual stars based on the lack of lithium absorption systematically over-estimates the star’s age as compared to model isochrones (Yee & Jensen, 2010). In agreement with this, Baraffe & Chabrier (2010) recently presented models where stars that are exposed to episodic accretion have higher internal temperatures and thus enhanced lithium depletion compared to stars of the same age and mass but without such accretion. This would imply that the stars with lower age limits in Table 4 may indeed be younger, perhaps even as young as 10 Myr.
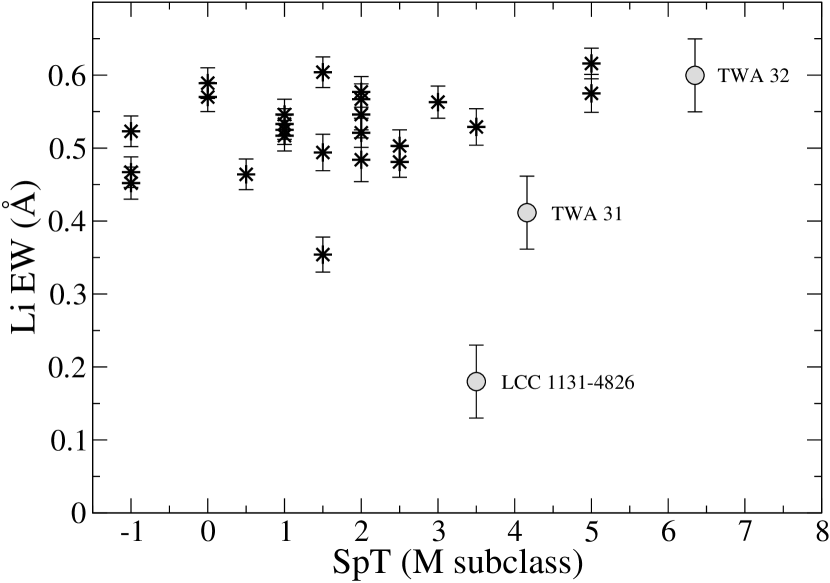
We have measured large lithium EWs999The lithium abundances have not been corrected for possible contamination with the Fe I line at 6707.44 Å. Uncertainties in the setting of continuum levels prior to measurement induce EW errors of about 0.01–0.02 Å with a dependence on the S/N in the region. We therefore consider our 2 detection limit to be 0.1 Å. in 2 of our targets (TWA candidates 1207–3230 and 1226–3316; see Section 7) and one marginal detection (0.18 0.05 Å) in candidate 1131–4826 (Figure 9) setting an upper age limit just from the lithium detection of 40 Myr for the first two and 15 Myr for the last due to its earlier SpT.
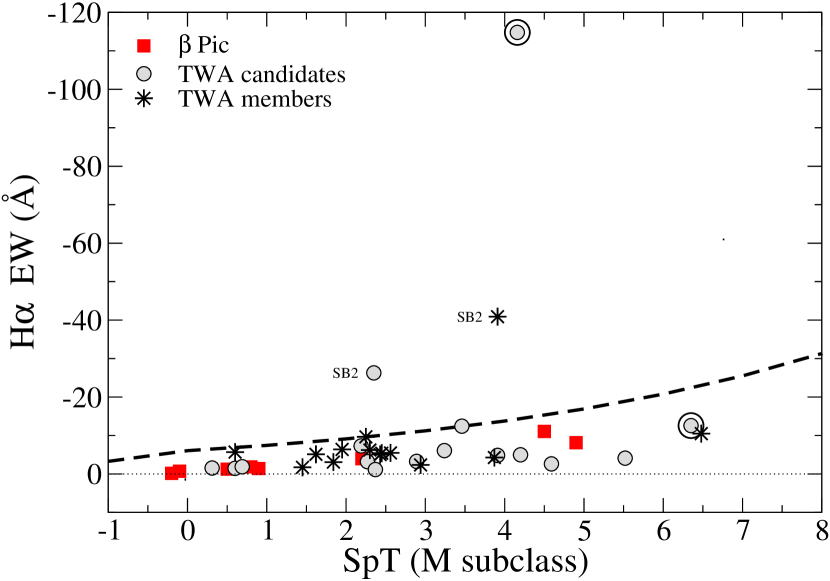
Lastly, the most stringent upper limit is provided by the detection of active stellar accretion. Barrado y Navascués & Martín (2003) have produced an empirical accretion diagnostic by calibrating the H EW as a function of SpT. This accounts for the increase in EW simply due to the drop in continuum flux from cooler stars (Figure 10). Though the accretion curve is not thought to be very robust for objects of SpT later than M5.5, due to the few late-M cluster members used to calibrate the sequence, it does serve as an outer envelope of the chromospheric emission in early Ms. In addition to the EW limits, White & Basri (2003) impose a H 10% velocity width criterion of 270 km s-1 for optically veiled T Tauri stars, and 200 km s-1 for non-optically veiled T Tauri stars.
We plot the H EW of our target stars in Figure 10. One of the two strong lithium stars exhibits extremely large H emission, and is discussed in more detail below. Two additional stars in Figure 10 have H EWs beyond this accretion/non-accretion boundary, both of which are SB2s, including TWA 3Aab of which at least one component is still accreting as determined by its very broad H velocity width (395 km s-1). The other SB2, TWA candidate 1013–3542, must have enhanced chromospheric emission due to the tidal spin-up of the two stars, not accretion, as there are no additional spectral signatures of youth, i.e. no lithium absorption nor any indication of low gravity.
6.2 Kinematics of the TWA Candidates
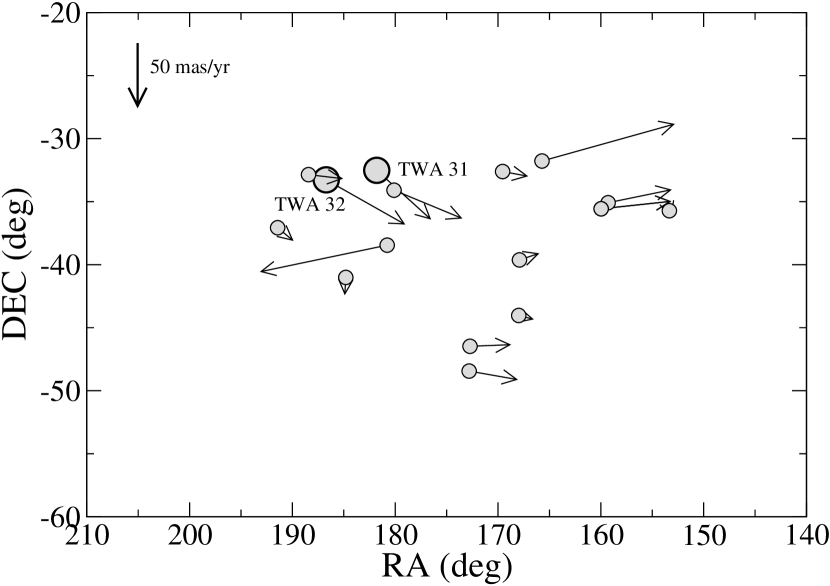
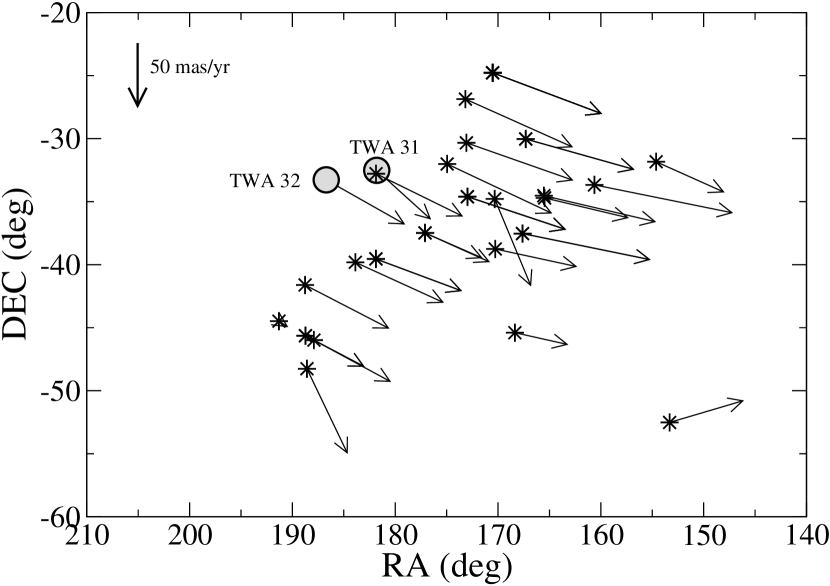
The high resolution of the data provided RV measurements to better than 1 km s-1 in almost all cases, which we used in conjunction with the star’s photometric distance and proper motions (Figure 11) to measure its 3-dimensional space velocity (UVW; Johnson & Soderblom 1987). This provides a promising way to determine stellar ages by linking stars kinematically to one of the several known YMGs or associations, including TWA.
We calculated photometric distances for our sample of TWA candidates, as well as for the known TWA members we observed and have listed them in Tables 3 and 5. We used the 2MASS magnitude, or (when available) colors and the age and absolute K magnitudes from the Baraffe et al. (1998) models to measure the photometric distance. We took into account the spectroscopically determined ages (or upper age limits) from Table 4, since PMS stars are over-luminous compared to dwarfs and will appear closer than they are. For the proposed two new TWA members (discussed below), we adopted the 10 Myr age of TWA (Barrado Y Navascués, 2006; Mentuch et al., 2008). Distances are corrected for any known unresolved binaries. Given the uncertainties in the models, the metallicities of the stars, and the age ranges provided in Table 5, we estimate the errors to be 20% for the non-TWA members and 10% for the TWA members, which have more precise ages, and not only upper age limits.
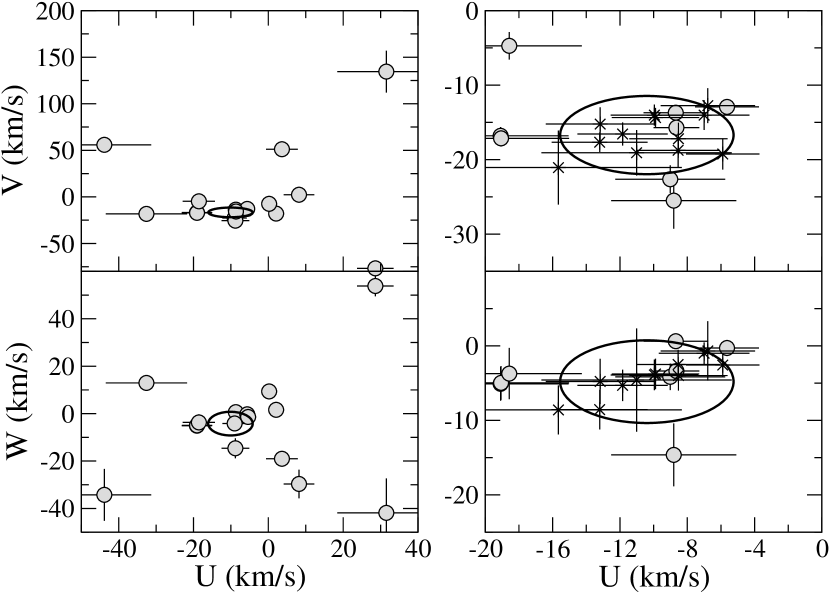
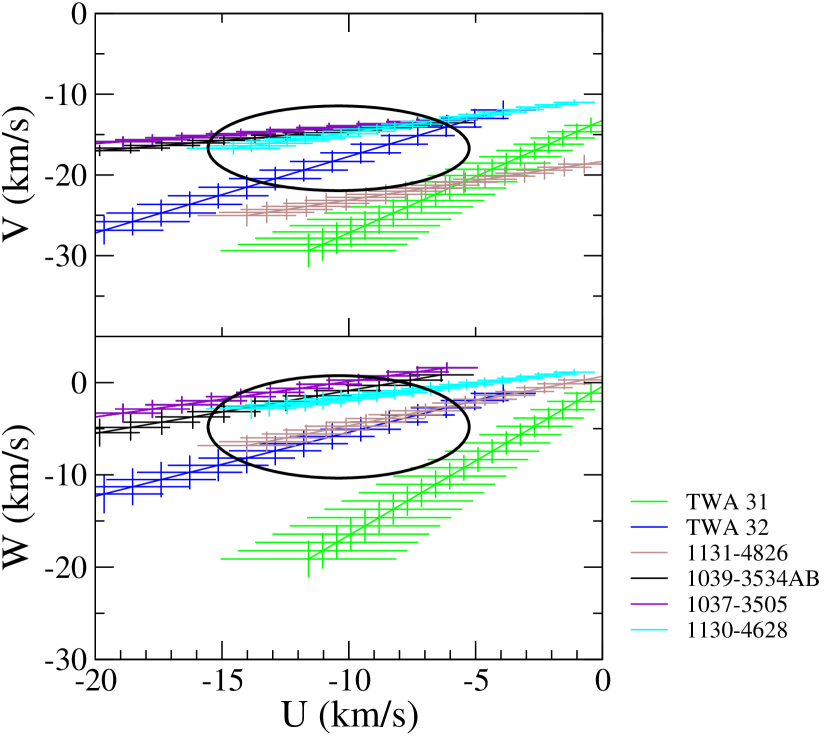
The UVW velocities for the targets are shown in Figure 12. Seven TWA candidates fall near the 2 error ellipse for the UVWs of known TWA members. Their RA/DEC co-ordinates are 1037–3505, 1039–3534 A, 1039–3534 B, 1130–4628, 1131–4826, 1207–3230, and 1226–3316. And given the large uncertainty in distance, we plot the UVWs of these 7 with a range of possible distances (30–130pc) in Figure 13.
All 7 of the stars appear to have low surface gravity, with only the last two exhibiting strong lithium absorption. (See Section 7.) The eighth star listed as low-g in Table 4, 2MASS1111-3937, has strong and broad H emission as well but UVW velocities inconsistent with the “good UVW box” defined for young stars by Zuckerman & Song (2004). It is thus probable that 2MASS1111-3937 is an unresolved SB2 with broadened spectral features caught at an orbital phase near conjunction.
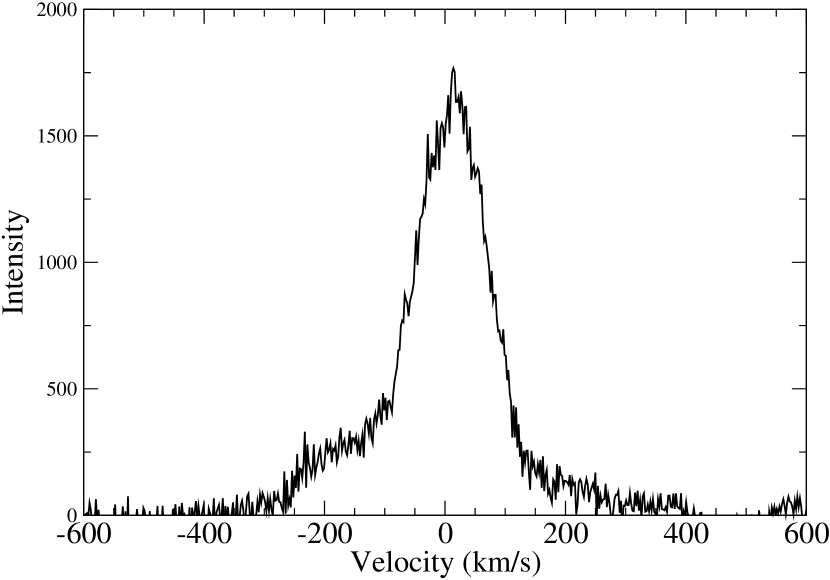
Candidate 1131–4826 has a weak lithium detection with an EW of 0.18 0.05 Å, setting an age limit of 15 Myr. Based on its age, distance of 93 19 pc, RV of 17.02 1.16 km s-1 and UVW velocities (–9.0 3.3, –22.6 1.9, –4.1 1.8 km s-1), we conclude that this target is a member of LCC (de Zeeuw et al., 1999; Mamajek et al., 2002; Bitner et al., 2010) rather than TWA. It is also worth pointing out that LCC 1131–4826 appears to still be accreting based on its broad H profile (233 km s-1; Figure 14), making it the first known accreting M star in LCC (Preibisch & Mamajek 2008).
The remaining four low-g stars with UVWs near the TWA UVW error ellipse show no additional signs of youth beyond the UV excess and H emission, and have upper age limits ranging from 110 – 300 Myr. They range in distance of 41 – 84 pc and, assuming lithium is a necessary youth indicator, are not obviously part of either TWA or LCC.
7 Two New TWA Members: TWA 31 and TWA 32
Two of our targets share all the same spectroscopic, photometric and kinematic characteristics of known TWA members including low surface gravity, strong Li absorption, strong H emission, plus RVs and UVWs consistent with previously known TWA members. These two likely members have 2MASS coordinates [12:07:10.89 –32:30:53.72] and [12:26:51.35 –33:16:12.47], SpTs of M4.2 and M6.3, and in keeping with tradition, we dubbed them TWA 31 and 32, respectively. They are identified in Tables 1 and 4, and are marked by large circles in the figures. Proper motions for the two are from the NOMAD catalog (Zacharias et al., 2005), and agree well with the proper motion vectors of known members (Figure 11).
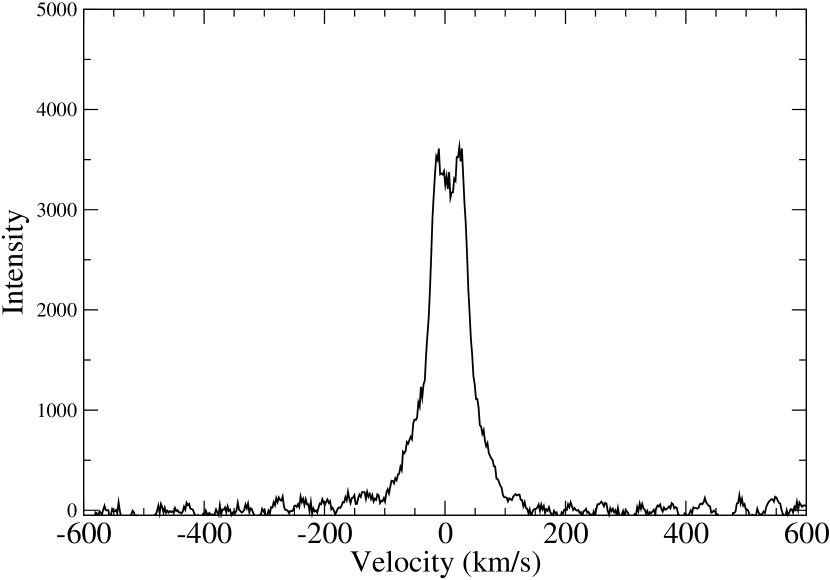
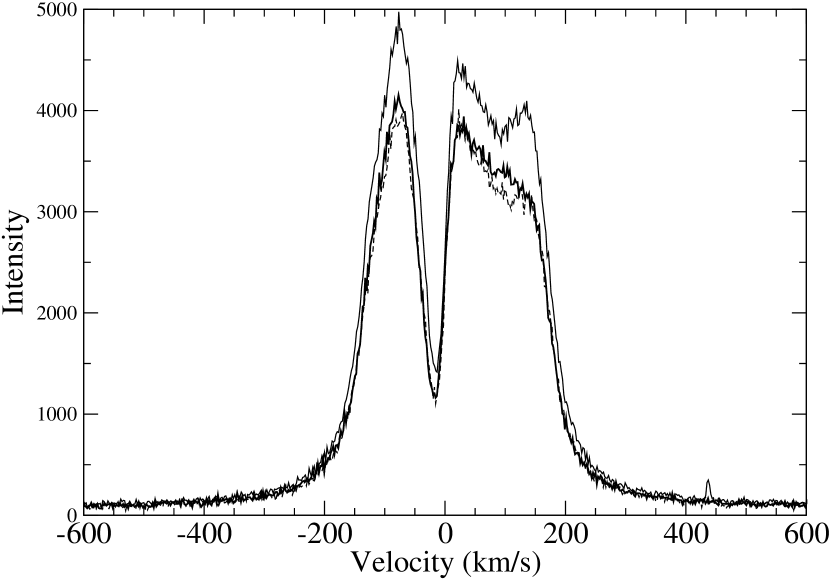
The average Li EW of undisputed members TWA 1–12 from (Mentuch et al., 2008) is 0.52 with =0.06 Å, and TWA 32’s EW is consistent with this (0.60 0.05 Å). TWA 31 has a slightly lower-than-average Li EW (0.41 0.05 Å), likely due to optical veiling (Duncan 1991). TWA 31 also has by far the strongest H emission in our sample with an H EW of –115 Å and an extremely accretion-broadened 10%-velocity width of 447 km s-1 (Figure 15), characteristics comparable to TW Hydrae itself.101010Values for TW Hyd are: log() = –2.081, log() = -2.456, Li EW = 0.467 0.021 Å (Mentuch et al., 2008), H EW = 220 Å (Reid, 2003), H 10% velocity width = 400 km s-1 (Alencar & Batalha, 2002). We conclude that TWA 31 is also an accreting T Tauri star with an age of 10 Myr. TWA 31 also emits strongly at He I (EW of –3.6 Å at 6678 Å and –10.3 Å at 5867 Å), yet another indication of accretion (Mohanty et al., 2005), making it only the 6th known TWA accretor - the other ones being, TW Hyd, Hen 3-600, TWA 14 (Muzerolle et al., 2000b, 2001) and TWA 30A+B (Looper et al., 2010a, b).
The photometric distances for TWA 31 and 32 are 110 11 pc and 53 5 pc (taking binarity into account; see below), respectively. Although the distance to TWA 31 is relatively large compared to most of the known TWA members, it does not appear to be part of any other neighboring association and is certainly too young to be a member of the 120-pc, 16-Myr old LCC, which is adjacent on the sky to TWA. It is possible that the large distance of TWA 31 implies that it is part of an unidentified young star association in the direction of TWA, as speculated about several other distant, yet clearly young, TWA members (Weinberger et al. 2011).
7.1 Keck LGS AO Imaging of TWA 32
We imaged TWA 32 on UT 2010 May 22 using the sodium laser guide star adaptive optics (LGS AO) system of the 10-meter Keck II Telescope on Mauna Kea, Hawaii (Wizinowich et al., 2006; van Dam et al., 2006). We used the facility IR camera NIRC2 with its field of view during photometric conditions. The LGS provided the wavefront reference source for AO correction, with the tip-tilt motion measured simultaneously from the star itself. We obtained a set of dithered images with the broadband (2.20 µm) filter from the Mauna Kea Observatories filter consortium (Simons & Tokunaga 2002; Tokunaga et al. 2002) and easily resolved the target into a nearly equal-flux binary. Images were reduced in a standard fashion, and the relative astrometry and photometry were derived using a multi-gaussian representation of the PSF (e.g. Liu et al. 2008). Astrometry was corrected for instrumental distortion, with the absolute calibration of plate scale and orientation from Ghez et al. (2008). We measured a separation of mas, a position angle of degs, and a flux ratio of mag, with the uncertainties determined from the scatter in the individual images and the overall astrometric calibration uncertainties.
8 Summary
We set out to find the ‘missing’ mid-M dwarfs in TWA by cross-matching optical (HST GSC), infrared (2MASS) and UV (GALEX) catalogs, filling in the stellar mass function in the association and providing excellent targets for direct imaging searches for substellar companions and circumstellar disks. GALEX provides a new and more sensitive resource that enables a major expansion of the young low-mass census, far beyond previous data sets. We found that NUV data yield many candidates, but applying FUV criteria provide an excellent means to distinguish between the (never-before-delineated) quiescent emission of old stars ( 10-5), the faint sources (FUV not detected), and the truly young targets with high levels of UV emission ( 10-5 and 10-4 for ). The photometric cross-matching yielded 34 UV-bright low-mass stars with SpT between M0 and M6 within 100 pc and 1000 sq. deg. of the TWA with ages likely less than 300 Myr.
Ground-based optical low-resolution spectroscopy of 30 identified 16 with H emission which were followed up with high-resolution spectroscopy.111111Several of the UV bright targets with no H emission are white dwarf+M dwarf pairs. Of these, 2 (possibly 3) are old SB2s with tidally enhanced UV emission. Six are nearby field Ms with ages probably younger than 300 Myr, based on their strong UV emission with no additional signs of youth. One candidate appears to be an accreting new member of the 16-Myr old LCC, and 5 are low-gravity M dwarfs with maximum ages ranging from 110 – 300 Myr. Four of these 5 low-g stars are kinematically identical to the previously known TWA members, yet are likely older than 20 Myr based on the absence of Li absorption. Thus identifying new YMG members based on kinematics and strong X-ray or UV emission alone may not be sufficient and spectroscopic observations are necessary for confirmation. However, in light of the recent work by Baraffe & Chabrier (2010), these stars may be much younger and possibly TWA members despite not having any Li absorption.
Lastly, 2 stars in our sample exhibit all the spectroscopic, photometric and kinematic characteristics of 10 Myr-old TWA members including low surface gravity, strong Li absorption, strong H emission and UVW velocities. These new members, TWA 31 (SpT=M4.2) and TWA 32 (SpT=M6.3), have photometric distance of 110 11 pc and 53 5 pc, respectively. Followup Keck/LGS AO observations resolved TWA 32 into two near equal-flux ( mag in K) stars with a separation of 656.1 0.4 mas. TWA 31 also exhibits an extremely accretion-broadened H profile (447 10 km s-1) with a slightly lower-than-average Li EW (0.41 0.05 Å), likely due to optical veiling (Duncan 1991), making it only the 6th known active accretor in TWA.
Our new GALEX/AIS search method successfully recovered 2/3 of the known TWA members (corresponding to the 2/3 of the sky covered in the GR4 data archive release), making it surprising that only 2 new mid-M members were discovered. With the peak of the spectral-type (and mass) function at SpT=M3–M4 (Bochanski et al. 2010 and references therein), the expected number of newly found M dwarfs is substantially greater than 3, likely closer to 20 (based on the known number of early-Ms in TWA). Our results imply that either TWA has an unexpected mass function, or a significant fraction of 10-Myr M dwarfs have depleted all their lithium and were eliminated from the membership list. This latter possibility would imply that low-g stars that are kinematically identical to TWA but lacking Li may indeed be bona fide members of the association.
References
- Alencar & Batalha (2002) Alencar, S. H. P., & Batalha, C. 2002, ApJ, 571, 378
- Baraffe & Chabrier (2010) Baraffe, I., & Chabrier, G. 2010, A&A, 521, A44+
- Baraffe et al. (1998) Baraffe, I., Chabrier, G., Allard, F., & Hauschildt, P. H. 1998, A&A, 337, 403
- Barrado Y Navascués (2006) Barrado Y Navascués, D. 2006, A&A, 459, 511
- Barrado y Navascués & Martín (2003) Barrado y Navascués, D., & Martín, E. L. 2003, AJ, 126, 2997
- Bitner et al. (2010) Bitner, M. A., Chen, C. H., Muzerolle, J., Weinberger, A. J., Pecaut, M., Mamajek, E. E., & Mclure, M. K. 2010, ApJ, 714, 1542
- Bochanski et al. (2010) Bochanski, J. J., Hawley, S. L., Covey, K. R., West, A. A., Reid, I. N., Golimowski, D. A., & Ivezić, Ž. 2010, AJ, 139, 2679
- Bonnefoy et al. (2009) Bonnefoy, M., et al. 2009, A&A, 506, 799
- Brandeker et al. (2003) Brandeker, A., Jayawardhana, R., & Najita, J. 2003, AJ, 126, 2009
- Chabrier et al. (1996) Chabrier, G., Baraffe, I., & Plez, B. 1996, ApJ, 459, L91+
- Cushing et al. (2005) Cushing, M. C., Rayner, J. T., & Vacca, W. D. 2005, ApJ, 623, 1115
- Cutri et al. (2003) Cutri, R. M., et al. 2003, 2MASS All Sky Catalog of point sources., ed. Cutri, R. M., Skrutskie, M. F., van Dyk, S., Beichman, C. A., Carpenter, J. M., Chester, T., Cambresy, L., Evans, T., Fowler, J., Gizis, J., Howard, E., Huchra, J., Jarrett, T., Kopan, E. L., Kirkpatrick, J. D., Light, R. M., Marsh, K. A., McCallon, H., Schneider, S., Stiening, R., Sykes, M., Weinberg, M., Wheaton, W. A., Wheelock, S., & Zacarias, N.
- de la Reza et al. (1989) de la Reza, R., Torres, C. A. O., Quast, G., Castilho, B. V., & Vieira, G. L. 1989, ApJ, 343, L61
- de Zeeuw et al. (1999) de Zeeuw, P. T., Hoogerwerf, R., de Bruijne, J. H. J., Brown, A. G. A., & Blaauw, A. 1999, AJ, 117, 354
- Duncan (1991) Duncan, D. K. 1991, ApJ, 373, 250
- Findeisen & Hillenbrand (2010) Findeisen, K., & Hillenbrand, L. 2010, AJ, 139, 1338
- Fitzpatrick (1993) Fitzpatrick, M. J. 1993, in Astronomical Society of the Pacific Conference Series, Vol. 52, Astronomical Data Analysis Software and Systems II, ed. R. J. Hanisch, R. J. V. Brissenden, & J. Barnes, 472–+
- Ghez et al. (2008) Ghez, A. M., et al. 2008, ApJ, 689, 1044
- Gizis (2002) Gizis, J. E. 2002, ApJ, 575, 484
- Gregorio-Hetem et al. (1992) Gregorio-Hetem, J., Lepine, J. R. D., Quast, G. R., Torres, C. A. O., & de La Reza, R. 1992, AJ, 103, 549
- Henize (1976) Henize, K. G. 1976, ApJS, 30, 491
- Ida & Lin (2008) Ida, S., & Lin, D. N. C. 2008, ApJ, 673, 487
- Jayawardhana et al. (2006) Jayawardhana, R., Coffey, J., Scholz, A., Brandeker, A., & van Kerkwijk, M. H. 2006, ApJ, 648, 1206
- Jeffries (1995) Jeffries, R. D. 1995, MNRAS, 273, 559
- Johnson & Soderblom (1987) Johnson, D. R. H., & Soderblom, D. R. 1987, AJ, 93, 864
- Kastner et al. (1997) Kastner, J. H., Zuckerman, B., Weintraub, D. A., & Forveille, T. 1997, Science, 277, 67
- Kelson (2003) Kelson, D. D. 2003, PASP, 115, 688
- Kirkpatrick et al. (1991) Kirkpatrick, J. D., Henry, T. J., & McCarthy, Jr., D. W. 1991, ApJS, 77, 417
- Lasker et al. (2008) Lasker, B. M., et al. 2008, AJ, 136, 735
- Liu et al. (2008) Liu, M. C., Dupuy, T. J., & Ireland, M. J. 2008, ApJ, 689, 436
- Looper et al. (2010a) Looper, D. L., Bochanski, J. J., Burgasser, A. J., Mohanty, S., Mamajek, E. E., Faherty, J. K., West, A. A., & Pitts, M. A. 2010a, AJ, 140, 1486
- Looper et al. (2007) Looper, D. L., Burgasser, A. J., Kirkpatrick, J. D., & Swift, B. J. 2007, ApJ, 669, L97
- Looper et al. (2010b) Looper, D. L., et al. 2010b, ApJ, 714, 45
- Lyo et al. (2004) Lyo, A.-R., Lawson, W. A., & Bessell, M. S. 2004, MNRAS, 355, 363
- Mamajek (2005) Mamajek, E. E. 2005, ApJ, 634, 1385
- Mamajek et al. (2002) Mamajek, E. E., Meyer, M. R., & Liebert, J. 2002, AJ, 124, 1670
- Mandell et al. (2007) Mandell, A. M., Raymond, S. N., & Sigurdsson, S. 2007, ApJ, 660, 823
- Marcy et al. (1987) Marcy, G. W., Lindsay, V., & Wilson, K. 1987, PASP, 99, 490
- Marshall et al. (2008) Marshall, J. L., et al. 2008, in Society of Photo-Optical Instrumentation Engineers (SPIE) Conference Series, Vol. 7014, Society of Photo-Optical Instrumentation Engineers (SPIE) Conference Series
- Martin et al. (2005) Martin, D. C., et al. 2005, ApJ, 619, L1
- Mentuch et al. (2008) Mentuch, E., Brandeker, A., van Kerkwijk, M. H., Jayawardhana, R., & Hauschildt, P. H. 2008, ApJ, 689, 1127
- Mohanty et al. (2005) Mohanty, S., Jayawardhana, R., & Basri, G. 2005, ApJ, 626, 498
- Morrissey et al. (2005) Morrissey, P., et al. 2005, ApJ, 619, L7
- Muzerolle et al. (2000a) Muzerolle, J., Briceño, C., Calvet, N., Hartmann, L., Hillenbrand, L., & Gullbring, E. 2000a, ApJ, 545, L141
- Muzerolle et al. (2000b) Muzerolle, J., Calvet, N., Briceño, C., Hartmann, L., & Hillenbrand, L. 2000b, ApJ, 535, L47
- Muzerolle et al. (2001) Muzerolle, J., Hillenbrand, L., Calvet, N., Hartmann, L., & Briceño, C. 2001, in Astronomical Society of the Pacific Conference Series, Vol. 244, Young Stars Near Earth: Progress and Prospects, ed. R. Jayawardhana & T. Greene, 245–+
- Nidever et al. (2002) Nidever, D. L., Marcy, G. W., Butler, R. P., Fischer, D. A., & Vogt, S. S. 2002, ApJS, 141, 503
- Pagano (2009) Pagano, I. 2009, Ap&SS, 320, 115
- Preibisch & Feigelson (2005) Preibisch, T., & Feigelson, E. D. 2005, ApJS, 160, 390
- Preibisch & Mamajek (2008) Preibisch, T., & Mamajek, E. 2008, The Nearest OB Association: Scorpius-Centaurus (Sco OB2), ed. Reipurth, B., 235–+
- Reid et al. (2007) Reid, I. N., Cruz, K. L., & Allen, P. R. 2007, AJ, 133, 2825
- Reid et al. (1995) Reid, I. N., Hawley, S. L., & Gizis, J. E. 1995, AJ, 110, 1838
- Reid (2003) Reid, N. 2003, MNRAS, 342, 837
- Riaz et al. (2006) Riaz, B., Gizis, J. E., & Harvin, J. 2006, AJ, 132, 866
- Robinson et al. (2005) Robinson, R. D., et al. 2005, ApJ, 633, 447
- Rodriguez et al. (2010) Rodriguez, D. R., Bessell, M. S., Zuckerman, B., & Kastner, J. H. 2010, ArXiv e-prints
- Roeser et al. (2010) Roeser, S., Demleitner, M., & Schilbach, E. 2010, AJ, 139, 2440
- Rucinski & Krautter (1983) Rucinski, S. M., & Krautter, J. 1983, A&A, 121, 217
- Scholz et al. (2005) Scholz, R., McCaughrean, M. J., Zinnecker, H., & Lodieu, N. 2005, A&A, 430, L49
- Shkolnik et al. (2009) Shkolnik, E., Liu, M. C., & Reid, I. N. 2009, ApJ, 699, 649
- Shkolnik et al. (2008) Shkolnik, E., Liu, M. C., Reid, I. N., Hebb, L., Cameron, A. C., Torres, C. A., & Wilson, D. M. 2008, ApJ, 682, 1248
- Shkolnik et al. (2010) Shkolnik, E. L., Hebb, L., Liu, M. C., Reid, I. N., & Cameron, A. C. 2010, ApJ, 716, 1522
- Silvestri et al. (2007) Silvestri, N. M., et al. 2007, AJ, 134, 741
- Simons & Tokunaga (2002) Simons, D. A., & Tokunaga, A. 2002, PASP, 114, 169
- Slesnick et al. (2006) Slesnick, C. L., Carpenter, J. M., & Hillenbrand, L. A. 2006, AJ, 131, 3016
- Slesnick et al. (2008) Slesnick, C. L., Hillenbrand, L. A., & Carpenter, J. M. 2008, ApJ, 688, 377
- Song et al. (2003) Song, I., Zuckerman, B., & Bessell, M. S. 2003, ApJ, 599, 342
- Sterzik et al. (1999) Sterzik, M. F., Alcalá, J. M., Covino, E., & Petr, M. G. 1999, A&A, 346, L41
- Tokunaga et al. (2002) Tokunaga, A. T., Simons, D. A., & Vacca, W. D. 2002, PASP, 114, 180
- Torres et al. (2006) Torres, C. A. O., Quast, G. R., da Silva, L., de La Reza, R., Melo, C. H. F., & Sterzik, M. 2006, A&A, 460, 695
- Torres et al. (2008) Torres, C. A. O., Quast, G. R., Melo, C. H. F., & Sterzik, M. F. 2008, Young Nearby Loose Associations (Handbook of Star Forming Regions, Volume II: The Southern Sky ASP Monograph Publications, Vol. 5. Edited by Bo Reipurth, p.757), 757–+
- Torres et al. (2003) Torres, G., Guenther, E. W., Marschall, L. A., Neuhäuser, R., Latham, D. W., & Stefanik, R. P. 2003, AJ, 125, 825
- van Dam et al. (2006) van Dam, M. A., et al. 2006, PASP, 118, 310
- Voges et al. (1999) Voges, W., et al. 1999, A&A, 349, 389
- Webb et al. (1999) Webb, R. A., Zuckerman, B., Platais, I., Patience, J., White, R. J., Schwartz, M. J., & McCarthy, C. 1999, ApJ, 512, L63
- Weinberger et al. (2011) Weinberger, A. J., Anglada-Escudé, G., & Boss, A. 2011, in Bulletin of the American Astronomical Society, Vol. 44, , XX
- Welsh et al. (2007) Welsh, B. Y., et al. 2007, ApJS, 173, 673
- Wenger et al. (2007) Wenger, M., et al. 2007, in Astronomical Society of the Pacific Conference Series, Vol. 377, Library and Information Services in Astronomy V, ed. S. Ricketts, C. Birdie, & E. Isaksson, 197–+
- West et al. (2008) West, A. A., Hawley, S. L., Bochanski, J. J., Covey, K. R., Reid, I. N., Dhital, S., Hilton, E. J., & Masuda, M. 2008, AJ, 135, 785
- White & Basri (2003) White, R. J., & Basri, G. 2003, ApJ, 582, 1109
- Wilking et al. (2005) Wilking, B. A., Meyer, M. R., Robinson, J. G., & Greene, T. P. 2005, AJ, 130, 1733
- Wizinowich et al. (2006) Wizinowich, P. L., et al. 2006, PASP, 118, 297
- Yee & Jensen (2010) Yee, J. C., & Jensen, E. L. N. 2010, ApJ, 711, 303
- Zacharias et al. (2010) Zacharias, N., et al. 2010, AJ, 139, 2184
- Zacharias et al. (2005) Zacharias, N., Monet, D. G., Levine, S. E., Urban, S. E., Gaume, R., & Wycoff, G. L. 2005, VizieR Online Data Catalog, 1297, 0
- Zuckerman & Song (2004) Zuckerman, B., & Song, I. 2004, ARA&A, 42, 685
| RA & DEC | log aaNote that is calculated using the full width of the 2MASS J band filter, 0.3 µm. | log aaNote that is calculated using the full width of the 2MASS J band filter, 0.3 µm. | H | Note | ||||||
|---|---|---|---|---|---|---|---|---|---|---|
| 2MASS | deg | deg | GSC2.3 | 2MASS | emission? | |||||
| 10 06 24.73 -30 14 43.98 | 265.489 | 20.388 | 14.59 | 10.593 | 0.537 | 0.275 | -3.80 | -4.08 | no | |
| 10 13 21.43 -35 42 36.93 | 270.235 | 16.942 | 17.38 | 13.510 | 0.575 | 0.307 | -1.33 | -1.31 | yes | |
| 10 30 54.53 -40 11 27.58 | 275.832 | 15.176 | 11.97 | 7.622 | 0.941 | 0.287 | -3.76 | -3.81 | no | |
| 10 37 10.47 -35 05 01.52 | 274.116 | 20.167 | 14.69 | 10.803 | 0.555 | 0.310 | -3.29 | -3.69 | yes | |
| 10 39 52.76 -35 34 03.03 | 274.886 | 20.040 | 11.67 | 9.038 | 0.582 | 0.160 | -3.58 | -4.14 | yes | VB, ROSAT source |
| 11 02 53.73 -31 45 10.57 | 277.441 | 25.691 | 17.61 | 13.687 | 0.493 | 0.301 | -1.81 | -2.51 | yes | |
| 11 06 02.46 -31 05 08.38 | 277.778 | 26.590 | 18.39 | 13.710 | 0.482 | 0.327 | -0.53 | -2.46 | no | |
| 11 11 46.37 -39 37 34.78 | 282.820 | 19.321 | 18.17 | 13.799 | 0.711 | 0.268 | -1.53 | -1.76 | yes | |
| 11 11 52.67 -44 01 53.87 | 284.642 | 15.294 | 15.50 | 11.223 | 0.593 | 0.269 | -2.87 | -3.39 | yes | |
| 11 18 12.37 -32 35 59.09 | 281.095 | 26.304 | 18.79 | 14.075 | 0.584 | 0.313 | -2.93 | -3.01 | yes | |
| 11 30 53.55 -46 28 25.19 | 288.778 | 14.173 | 14.84 | 11.286 | 0.522 | 0.283 | -3.05 | -3.38 | yes | |
| 11 31 14.83 -48 26 27.98 | 289.463 | 12.329 | 13.14 | 9.605 | 0.617 | 0.256 | -3.25 | -3.85 | yes | LCC member |
| 11 34 56.51 -36 40 28.09 | 286.257 | 23.716 | 19.18 | 14.262 | 0.595 | 0.395 | -1.35 | -1.23 | no | |
| 11 34 58.90 -34 43 11.59 | 285.575 | 25.563 | 15.67 | 11.921 | 0.534 | 0.264 | -3.00 | -3.00 | no | |
| 11 39 08.06 -45 32 39.81 | 289.896 | 15.501 | 16.15 | 12.313 | 0.584 | 0.261 | -1.50 | -2.87 | no | |
| 11 45 50.03 -33 02 13.32 | 287.404 | 27.849 | 12.55 | 9.356 | 0.193 | 0.068 | -1.53 | -3.62 | no | CD-32 8299 |
| 11 48 08.96 -37 58 09.45 | 289.406 | 23.236 | 18.57 | 14.213 | 0.621 | 0.345 | -2.13 | -1.93 | no | |
| 12 00 27.51 -34 05 37.17 | 291.035 | 27.598 | 13.35 | 8.723 | 0.622 | 0.261 | -3.86 | -4.64 | no | |
| 12 03 08.07 -38 26 55.54 | 292.643 | 23.465 | 11.66 | 8.565 | 0.594 | 0.271 | -3.77 | -4.54 | yes | ROSAT source 32″away |
| 12 07 10.89 -32 30 53.72 | 292.208 | 29.457 | 16.56 | 12.115 | 0.558 | 0.375 | -2.89 | -2.81 | yes | TWA 31 |
| 12 19 07.68 -41 01 57.81 | 296.393 | 21.441 | 16.93 | 13.012 | 0.566 | 0.303 | -1.74 | -2.42 | yes | |
| 12 19 29.82 -34 14 24.54 | 295.447 | 28.178 | 19.07 | 14.347 | 0.711 | 0.331 | -1.69 | -2.15 | no | |
| 12 20 25.78 -43 04 06.97 | 296.934 | 19.442 | 17.97 | 13.719 | 0.589 | 0.367 | -1.99 | -2.12 | no | |
| 12 21 33.27 -41 40 29.12 | 296.968 | 20.865 | 17.97 | 13.866 | 0.706 | 0.261 | -1.43 | -1.35 | no | |
| 12 24 08.36 -31 34 27.48 | 296.156 | 30.940 | 18.11 | 13.850 | 0.624 | 0.250 | -2.57 | -2.50 | no | |
| 12 26 43.75 -41 47 37.31 | 298.004 | 20.856 | 12.54 | 9.082 | 0.817 | 0.267 | -1.55 | -3.63 | no | |
| 12 26 51.35 -33 16 12.47 | 297.040 | 29.320 | 14.92 | 9.783 | 0.569 | 0.339 | -3.38 | -3.32 | yes | TWA 32 |
| 12 33 43.57 -32 51 26.29 | 298.636 | 29.877 | 16.95 | 12.149 | 0.556 | 0.317 | -2.62 | -2.41 | yes | |
| 12 45 43.60 -37 04 36.24 | 301.673 | 25.790 | 18.85 | 13.649 | 0.556 | 0.398 | -2.14 | -2.40 | yes | |
| 12 56 49.64 -30 07 37.37 | 304.317 | 32.730 | 16.95 | 12.883 | 0.655 | 0.294 | -2.60 | -2.82 | no |
| Name | log | log | SpT | CaH-narr. | K I EW | Li EW | H EW | Binarity |
|---|---|---|---|---|---|---|---|---|
| M– | Index | Å | Å | Å | ||||
| () | () | () | () | () | ||||
| TWA 2AB | -3.87 | -4.62 | 1.5 | 1.21 | 0.69 | 0.52 | -1.72 | VB (Brandeker et al., 2003) |
| TWA 3Aab | -3.194aaGALEX cannot resolve TWA 3A and 3B. | -3.64 | 3.9 | 1.31 | 0.87 | 0.51 | -40.89 | VB, SB2 (Muzerolle et al., 2000a) |
| TWA 3B | -3.194aaGALEX cannot resolve TWA 3A and 3B. | -3.64 | 3.9 | 1.30 | 0.85 | 0.54 | -4.26 | VB |
| TWA 5Aab | -3.57 | -4.19 | 1.9 | 1.33 | 0.90 | 0.63 | -6.37 | VB, SB2 (Torres et al., 2006) |
| TWA 7 | not observed | 2.4 | 1.28 | 0.81 | 0.55 | -5.39 | ||
| TWA 8A | -3.61 | -4.36 | 2.4 | 1.37 | 0.89 | 0.55 | -5.04 | VB |
| TWA 8B | -3.72 | – | 5bbThe TiO index gave SpT=M3, but we list the published SpT from Torres et al. (2003). | 1.29 | 0.85 | 0.58 | -6.21 | VB |
| TWA 10 | -3.87 | -4.50 | 2.6 | 1.36 | 0.89 | 0.50 | -5.46 | |
| TWA 12 | -3.72 | -4.39 | 1.6 | 1.21 | 0.83 | 0.53 | -5.10 | |
| TWA 14ab | -2.90 | -3.42 | 0.6 | 1.21 | 0.84 | 0.59 | -5.68 | SB2 (Jayawardhana et al., 2006) |
| TWA 15B | not observed | 2.2 | 1.38 | 1.06 | 0.55 | -9.64 | VB | |
| TWA 16 | -3.81 | -4.18 | 1.8 | 1.32 | 0.78 | 0.38 | -3.08 | |
| TWA 22AB | not observed | 6.5 | 1.52 | 1.69 | 0.65 | -10.48 | VB (Bonnefoy et al., 2009) | |
| TWA 23ab | -4.05 | -4.65 | 2.9ccBoth components of TWA 23 have SpT=M3. | 1.29 | 0.70 | 0.50 | 8.12 | SB2 (this work) |
| Name | RA & DEC | pmRAaaProper motions are from the NOMAD catalog (Zacharias et al., 2005). | pmDec | Dist.bbPhotometric distances are calculated using the Baraffe et al. (1998) models with an age of 10 Myr, from Mentuch et al. (2008) and taking into account binarity assuming equal flux components. Uncertainties are 10%. Distances agree within error bars with the predicted values from Mamajek (2005) and E. E. Mamajek (private communication), except TWA 15B which is predicted to be at 41 6 pc, respectively. | RV | U | V | W |
|---|---|---|---|---|---|---|---|---|
| deg. | mas yr-1 | mas yr-1 | pc | km s-1 | km s-1 | km s-1 | km s-1 | |
| TWA 2AB | 167.31 -30.03 | -95.5 2.9 | -23.5 2.8 | 48 | 10.58 0.51 | -14.9 1.7 | -18.2 1.1 | -7.7 1.4 |
| TWA 3Aab | 167.62 -37.53 | -100 7 | -14 11 | 31 | 9.52 0.86 | -10.0 1.7 | -14.0 1.1 | -3.9 1.6 |
| TWA 3B | 167.62 -37.53 | -100 7 | -14 11 | 31 | 9.89 0.62 | -9.9 1.6 | -14.4 0.9 | -3.8 1.6 |
| TWA 5Aab | 172.98 -34.61 | -85.3 3.6 | -23.3 3.7 | 38 | 13.30 2.00 | -8.5 1.4 | -18.7 1.9 | -2.5 1.3 |
| TWA 7 | 160.63 -33.67 | -122.2 2.2 | -29.3 2.2 | 34 | 12.21 0.24 | -13.2 1.5 | -17.7 0.7 | -8.5 1.4 |
| TWA 8A | 173.17 -26.87 | -90 2 | -20 15 | 44 | 8.34 0.48 | -13.1 2.1 | -15.8 1.6 | -4.4 2.6 |
| TWA 8B | 173.17 -26.87 | -86 3 | -22 38 | 27 | 8.93 0.27 | -6.8 2.4 | -12.7 2.1 | -0.7 3.9 |
| TWA 10 | 188.77 -41.61 | -78 23 | -32 8 | 67 | 6.75 0.40 | -15.7 6.6 | -21.1 4.2 | -8.6 2.7 |
| TWA 12 | 170.27 -38.75 | -60 14 | -12 25 | 63 | 13.12 1.59 | -11.0 5.1 | -19.1 2.8 | -4.6 6.7 |
| TWA 14ab | 168.36 -45.40 | -43.3 2.6 | -7 2.4 | 113 | 15.83 2.00 | -14.4 2.3 | -23.0 2.1 | -8.1 1.8 |
| TWA 15B | 188.59 -48.26 | – | – | 100 | 10.03 1.66 | – | – | – |
| TWA 16 | 188.73 -45.64 | -53.2 5.2 | -19 5.2 | 65 | 9.01 0.42 | -8.5 1.9 | -17.2 1.4 | -4.0 1.7 |
| TWA 22AB | 154.36 -53.91 | -174.8 9 | -13.6 9 | 20 | 13.57 0.26 | -10.1 1.5 | -16.3 0.4 | -9.7 1.3 |
| TWA 23ab | 181.86 -32.78 | -44 7 | -12 3 | 61 | 8.52 1.20 | -7.0 2.1 | -14.0 1.6 | -1.0 1.1 |
| RA & DEC | SpT | CaH-narrow | K I EW | Li EW | H EW | H 10% width | Youth | Agebb Lower limits on the stellar ages for early M dwarfs are provided for those stars with no lithium absorption (6708 Å) using the lithium depletion time scales calculated by Chabrier et al. (1996). However, it has been recently shown empirically, for at least the 12-Myr old Pic moving group, that lower ages limits of individual stars based on the the lack of lithium absorption systematically over-estimates the star’s age as compared to model isochrones (Yee & Jensen, 2010). This would imply that the lower age limits may be even lower, perhaps even as low as the accretion limit of 10 Myr. The upper age limit is set by the UV emission and/or low gravity using the evolution models of Baraffe et al. (1998). | Note |
|---|---|---|---|---|---|---|---|---|---|
| 2MASS | M– | Index | Å | Å | Å | km s-1 | IndexaaYouth index in binary format in order of least to most restrictive age indicator: low- from CaH, low- from K i, Li detection, accretion-level H emission. | Myr | |
| () | () | () | () | () | () | ||||
| 10 13 21.43 -35 42 36.93 | 2.4 | 1.38 | 2.38 | 0.1 | -26.3 | 270 | – | old | SB2, rapidly orbiting |
| 10 37 10.47 -35 05 01.52 | 3.2 | 1.40 | 1.49 | 0.1 | -6.1 | 108 | 1000 | 25 – 300 | |
| 10 39 52.76 -35 34 03.03 | 0.6 | 1.18 | 0.82 | 0.1 | -1.5 | 87 | 1100 | 20 – 110 | VB (N) |
| 10 39 52.76 -35 34 03.03 | 0.3 | 1.16 | 0.83 | 0.1 | -1.5 | 90 | 1100 | 20 – 110 | VB (S) |
| 11 02 53.73 -31 45 10.57 | 2.3 | 1.38 | 1.67 | 0.1 | -3.2 | 79 | 0000 | 20 – 300 | |
| 11 11 46.37 -39 37 34.78 | 2.2 | 1.52 | 1.09 | 0.1 | -12.4 | 124 | 1101 | 25 – 130 | SB2?ccThis star may be an unresolved SB2. See Section 6.2 for more details. |
| 11 11 52.67 -44 01 53.87 | 3.9 | 1.42 | 1.13 | 0.1 | -4.8 | 91 | 1100 | 90 – 160 | |
| 11 18 12.37 -32 35 59.09 | 4.2 | 1.46 | 2.09 | 0.1 | -5.0 | 79 | 1000 | 90 – 300 | |
| 11 30 53.55 -46 28 25.19 | 2.4 | 1.37 | 1.31 | 0.1 | -1.1 | 77 | 1100 | 20 – 130 | |
| 11 31 14.83 -48 26 27.98 | 3.5 | 1.35 | 1.18 | 0.18 | -7.3 | 233 | 1111 | 15 | LCC member |
| 12 03 08.07 -38 26 55.54 | 0.7 | 1.30 | 0.61, 0.26 | 0.1 | -1.9 | 95, 73 | – | 300 | SB2 |
| 12 07 10.89 -32 30 53.72 | 4.2 | 1.35 | 1.35 | 0.41ddThe lower value of Li EW compared to other TWA members is likely due to veiling due to accretion (Duncan 1991). | -114.8 | 447 | 1111 | 10 | TWA 31 |
| 12 19 07.68 -41 01 57.81 | 2.9 | 1.35 | 1.46 | 0.1 | -3.3 | 72 | 1000 | 40 – 300 | |
| 12 26 51.35 -33 16 12.47 | 6.3 | 1.39 | 1.21 | 0.60 | -12.6 | 127 | 1111 | 10 | VB, TWA 32 |
| 12 33 43.57 -32 51 26.29 | 4.6 | 1.51 | 2.54 | 0.1 | -2.6 | 73 | 0000 | 180 – 300 | |
| 12 45 43.60 -37 04 36.24 | 5.5 | 1.66 | 3.07 | 0.1 | -4.1 | 144 | 0000 | 180 – 300 |
| RA & DEC | pmRA | pmDec | REFaaProper motion references: 1 = Zacharias et al. 2005, 2 = Zacharias et al. 2010, 3 = Roeser et al. 2010 | Dist.bbPhotometric distances take into account youth (using Baraffe et al. 1998) and binarity assuming equal flux components. Uncertainties are 20% for the non-TWA members and 10% for the TWA and LCC members. See text for more details. | RV | U | V | W | Note |
|---|---|---|---|---|---|---|---|---|---|
| 2MASS | mas yr-1 | mas yr-1 | pc | km s-1 | km s-1 | km s-1 | km s-1 | ||
| 10 13 21.43 -35 42 36.93 | 18 6 | -14 11 | 1 | 297 | – | – | – | – | SB2 |
| 10 37 10.47 -35 05 01.52 | -52.8 2.4 | 8.9 2.4 | 2 | 41 | 12.45 0.54 | -8.7 1.9 | -13.7 0.7 | 0.6 0.7 | |
| 10 39 52.76 -35 34 03.03 | -58.3 1.3 | 5.1 4.2 | 2 | 82 | 12.45 0.47 | -19.1 4.0 | -16.8 1.2 | -5.1 2.3 | VB (N) |
| 10 39 52.76 -35 34 03.03 | -58.3 1.3 | 5.1 4.2 | 2 | 82 | 12.82 0.21 | -19.1 4.0 | -17.1 1.1 | -5.0 2.3 | VB (S) |
| 11 02 53.73 -31 45 10.57 | 22 3 | 4 4 | 1 | 218 | 95.27 0.22 | 28.6 4.9 | -76.8 2.4 | 53.9 4.4 | |
| 11 11 46.37 -39 37 34.78 | -34 12 | 2 12 | 1 | 200 | -72.00 1.24 | -43.8 11.2 | 55.9 4.6 | -34.3 10.7 | SB2? |
| 11 11 52.67 -44 01 53.87 | -22 2 | -12 4 | 1 | 34 | 17.64 0.30 | 2.1 0.6 | -17.9 0.4 | 1.6 0.9 | |
| 11 18 12.37 -32 35 59.09 | -38 3 | 8 8 | 1 | 106 | -0.70 0.66 | -18.6 4.3 | -4.7 1.9 | -3.7 3.4 | |
| 11 30 53.55 -46 28 25.19 | -33.7 3.2 | 1.1 1.8 | 2 | 62 | 10.03 0.12 | -5.6 1.9 | -12.9 0.8 | -0.3 0.8 | |
| 11 31 14.83 -48 26 27.98 | -40.2 3.3 | -5.8 1.5 | 2 | 93 | 17.02 1.16 | -9.0 3.3 | -22.6 1.9 | -4.1 1.8 | LCC |
| 12 03 08.07 -38 26 55.54 | 106.6 1.8 | -18.3 1.1 | 2 | 45 | -49.64 1.00 | 3.6 4.3 | 51.2 2.0 | -19.0 0.5 | SB2 |
| 12 07 10.89 -32 30 53.72 | -42 6 | -36 3 | 1 | 110 | 10.47 0.41 | -8.8 3.2 | -25.5 2.5 | -14.6 3.4 | TWA 31 |
| 12 19 07.68 -41 01 57.81 | -74 20 | 34 4 | 1 | 101 | 6.44 0.11 | -32.6 10.9 | -18.2 5.3 | 12.9 3.0 | |
| 12 26 51.35 -33 16 12.47 | -62.2 3.5 | -24.7 3.9 | 2 | 53 | 7.15 0.26 | -8.6 1.4 | -15.7 1.1 | -3.4 1.1 | VB, TWA 32 |
| 12 33 43.57 -32 51 26.29 | -18.4 5.8 | 31.5 5.8 | 3 | 34 | 10.38 0.29 | 0.2 1.2 | -7.4 0.7 | 9.4 1.2 | |
| 12 45 43.60 -37 04 36.24 | 21.7 9.6 | -80.7 9.8 | 3 | 73 | -10.81 1.82 | 8.2 4.1 | 2.3 2.8 | -29.7 6.0 |