On the interplay between sedimentation and phase separation phenomena in two-dimensional colloidal fluids
Abstract
Colloidal particles that are confined to an interface effectively form a two-dimensional fluid. We examine the dynamics of such colloids when they are subject to a constant external force, which drives them in a particular direction over the surface. Such a situation occurs, for example, for colloidal particles that have settled to the bottom of their container, when the container is tilted at an angle, so that they ‘sediment’ to the lower edge of the surface. We focus in particular on the case when there are attractive forces between the colloids which causes them to phase separate into regions of high density and low density and we study the influence of this phase separation on the sedimentation process. We model the colloids as Brownian particles and use both Brownian dynamics computer simulations and dynamical density functional theory (DDFT) to obtain the time evolution of the ensemble average one-body density profiles of the colloids. We consider situations where the external potential varies only in one direction so that the ensemble average density profiles vary only in this direction. We solve the DDFT in one-dimension, by assuming that the density profile only varies in one direction. However, we also solve the DDFT in two-dimensions, allowing the fluid density profile to vary in both the - and -directions. We find that in certain situations the two-dimensional DDFT is clearly superior to its one-dimensional counterpart when compared with the simulations and we discuss this issue.
keywords:
colloids, sedimentation, phase transitions, dynamical density functional theory, Brownian dynamics1 Introduction
Whilst colloidal fluids are, of course, of interest because of their importance to industry and every-day-life – for example the blood in our arteries and veins is a complex colloidal suspension – well controlled model colloidal suspension are also studied in order to further our fundamental understanding of fluid behaviour in general. In contrast to atoms, colloids are often large enough that they can be observed under the microscope and so much important knowledge has been gleaned concerning the microscopic properties of liquids in general from studying colloidal suspensions. In fact, it has been found that much from the theory of simple liquids [1, 2] can be utilised for their description.
In recent years, the non-equilibrium properties of (colloidal) fluids on microscopic length and time scales has attracted considerable interest [1, 3]. Dynamical density functional theory (DDFT) [4, 5, 6, 7] presents a particularly promising approach for such study. DDFT provides a theory for the time evolution of Brownian particles with Langevin stochastic equations of motion and therefore colloidal models serve as the natural subject for the theory. Recent work in this direction includes studies of colloidal sedimentation such as that described in Ref. [8], in which DDFT was found to accurately describe the time evolution of the density profile of sedimenting colloids measured using confocal microscopy, down to the scale of the individual colloids. In this system, the effective interactions between the colloids are purely repulsive and well-modelled by the hard-sphere pair-potential and therefore the sole mechanism for the aggregation of the colloids at the bottom of the sample is the gravity driven sedimentation of the colloids. However, in suspensions where the effective interactions between the colloids includes attraction between the particles, the aggregation can also be driven by these attractions. Such attraction can be generated by the addition of non-adsorbing polymer to the solution, which results in attraction due to the so-called depletion mechanism [9, 10], and can lead to the suspension phase separating into a colloid rich ‘liquid’ phase and a colloid poor ‘gas’ phase. Such a system has, for example, been used to study how droplets of the colloidal liquid phase coalesce with the bulk of this phase that has already sedimented to the bottom of the container [11]. The benefit of studying this phenomenon in a colloidal fluid is that it occurs on length and time scales accessible to optical microscopy. The authors of Ref. [11] were able to study in detail the various stages of the drop coalescing with the bulk fluid.
There is also a great deal of interest in two-dimensional (2D) colloidal fluids. Such systems occur when the colloids become confined to an interface. This can be at a fluid interface, such as the air-water interface, where the colloids often become pinned to the interface by capillary forces [12, 13]. Alternatively, a 2D system may be obtained when the colloids settle under gravity to the bottom of their container. Once on the bottom, the colloids are still mobile and able to diffuse over the surface, but because the height above the interface that they are able to reach due to the thermal fluctuations is much less than the colloid diameter at common temperatures, they can effectively be considered to be a 2D fluid of particles constrained to move on the bottom surface of the container. The height , where is Boltzmann’s constant, is the temperature, is the buoyant mass of the colloids and is the acceleration due to gravity. In Refs. [14, 15] the authors studied the flow behaviour of such a 2D fluid down a narrow channel with a width of only a few times the diameter of the particles. In this set up, the colloids are ordered into layers within the channel and a reduction in the number of layers due to a density gradient along the channel was observed.


In this paper, we present results obtained for a model 2D system that is related to the system studied in Refs. [14, 15]. In Fig. 1 we display a sketch of our system. We consider cases where the colloids are initially uniformly dispersed over the surface, with a fairly low average surface coverage. However, due to the fact that there is a uniform external force on the colloids towards one side of the surface, they begin to ‘sediment’. In addition to this, there are attractive forces between the colloids in our system. As the colloids move over the surface, both due to the driving and also due to their Brownian motion, they come into contact with one another and due to the attractive interactions between the particles, they aggregate together. We study the interplay between these two effects on the time evolution of the density profile of the colloids using both Brownian Dynamics (BD) computer simulations and DDFT. We solve the DDFT in both one-dimension (i.e. assuming that the density profiles only varies in the -direction, which is the only direction in which the external potential varies) and we also solve the DDFT in 2D, allowing the fluid density profiles to vary in both the - and -directions. Perhaps the most striking result in this paper is that we find that in certain situations the results from solving the DDFT in 2D and then subsequently averaging over the -direction agree much better than the 1D DDFT results with what we find from the BD simulations.
This paper is structured out as follows: In Sec. 2 we describe our model system and give the governing stochastic equations of motion for the particles. In Sec. 3 we present BD simulation results showing the typical behaviour of the system. Then, in Sec. 4 we present our theory for the system and give a brief discussion of the equilibrium properties predicted by the theory. In Sec. 5 we present our DDFT results and make comparison with our BD simulation results. Finally, in Sec. 6 we make a number of concluding remarks.
2 Model System
We model the colloids by assuming that they interact via the following pair potential:
| (1) |
where is the distance between the centres of the particles. The hard-disk pair potential is given by
| (2) |
and the attractive contribution to the pair-potential is modelled by the following simple form:
| (3) |
where is a parameter that determines the strength of the attraction and sets the range of the potential. For simplicity we set , the diameter of the hard-core of the particles. Note that at contact .
We model the external potential acting on the colloids as follows:
| (4) |
where is the coordinate direction perpendicular to the hard parallel walls that are located at and along the edge of the surface on which the particles are located. The -axis is also parallel to the uniform external potential , where , for the set-up pictured in Fig. 1.
We consider a system of particles and we denote the set of position coordinates of the particles . The potential energy of the system is given by
| (5) |
We assume that the dynamics of the colloids, with positions , is governed by the following set of over-damped stochastic equations of motion [3]:
| (6) |
where is a friction coefficient characterising the one-body drag of the solvent on the particles and is a stochastic white noise term [3, 4, 5, 6, 7]. Note that by modelling the equations of motion via Eq. (6) the hydrodynamic interactions between the colloids are neglected [3].
3 Brownian Dynamics Simulation Results


We have performed standard Brownian Dynamics computer simulations [16] of the time evolution of the particles in our system. This corresponds to numerically integrating Eqs. (6). To make this integration more straight-forward, we replace the discontinuous hard-disk potential (2) with the following continuous potential:
| (7) |
Choosing the amplitude , where is the inverse temperature, together with a large value for the exponent in , ensures that using this potential instead of the hard-disk-potential (2) leads to no change in the structure of the fluid.
We initiate our system with the non-overlapping particles randomly distributed over the surface, which corresponds to an equilibrium configuration for a system where there is no attraction between the particles () and the drive force amplitude , corresponding to the particles being on a flat horizontal surface.
In Fig. 2 we display snapshots from a simulation for the case when , , and there are particles in the system, corresponding to an average density . Note that when , this corresponds to a potential well depth . This amounts to a relatively strong attraction between the particles and over time it leads to the particles aggregating into clusters. We also see in Fig. 2 the influence of the external potential which causes the particles to sediment to the bottom. Due to the fact that there is no attraction between the particles and the wall, the ‘drops’ of the colloidal liquid phase do not spread over the lower wall, so that it remains ‘dry’. From the snapshots in Fig. 2 we infer that in this situation the contact angle is close to . Note however, that the contact angle decreases as the strength of the driving force due to the external potential is increased. When is increased to the value , then as can be observed from the BD simulation results displayed in Fig. 3, we find that the force on the particles towards the lower edge is strong enough to cause them to spread to form a uniform layer there. Thus, increasing the parameter , which corresponds to increasing the angle of the surface to the horizontal (c.f. Fig. 1), enhances the coalescence effect.
In Fig. 4 we display the fluid one-body density profiles , which are calculated by averaging the full 2D density profile over the -direction. These are obtained for the same parameters as for the results displayed in Fig. 2 by averaging over 40 different simulation runs, each with a different initial configuration and realisation of the random noise terms in Eq. (6). We see that the contact density at the lower wall, is much less than the density just above the wall, at around . This low contact density comes as a consequence of the fact that the amplitude of the driving force is small and also that there are no attractive forces between the particles and the wall and so the particles seek to gather to themselves away from the wall. The surface tension (excess free energy) between the wall and the liquid is therefore very similar in value to the liquid-gas surface tension between the colloidal liquid and colloidal gas phases. As a consequence of this and the fact that the surface tension between the vapour and the wall is low, the drops on the surface displayed in Fig. 2 have a high contact angle, as one would expect from Young’s equation.
4 Theory for the system
We use dynamical density functional theory [4, 5, 6, 7], in order to develop a theory to further understand the behaviour of our system. Since DDFT is based on equilibrium density functional theory (DFT) [17, 18, 1], which is a theory for the equilibrium one-body density profile of an inhomogeneous fluid, we start this section by introducing DFT and the approximation we use for the free energy functional. Once set, DFT also allows one to calculate thermodynamic quantities and phase behaviour for the system.
4.1 DFT
DFT shows that for a given external potential , there is a unique equilibrium one-body density profile which is obtained as the minimum of the following grand potential functional [17, 18, 1]:
| (8) |
where is the chemical potential and is the Helmholtz free energy functional. Minimization leads to the following Euler-Lagrange equation that may be solved for the equilibrium fluid density profile:
| (9) |
The Helmholtz free energy functional for a 2D fluid is:
| (10) |
The first term on the right hand side is the ideal-gas Helmholtz free energy; is the thermal de Broglie wavelength. is the excess Helmholtz free energy, which is the contribution to the free energy from the particle-particle interactions. This quantity is not known exactly, however, there are various well-trodden paths available in the literature for obtaining a good approximation for this quantity [17, 18, 1]. The final term in Eq. (10) is the contribution to the free energy due to the external potential.
For the work described in this paper, we approximate the Helmholtz free energy functional as follows:
| (11) | |||||
where is the Helmholtz free energy per unit area of a uniform fluid of hard-disks with bulk density . We use the scaled particle approximation [19],
| (12) |
which includes the exact ideal-gas contribution to the free energy and where is the packing fraction. The second term in Eq. (11) is a simple mean-field approximation for the contribution to the free energy from the attractive interactions between the particles. Note that the approximation for in Eq. (11) does not give reliable results for the fluid density profile when , or when the external potential due to the wall includes an attractive tail. In this case there are oscillations in the density profile near the wall, due to the effects from packing of the hard cores of the particles against the wall. This is an effect which Eq. (11) is completely unable to describe. However, for the present model fluid, the approximation in Eq. (11) is good, as long as is small (), and is sufficiently large (), owing to the fact that as is increased, the density of the particles in contact with the wall is low, as discussed above in the context of the results displayed in Figs. 2 and 4.

To further illustrate this point, in Fig. 5 we display the particle density profiles obtained using Eq. (11) for the case when the parameters in the external potential are and 111Note that in our DFT and DDFT calculations we replace the upper hard wall at in Eq. (4) by a softened purely repulsive form. This is done to improve the stability of our numerical algorithm for solving the DDFT. This, of course, has no effect on the behaviour of the system at the lower wall, which is the primary focus of our work described here.. In our calculations we have set the value of the chemical potential so that in all cases the average density in the system is . We display in Fig. 5 the density profile for the case when , which corresponds to a strong enough attraction between the particles for the system to exhibit liquid-gas phase separation and due to the external driving force towards the bottom, we find the high density liquid phase is pushed to the bottom of the system. However, the density near to contact with the wall (at small values of ) is low, which justifies our use of the local density approximation (LDA) for the hard-disk contribution to the free energy in Eq. (11). We also display in Fig. 5 the (exact) ideal-gas density profile and the density profile obtained using Eq. (11) when there is no attraction between the particles (i.e. pure hard-disks). We see that in this case the density profile near the wall is monotonic, whereas in reality we should expect to see oscillations due to packing near the wall [18].
From Fig. 5 we can also observe the influence of the nature of the particle interactions on the fluid density profiles: on comparing the ideal gas density profile with the pure hard-disk case, we see that the effect of the excluded area (hard-core) interactions between the particles is to push some of them further up into the system. However, the effect of adding attraction between the particles is to reverse this effect, so that when the particles are on average much closer to the bottom of the system. This effect, of course, is also due to the external potential () driving the particles to the bottom of the system.
4.2 On the nature of the density profiles
There is an important issue that we must raise at this point in our discussion: When a fluid is confined in an external potential such as that given in Eq. (4), that only varies in one direction (in this case the -direction), then we know that the fluid density profile will only vary in this direction. This is because is an ensemble average quantity, which means that even if particular configurations of the system are inhomogeneous in the -direction, such as in the configuration displayed in the final panel of Fig. 2 (which is an equilibrium configuration), the average over the full ensemble of possible configurations will not vary in the -direction. Thus, in calculating the density profiles displayed in Fig. 5, we have used this fact to reduce solving Eq. (9), to that of solving for a one-dimensional (1D) function . However, although formally does not vary in the -direction, as we show below, when one uses an approximate free energy functional, such as that in Eq. (11), one can in fact obtain density profiles that vary in both the - and in the -directions. We will further discuss this issue below.
4.3 Bulk phase diagram

From our DFT (11) we are able to calculate the bulk (uniform) fluid phase diagram for our system, by setting the density in Eq. (11) to be a constant , which gives the bulk fluid Helmholtz free energy. From this the phase diagram may be calculated in the usual way [20]. The resulting phase diagram is displayed in Fig. 6. We see that as the temperature is decreased or, equivalently, as is increased, the theory predicts that the system exhibits phase coexistence between a low density suspension and a high density suspension of particles (i.e. gas-liquid phase coexistence). The pairs of coexisting state points define the locus of the binodal. The line in the phase diagram along which the compressibility is predicted to be zero defines the spinodal. Inside this curve the DDFT (see Eq. (15) below) predicts that the uniform fluid is linearly unstable. Note that our simple theory is not able to predict the transition to either the hexatic phase nor the solid phase, that we expect to find at higher densities. Note also that the phase diagram in Fig. 6 is only qualitatively correct in describing the gas-liquid phase separation. For example, when , corresponding to the results displayed in Figs. 2 and 4, we find that the density of the liquid at coexistence is . However, from Fig. 6 we see that we must select (i.e. ) in order for the density of the liquid at coexistence to equal this value. As a consequence of this, we find below in Sec. 5 better agreement between the DDFT results for with the BD simulation results for , than we do for the simulation results for .
4.4 DDFT
DDFT [4, 5, 6, 7] was developed to describe the dynamics of the one-body density of a fluid of Brownian particles with equations of motion given by Eq. (6). The Smoluchowski equation [3, 6]:
| (13) |
governs the time evolution of the -particle probability density for systems with dynamics governed by Eq. (6). The one-body density is obtained by integrating over this function, as follows:
| (14) |
This non-equilibrium density profile represents an ensemble average over all realisations of the stochastic noise [7]. On integrating the Smoluchowski equation (13) we obtain the central equation of DDFT [4, 5, 6, 7]:
| (15) |
Note that this depends on the equilibrium Helmholtz free energy functional , given in Eq. (10). In order to derive Eq. (15), we have made the approximation that equal-time two-body correlations at time in the non-equilibrium fluid are the same as those of an equilibrium fluid with the same one-body density profile [4, 5, 6]. As we see below, this closure approximation is good for the situation of interest here. Other situations where DDFT (15) has proved to be reliable are discussed in Refs. [4, 21, 22, 23, 24, 25, 26, 8, 27, 28]. We should emphasise that in addition to the closure approximation used in deriving the DDFT (15), there is the additional approximation that one must make in selecting a suitable approximation for the Helmholtz free energy functional . The approximation that we use here is that in Eq. (11).


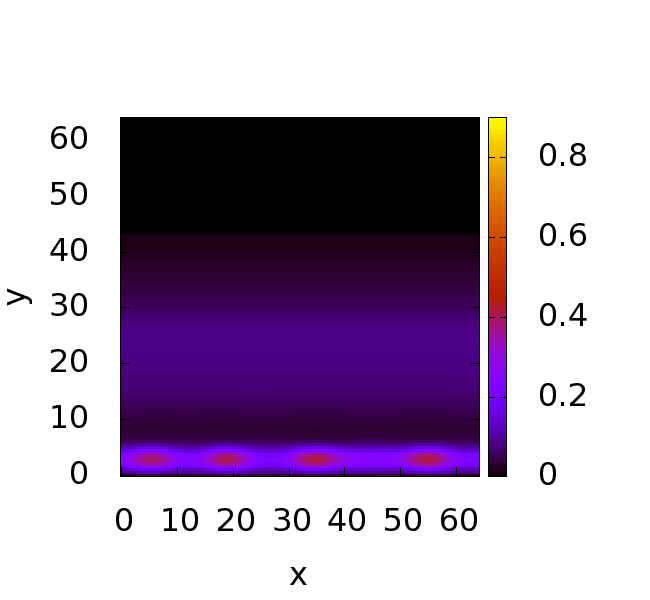
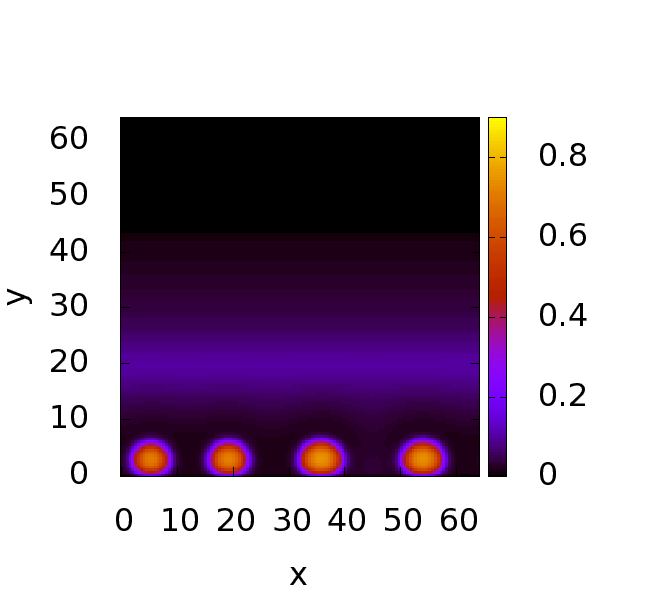
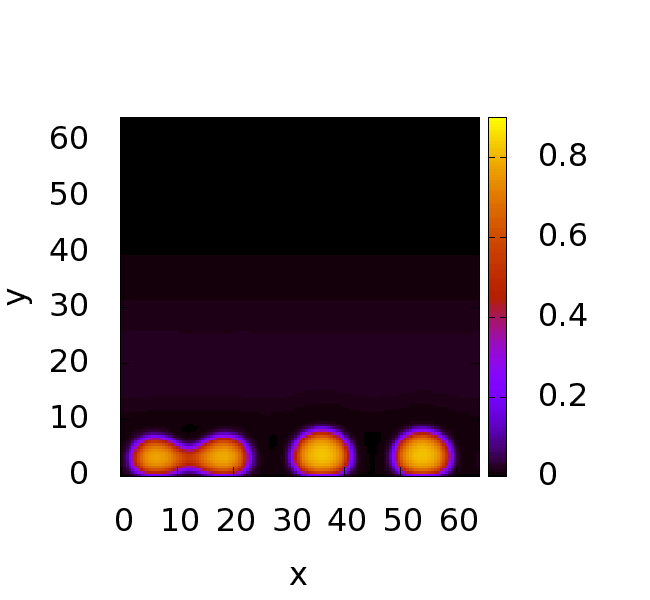
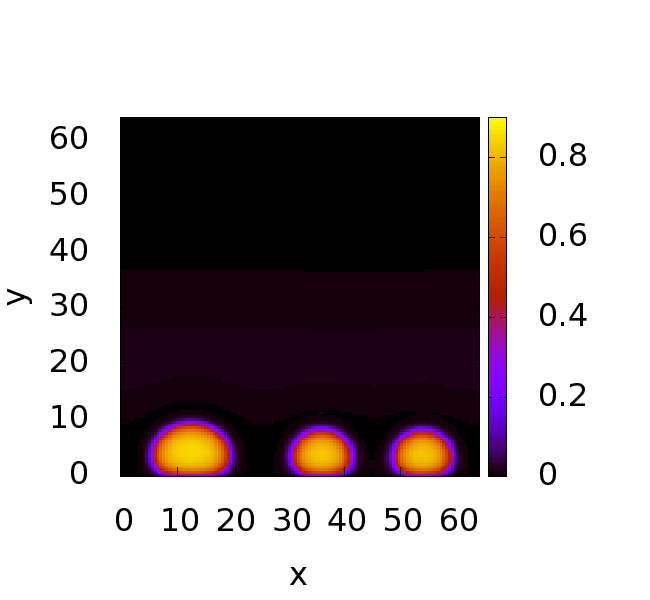


We solve the DDFT by discretizing the equations on a cartesian grid, with grid spacing , and we set the initial time density profile to be that of the ideal-gas in the equilibrium situation when the drive in the external potential (i.e. , for ), which has added to it a small random number at each grid point. This random number is drawn from a uniform distribution between , where is the average fluid density in the system. The results do not depend on the amplitude of this noise. The random noise is added to the initial time density profile in order to break the symmetry of the profile which subsequently in some situations allows the system to develop density profiles that vary in both the - and in the -directions, when the DDFT is solved in 2D. Note that the density profiles from the DDFT do not vary in the -direction in all situations; they only vary in this direction in certain specific situations – see below.
One can also assume that the density profiles only vary in the -direction (which is strictly true, since the external potential only varies in the -direction) and use this fact to reduce solving Eq. (15), to that of solving for a one-dimensional (1D) time series of density profiles . Below, we compare results from doing this, to the results obtained from the full 2D solution to the DDFT.
5 Results
All the results displayed in this section are for the case when the parameters in the external potential (4) take the values and . In Fig. 7 we display results for the case when there are 200 particles in the system, which corresponds to an average density , and when . This level of attraction between the particles is not strong enough for the system to exhibit liquid-gas phase separation as can be inferred from Fig. 6. The system takes a time to reach equilibrium, where , and where is the Brownian time scale, which is the time it takes for a particle to diffuse a distance of order its own diameter. Since the amplitude of the driving force is rather small, we see that the density near the top of the system is not insignificant. This also comes as a result of the attraction between the particles being quite weak. We see that the agreement between the BD simulation results and the DDFT results is fairly good. Note that in this situation, the DDFT produces exactly the same result whether it is solved in 1D or in 2D. This is in contrast to the results which we display below for cases where is sufficiently large for phase separation to be observed.
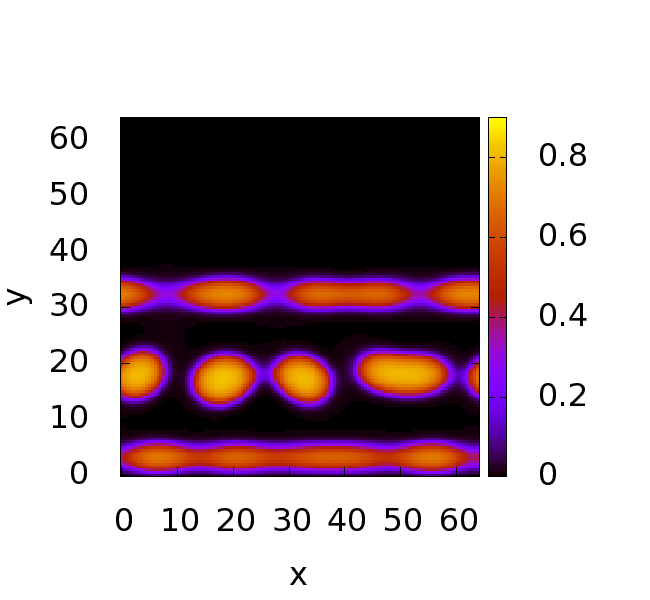
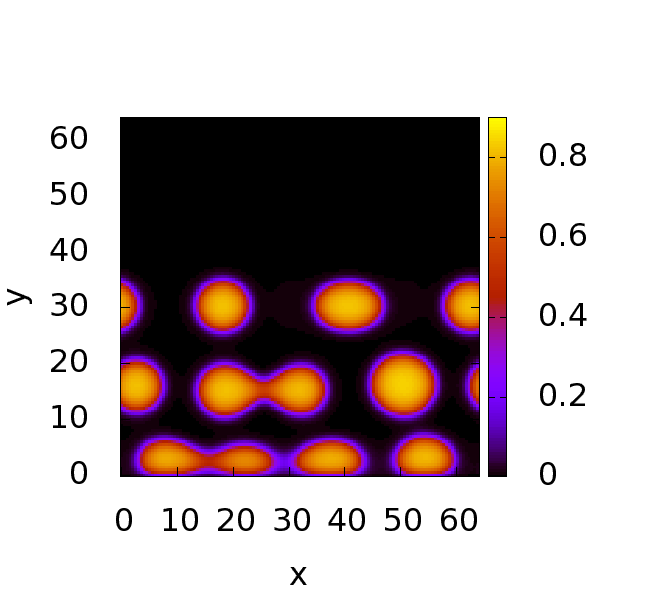
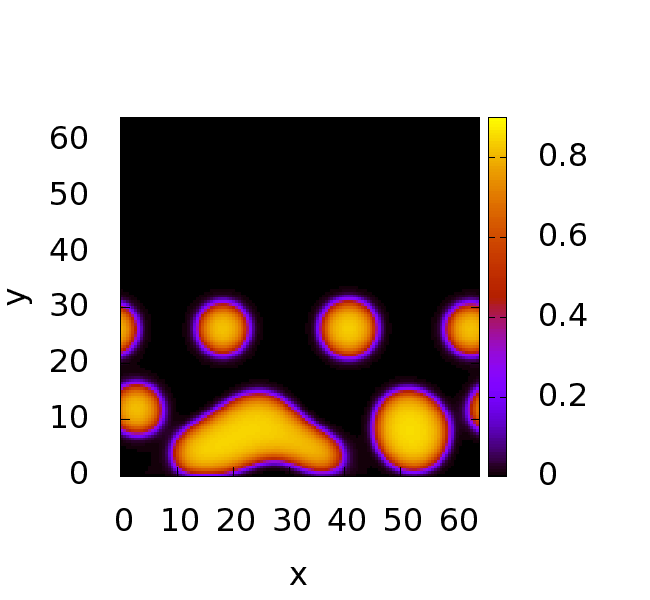
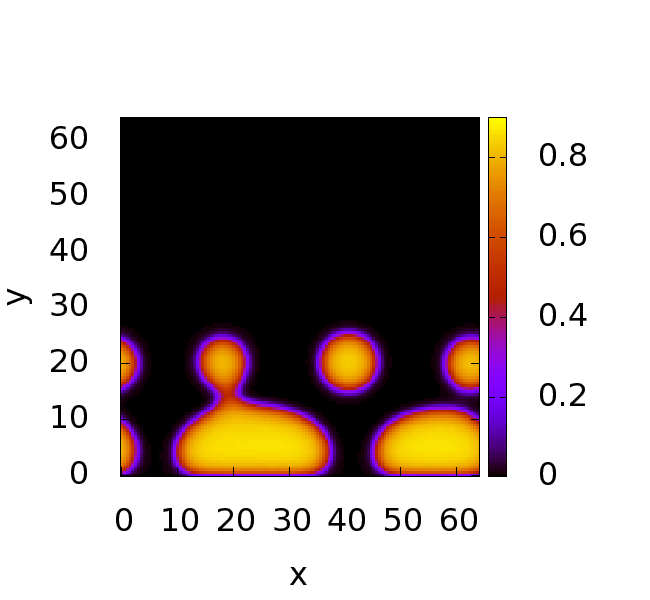
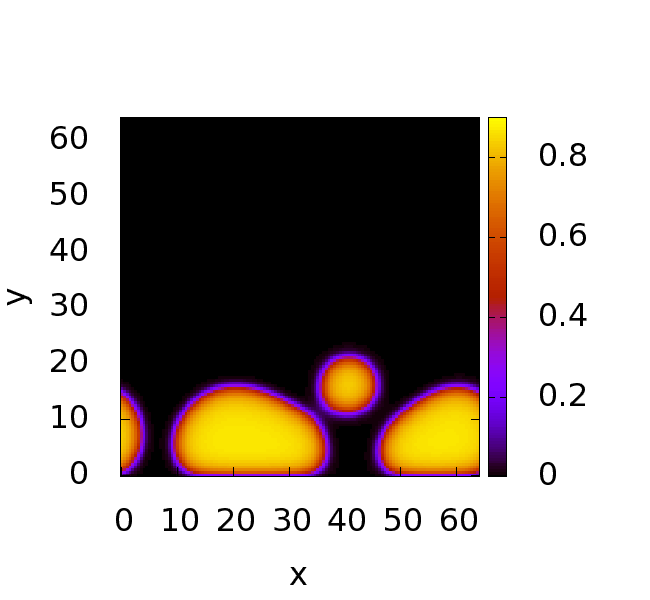
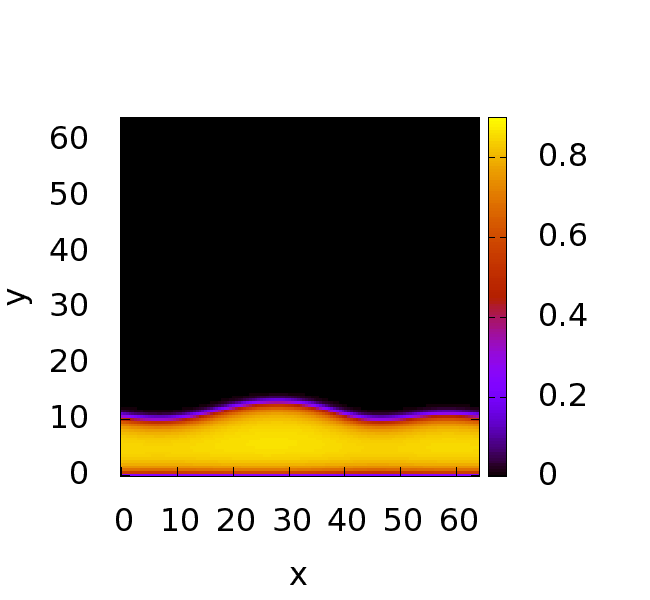
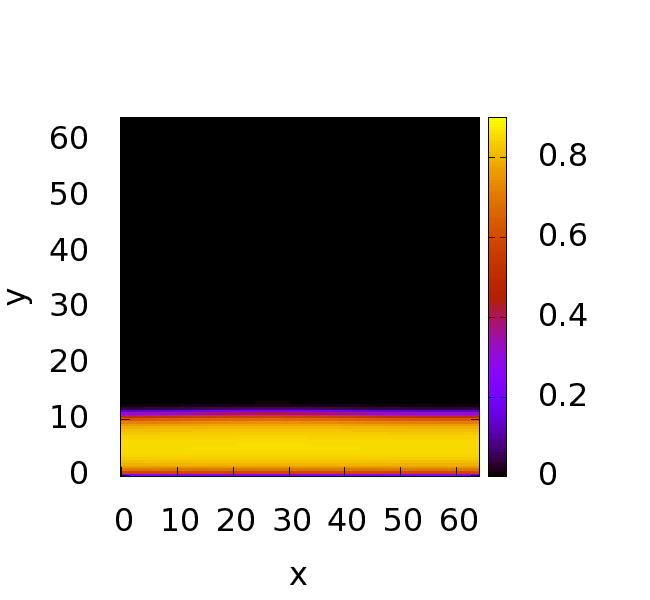
In Fig. 8 we display density profiles obtained from the 2D DDFT for the case when and at various times during the sedimentation process. These results should be compared with the BD simulation results (which are for ) displayed in Figs. 2 and 4. We see that the theory predicts that the system prefers to form a number of droplets, rather than form a layer of uniform thickness along the bottom. Strictly speaking, since is an ensemble average quantity and since the external potential only varies in the -direction, these profiles should also only vary in the -direction. It is rather striking, however, that the resulting density profiles in-fact resemble more closely what we observe in the simulation snapshots in Fig. 2.
We also calculate the density profiles in this situation using the 1D DDFT. We display these results in Fig. 9, together with the results from the 2D DDFT that have subsequently been averaged over the -direction to produce a 1D density profile. Initially, for there is no difference between the results from these two approaches. However, for latter times, when the 2D DDFT predicts that the system breaks up into a number of separate drops, the results from the two approaches are, of course, different. We also display in Fig. 9 the BD simulation results (c.f. Figs. 2 and 4), and remarkably the results from the 2D DDFT that are subsequently averaged over the -direction are in much better agreement with the BD simulation results then the 1D DDFT results. This suggests that the additional degree of freedom in the 2D DDFT helps to improve the theory, by ‘allowing’ it to better describe the density inhomogeneities that are present in the -direction.
In Fig. 10 we display density profiles obtained from the 2D DDFT for the case when and , at various times during the sedimentation process. The average density in this case is higher than in the case considered above in Fig. 8. We see that the initially uniform fluid breaks up into droplets of the liquid phase, due to the attraction between the particles. Due to the external potential, these droplets sediment to the bottom of the system and coalesce to form a single uniform layer along the bottom of the system. This is in contrast to the case in Fig. 8, and is due to the fact that in the case in Fig. 10 there are more particles in the system. This difference is best understood by considering the fact that as the density of the fluid is increased, the area of the surface that is covered by the two-dimensional liquid, which we denote , also increases. As discussed above in Sec. 3, the interfacial tension between the liquid and the surface is roughly equal to the interfacial tension between the liquid and the gas. Thus, as the number of particles (average density) in the system is increased, the ratio decreases, where is the length of the interface between the liquid and the gas plus the length of the interface between the liquid and the wall (i.e. it is the total length of the interface(s) around the 2D liquid). As the system seeks to minimise the free energy, it therefore seeks to minimise the contribution due to these interfaces . Thus, the final equilibrium configuration is essentially determined by minimising subject to the constraint that is fixed. When the ratio is large (low ), the system must form drops to minimise ; this is the case in Fig. 8. However, when is small (i.e. larger ), is minimised by the system forming a layer of uniform thickness along the bottom; this is the case in Fig. 10. Note, however, that this argument only applies in the limit when is small. As the amplitude of the external potential is increased, then the external potential energy contribution to the free energy overcomes the interfacial tension contribution and the particles are squeezed to the bottom of the system, as can be seen in Fig. 3. This argument should also apply to three-dimensional (3D) systems in a similar situation, as long as one instead considers the ratio , where is the surface area of the liquid and is its volume. In this case, the system will seek to minimise the free energy by balancing the interfacial contribution , against the external potential energy contribution.
6 Concluding remarks
We have shown that the behaviour during sedimentation of a 2D model colloidal suspension with attraction between the particles is rather rich due to the interplay between the aggregation stemming from the particle attractions and the sedimentation due to the external potential. We have used DDFT to describe the dynamics of the system, and as the results in Figs. 7 and 9 show, the theory is in quite good agreement with the simulation results. The agreement is particularly good when the colloids are undergoing pure sedimentation (Fig. 7). However, even for the case displayed in Fig. 9, where in addition to the sedimentation, the particles are also aggregating due to the strong attractions between them, we still observe good qualitative agreement between the DDFT and the simulations.
The results from our work raise a key question: why does the DDFT when it is solved in 2D, and then afterwards averaged over the -direction, give better agreement with the simulations than when the DDFT is solved in 1D? As discussed above in Sec. 4.2, solving equilibrium DFT is in principle equivalent to evaluating the partition function for the system, and therefore since our external potential varies in only the -direction, the density profile obtained by averaging over the ensemble of all configurations of the system, must also only vary in the -direction. This should at least be the case for the final equilibrium density profile obtained from the DDFT, since recall that the equilibrium solution of the DDFT is the solution of Eq. (9) – i.e. it is a minimum of the free energy [6] and is equivalent to solving equilibrium DFT. However, as can be seen in the final frame for in Fig. 9, this is not the case. The final frame of Fig. 9 shows that the results from the 2D calculation are in very good agreement with the simulation results, whereas the results from the 1D calculation do not agree with the simulation results.
When our DDFT (DFT) is solved in 2D, we believe the reason that it does not always give a density profile that only varies in the -direction, is due to the fact that we are not using the (unknown) exact free energy functional, but instead, we are using an approximation for this quantity – specifically that given in Eq. (11). This approximate free energy functional neglects some of the fluctuation contributions to the free energy. This manifestation has been known for many years now, in particular, in the context of using DFT to calculate the density profile for the free interface between a liquid and its vapour. It is known that DFT fails to include some of the interfacial fluctuations [17]. See also the more recent work in Refs. [29, 30, 31, 32, 33] and references therein. This issue has also been discussed in a very illuminating manner by Reguera and Reiss [34]. In Ref. [34] the behaviour of drops of a 3D liquid, with a fixed number of particles and confined within a spherical cavity were studied using both DFT and simulation. In terms of the physics involved, the situation studied in Ref. [34] is somewhat akin to the situation we study here, but with the external potential parameter in our model set to zero. Using an approximation for the Helmholtz free energy functional that is the 3D analogue of the functional in Eq. (11), the authors of Ref. [34] showed that the DFT is unable to describe the fluctuations corresponding to drop translations within the cavity and also fluctuations corresponding to variations in the number of particles in a liquid drop. By comparing their DFT results with Monte-Carlo simulation results for a system where the centre of mass is constrained to coincide with the centre of the cavity (i.e. so that the translational fluctuations are suppressed) they found better agreement between the DFT and the simulation results. In other words, the DFT describes well the density distribution within the drop(s) but it is unable to describe the translational fluctuations of the drop(s). This is also the conclusion that we draw on the basis of the results in Fig. 9 and leads us to surmise that when DFT is implemented together with an approximate free energy functional, such as that in Eq. (11), it leads to one obtaining an average over a subsection of phase space, rather than averaging over all of phase space.
In Ref. [34] the authors also discuss the relationship between DFT and field theory (FT). In FT, the central quantity is a Hamiltonian , which is a functional of the order-parameter , which may be interpreted as being a coarse-grained density profile (See Ref. [35] for a possible definition of this quantity). When solving the FT to obtain the order parameter profile which corresponds to the most probable configuration of the system, one is required to solve the following Euler-Lagrange equation [34]:
| (16) |
[c.f. Eq. (9)] where is the Lagrange-multiplier that originates from the constraint from fixing the total number of particles in the system, which mathematically plays the same role as the chemical potential. Now, of course, the functional is not known exactly and so one is required to make an approximation for this quantity based on physical insight and any other knowledge we have about the system of interest. In DFT, there is a similar process used to construct an approximation for the free energy functional [17, 18, 1]. The end result of these two processes can be very similar or even the same; i.e. one considers and to be the same quantity (strictly speaking, they are not the same, and , i.e. is a statistical average over all possible configurations of the coarse-grained density [7, 35]) and therefore one is tempted to make the same approximations in constructing as are made in constructing . See Ref. [35] for an example of a FT constructed along these lines.
With these arguments in mind, it is now clear why our 2D DDFT results agree better with the simulation results than the 1D DDFT results: Our approximation for the free energy (11) is unable to describe the translational fluctuations of drops in the system. However, by solving in 2D we obtain density profiles which correspond to particular likely configurations of the system. By subsequently averaging this density profile over the -direction, we are averaging over several droplet profiles, and so we get better agreement with the simulations than the 1D DDFT because we are averaging over more ‘typical’ configurations. In this respect, we are treating the DFT more like a FT. If we fully take the FT point of view, then the natural extension of our approach is to perform several different DDFT calculations for each situation, with each calculation having a different realisation of the random noise that we add to the initial density profile (see Sec. 4.4). One would then average over all of these different density profiles and presumably therefore average over more of phase space (i.e. averaging over more possible fluid configurations). We believe that doing this may give even better agreement with the simulation results than our present 2D DDFT results. We should add, however, that following this approach would be rather computationally expensive, particularly if one were investigating a 3D system – it may be quicker to just simulate the system.
We believe that if we used a more accurate DFT such as Rosenfeld’s fundamental measure theory [19] in our 2D DDFT calculations, we would still see the same ‘symmetry breaking’ (i.e. the theory would predict that the density profiles have variations in the -direction). Using this alternative approximation for the free energy functional would undoubtably improve the description of the fluid structure by doing a better job of describing the short range correlations between the particles. However, what is really required for the problem here is a DFT that includes and averages over the large scale density fluctuations; in particular those corresponding to modes such as a droplet of particles translating along the bottom of the system. Constructing such a DFT requires developing a theory which is capable of describing fluctuations on several different length scales, which is a notoriously difficult problem in physics.
A final point that we should emphasise is that in both our simulations and in our theory we have not included the hydrodynamic interactions that play an important role in the dynamics of real colloids [3]. It is possible to include these interactions between the particles within the DDFT approach [36, 37]. However, we leave this as future work.
Acknowledgements
It is a pleasure to dedicate this paper to Professor Bob Evans, whose contributions to liquid state theory are immense. He has inspired several generations of scientists in the field and it has been a privilege and a joy to have worked with him. We wish him all the best in the years to come.
AJA gratefully acknowledges financial support from RCUK and AM acknowledges financial support of the MSMT of the Czech Republic under Project No. LC512 and the GAAS of the Czech Republic (Grant No. IAA400720710).
References
- Hansen and McDonald [2006] J. P. Hansen and I. R. McDonald, Theory of Simple Liquids (Academic Press, London, 2006).
- Barrat and Hansen [2003] J.-L. Barrat and J.-P. Hansen, Basic Concepts for Simple and Complex Liquids (Cambridge University Press, 2003).
- Dhont [1996] J. K. G. Dhont, An Introduction to Dynamics of Colloids (Elsevier, New York, 1996).
- Marconi and Tarazona [1999] U. M. B. Marconi and P. Tarazona, J. Chem. Phys. 110, 8032 (1999).
- Marconi and Tarazona [2000] U. M. B. Marconi and P. Tarazona, J. Phys.: Condens. Matter 12, A413 (2000).
- Archer and Evans [2004] A. J. Archer and R. Evans, J. Chem. Phys. 121, 4246 (2004).
- Archer and Rauscher [2004] A. J. Archer and M. Rauscher, J.Phys. A: Math. Gen. 37, 9325 (2004).
- Royall et al. [2007] C. P. Royall, J. Dzubiella, M. Schmidt, and A. van Blaaderen, Phys. Rev. Lett. 98, 188304 (2007).
- Poon [2002] W. C. K. Poon, J. Phys: Condens. Matter 14, R859 (2002).
- Roth et al. [2000] R. Roth, R. Evans, and S. Dietrich, Phys. Rev. E 62, 5360 (2000).
- Aarts and Lekkerkerker [2008] D. G. A. L. Aarts and H. N. W. Lekkerkerker, J. Fluid Mech. 606, 275 (2008).
- Bresme and Oettel [2007] F. Bresme and M. Oettel, J. Phys: Condens. Matter 19, 413101 (2007).
- Hopkins et al. [2009] P. Hopkins, A. J. Archer, and R. Evans, J. Chem. Phys. 131, 124704 (2009).
- Köppl et al. [2006] M. Köppl, P. Henseler, A. Erbe, P. Nielaba, and P. Leiderer, Phys. Rev. Lett. 97 (2006).
- Henseler et al. [2010] P. Henseler, A. Erbe, M. Köppl, P. Leiderer, and P. Nielaba, Phys. Rev. E 81 (2010).
- Allen and Tildesley [1989] M. P. Allen and D. J. Tildesley, Computer simulation of liquids (Clarendon Press, New York, USA, 1989).
- Evans [1979] R. Evans, Adv. in Phys. 28, 143 (1979).
- Evans [1992] R. Evans, Fundamentals of Inhomogeneous Fluids (New York: Dekker, 1992).
- Rosenfeld [1990] Y. Rosenfeld, Phys. Rev. A 42, 5978 (1990).
- Chandler [1987] D. Chandler, Introduction to Modern Statistical Mechanics (Oxford University Press, 1987).
- Dzubiella and Likos [2003] J. Dzubiella and C. N. Likos, Phys. Rev. 15, L147 (2003).
- Penna et al. [2003] F. Penna, J. Dzubiella, and P. Tarazona, Phys. Rev. E 68, 61407 (2003).
- Archer [2005a] A. J. Archer, J. Phys.: Condens. Matter 17, 1405 (2005a).
- Archer [2005b] A. J. Archer, J. Phys.: Condens. Matter 17, S3253 (2005b).
- Rex et al. [2005] M. Rex, H. Löwen, and C. N. Likos, Phys. Rev. E 72, 21404 (2005).
- Rex et al. [2006] M. Rex, C. N. Likos, H. Löwen, and J. Dzubiella, Mol. Phys. 104, 527 (2006).
- Rex et al. [2007] M. Rex, H. H. Wensink, and H. Löwen, Phys. Rev. E 76, 21403 (2007).
- Rauscher et al. [2007] M. Rauscher, A. Domınguez, M. Krüeger, and F. Penna, J. Chem. Phys. 127, 244906 (2007).
- Chacon et al. [2009] E. Chacon, E. M. Fernandez, D. Duque, R. Delgado-Buscalioni, and P. Tarazona, Phys. Rev. B 80 (2009).
- Delgado-Buscalioni et al. [2008] R. Delgado-Buscalioni, E. Chacon, and P. Tarazona, J. Phys.: Condens. Matter 20 (2008).
- Chacon and Tarazona [2005] E. Chacon and P. Tarazona, J. Phys.: Condens. Matter 17, S3493 (2005).
- Chacon and Tarazona [2003] E. Chacon and P. Tarazona, Phys. Rev. Lett. 91 (2003).
- Chacon et al. [2001] E. Chacon, M. Reinaldo-Falagan, E. Velasco, and P. Tarazona, Phys. Rev. Lett. 87 (2001).
- Reguera and Reiss [2004] D. Reguera and H. Reiss, J. Chem. Phys. 120, 2558 (2004).
- Ciach [2008] A. Ciach, Phys. Rev. E 78, 061505 (2008).
- Rex and Löwen [2008] M. Rex and H. Löwen, Phys. Rev. Lett. 101, 148302 (2008).
- Rex and Löwen [2009] M. Rex and H. Löwen, Euro. Phys. J. E 28, 139 (2009).