Ab-initio calculations for the -tin diamond transition in Silicon: comparing theories with experiments
Abstract
We investigate the pressure-induced metal-insulator transition from diamond to -tin in bulk Silicon, using quantum Monte Carlo (QMC) and density functional theory (DFT) approaches. We show that it is possible to efficiently describe many-body effects, using a variational wave function with an optimized Jastrow factor and a Slater determinant. Variational results are obtained with a small computational cost and are further improved by performing diffusion Monte Carlo calculations and an explicit optimization of molecular orbitals in the determinant. Finite temperature corrections and zero point motion effects are included by calculating phonon dispersions in both phases at the DFT level. Our results indicate that the theoretical QMC (DFT) transition pressure is significantly larger (smaller) than the accepted experimental value. We discuss the limitation of DFT approaches due to the choice of the exchange and correlation functionals and the difficulty to determine consistent pseudopotentials within the QMC framework, a limitation that may significantly affect the accuracy of the technique.
I Introduction
The prediction of material behavior under pressure is of great relevance in several branches of science, ranging form material science to planetary physicsMiletich (2005). The experimental determination of pressure effects on the phase diagram can be rather complicated even for simple inorganic crystal, due to the related extreme conditions or the existence of subtle phenomena, such as hysteresis. In this respect, ab-initio calculations are complementary methods for determining phase diagrams and understanding material phases in a large range of pressures and temperatures.
The density functional theory (DFT) has been widely used for describing material behavior under pressure. However, when a transition is accompanied by a drastic change in the electronic structure, non-canceling errors in the two phases can lead to a significant bias in the predicted transition pressure. That is the case of bulk Silicon (Si), where the diamond-to--tin transition is associated with a semiconductor-to-semimetal electronic change. For this reason, the Si diamond-to--tin transition has been used for testing and benchmarking new ab-initio numerical approaches for extended systems. Its first order nature makes it a difficult case for the experimentsJ. C. Jamieson (1963); M. I. McMahon and R. J. Nelmes (1993); G. A. Voronin et al. (2003). The accepted experimental values for the transition pressure are in between and GPa at room temperature, the difference could be ascribed to non hydrostatic conditionsJ. Z. Hu et al. (1986), non quenched metastable phasesM. Tsujino et al. (2008), and presence of lattice defectsS. V. Ovsyannikov et al. (2004).
Theoretical calculations based on DFT strongly depend on the choice of exchange and correlation (XC) functional. Calculations based on the local density approximation (LDA) predict a zero temperature transition pressure in the range of A. Dal Corso et al. (1996)-In-Ho Lee and Richard M. Martin (1997) GPa (this difference could be explained by the type of pseudopotential (PP) used). The generalized gradient approximation (GGA) leads to in the range of N. Moll et al. (1995)-A. Dal Corso et al. (1996) GPa with the Perdew-Wang functionalPerdew et al. (1996a). Moreover, in the case of the PBE functionalPerdew et al. (1996b), a value of GPa is obtained in Ref. In-Ho Lee and Richard M. Martin, 1997. Since the PBE functional fulfills a number of exact DFT properties, this should be considered the state-of-the-art among the most accurate ab-initio functionals. A careful investigation of the effect of the XC functional on the transition pressure was done recently in Ref. Hennig et al., 2010, where the authors show that the inclusion of non-local exchange in the XC functional leads to a significant improvement of the estimate of the transition pressure. All the calculations are performed at zero temperature and therefore a comparison with experiments is possible only after including zero-point motion and finite temperature effects. This accounts for a significant reduction of the transition pressure, as estimated in Ref.K. Gaál-Nagy et al., 1999 by means of the LDA functional, with a correction larger than 1Gpa. Moreover the explicit inclusion of non linear core corrections (NLCC) in pseudopotential calculations further reduces the transition pressure.
Quantum Monte Carlo (QMC) methods can be an alternative to DFT-based approaches. In the past years, many authors have shown practical applications of QMC methods for computing the energetics of extended systemsW. M. C. Foulkes et al. (2001); Leonardo Spanu et al. (2009), and predicting crystal phases under pressureJ. Kolorenc and L. Mitas (2008); D. Alfe et al. (2004). In a early work, Alfé et al.D. Alfe et al. (2004) used diffusion Monte Carlo (DMC) for investigating the Si diamond-to--tin transition. They calculated a QMC transition pressure of GPa, namely - GPa larger than the experimental range. The discrepancy was attributed to the fixed-node (FN) approximationP. J. Reynolds et al. (1982), since the other source of errors (time step error, pseudopotential locality error, size effects) were considered negligible. More recently, Purwanto et al.Wirawan Purwanto et al. (2009) obtained a transition pressure of using the auxiliary-field QMC (AFQMC) method with the phaseless approximation to cure the sign problem, whose bias has been shown to be very smallS. Zhang and H. Krakauer (2003). The very recent DMC calculation in Ref. Hennig et al., 2010, carried out with the most advanced optimizationC. J. Umrigar et al. (2006a) and size-extrapolationHendra Kwee et al. (2008) methods, gives a transition pressure of GPa in substantial agreement with the AFQMC one, although the latest DMC value is affected by a larger uncertainty (GPa).
In the present work, we address the problem of the Si diamond-to--tin zero temperature transition by performing variational Monte Carlo (VMC) calculations for the total energy of the two crystal structures. VMC is not affected by the sign problem and has proven to be a reliable approach for several systemsW. M. C. Foulkes et al. (2001); T. D. Beaudet et al. (2008); M. Casula et al. (2004); Leonardo Spanu et al. (2009). The accuracy of the method depends entirely on the choice of the variational wave function, and the capability of finding its optimal form. In this work, we show that with a relative simple parameterization of the wave function (WF) we are able to describe correlation effects across the metal-insulator transition. Our wave function is a product of a Jastrow factor and a Slater determinant. The variational optimization of the Jastrow factor has a relative small computational costC. J. Umrigar et al. (2006a), and it reveals an accurate way to build-up correlation effects starting from an LDA calculation.
The paper is organized as follows. In Sec. II we review the properties of our variational wave function, we present a systematic study of the basis set used for the calculations, and we discuss the correction of the finite size errors. In Sec. III we review sources of errors not directly estimated at the QMC level, such as the quantum and thermal lattice energies, and the accuracy of the PP’s. This will help us to make a fair comparison between our results and the most significant experimental and theoretical findings reported in literature. In Sec. IV we report our results, while in Sec. V we draw our conclusions.
II Computational Details
In our investigation we have carried out DFT calculations with the Quantum Espresso (QE)P. Giannozzi et al. (2009), Wien2KK. Schwarzland and P. Blaha (2003) and QboxGygi (2010) packages, and we used the TurboRVB codeSorella (2010) to perform variational Monte Carlo (VMC) and Lattice Regularized Diffusion Monte Carlo (LRDMC)M. Casula et al. (2005) calculations. In both DFT and QMC the system is described by an effective Hamiltonian in the Born-Oppenheimer approximation (without quantum effects of lattice vibrations) with the core electrons treated neon-core PP.
For extensive volume (pressure) dependent calculations, we used the relativistic Hartree-Fock PP’s generated by Trail and NeedsTrail and Needs (2005), employed also in previous QMC calculations of Refs. (Hennig et al., 2010; D. Alfe et al., 2004). To check the impact of the PP approximation we carried out single-volume calculations using the Burkatzki-Filippi-Dolg energy-adjusted PP’sBurkatzki et al. (2007) and the ones generated by the atomic PWSCF codeP. Giannozzi et al. (2009) with the Troullier-Martins constructionN. Troullier and J. L. Martins (1991) from relativistic LDA and PBE atomic calculations. The PP’s are expanded in a semilocal form in terms of Gaussians111The pseudopotentials not available in the semilocal Gaussian form, as those generated by the atomic PWSCF code, have been fitted by a series of Gaussian functions. The discrepancy in the transition pressure obtained by the fitted pseudopotentials is less than 0.15 GPa from the original one..
II.1 Wave function and localized basis set
Our many-body wave function is the product of a Slater determinant and a many-body Jastrow factor. Alternatively, in the case of open shell systems, we use the Jastrow-correlated Antisymmetrized Geminal Power (JAGP)M. Casula et al. (2004).
The electron correlation is included in our wave function through the Jastrow factor , where is assumed to depend only upon two-electron coordinates, and is the total number of electrons. The function is expanded in a basis of Gaussian atomic orbitals , such that it reads:
| (1) |
The convergence of this expansion is improved by adding an homogeneous term and a one-body contribution, thus satisfying the electron-electron and the electron-ion cusp conditions, respectively M. Casula and S. Sorella (2003); M. Casula et al. (2004). The basis set used for the Jastrow includes Gaussian orbitals.
For system with large number of electrons, we improve the efficiency of the optimization procedure and its computational cost, adopting an explicit parameterization of the Jastrow factor. Given two generic orbitals and , the variational coefficient in Eq. 1 depends only on the orbital symmetry (in this case either s or p) and the distance vector between the corresponding atomic centers. is optimized without constraint when the two orbitals are localized on the same atom (i.e. ). Otherwise is parameterized in a way to recover an isotropic large distance correlation. For the sake of clarity, we define as the vector containing the three p-orbital components centered at a given atomic position , and with we indicate the s-wave orbital located at the same position. By this notation we can write four possible isotropic invariant contributions for , such that:
where , and is the unit vector connecting the atomic centers and . The functions are polynomials which read:
| (3) |
The scalar functions in Eq. II.1 depend only on variational parameters, optimized via energy minimizationC. J. Umrigar et al. (2006b).
We verified the validity of the chosen parameterization (at long and short distances), by a direct comparison with the case of a fully optimized Jastrow factor (i.e. without parameterization). The expression in Eq. II.1 can be appropriate for physical long distance behaviors of the Jastrow factor, including the one recently speculated for describing the Mott insulator, and containing a long range termManuela Capello et al. (2008).
The Slater determinant is obtained with molecular orbitals , each doubly occupied by opposite spin electrons. The orbitals are expanded in a Gaussian single-particle basis set , centered on atomic nuclei, i.e. . The Slater determinant is build from LDA orbitals. LDA calculations are performed with a periodic Gaussian basis set (see Appendix A for its definition) by using the DFT code included in the TurboRVB packageSorella (2010). This allows us to perform an efficient DFT calculation in exactly the same basis used in QMC and without employing the so called Kleinman-Bylander approximation on the PP’s.
We carefully tested the effects of the basis set extrapolation on the total energy for both diamond and -tin geometries. Following the systematically convergent method for accurate total energy calculations recently introduced in Ref.(S. Azadi et al., 2010), we have used a tempered basis set, where the Gaussian exponents are defined as for with and . The parameters , and are free. We verified that our basis set parameterization guarantees the same accuracy in both metallic and insulating phases for all investigated pressures.
For a given angular momentum (), we fixed the maximum number of Gaussians according to the formula , inspired by the correlated consistent basis set approachT. H. Dunning Jr. (1989); K. A. Peterson and T. H. Dunning Jr. (2002). It follows that the maximum number of exponents is used only on the s-wave channel, where . We studied the basis set extrapolation with respect to by fixing and .
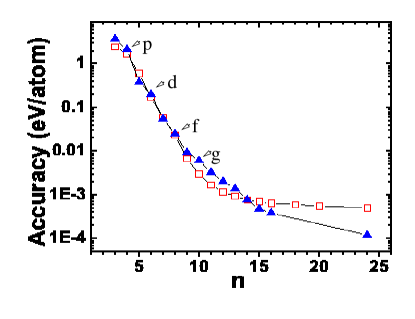
In Fig. 1 we show the convergence of the DFT energy as a function of for a system of Si atoms. We report the accuracy at Å and for the -tin phase, and at volume Å for the diamond phase. The accuracy in the energy is estimated by using a fully converged reference energy of a plane-wave calculation with 100 Ry kinetic energy cutoff. This was obtained with the Qbox packageGygi (2010), by using the same PP’s in the semilocal form as the ones used in our QMC calculations. An accuracy of eV/Si is sufficient to determine the equation of state (EOS) with an error well below the experimental uncertainty. From this analysis it turns out that and the inclusion of -orbitals in the basis set guarantee an accuracy of eV/Si on the energy difference between the two phases.
In the following, VMC and LRDMC production runs are performed using a basis set with , , and . The basis set exponents have been optimized at the DFT level. We found the optimal parameters and , that minimize the DFT energy in both the diamond and tin phases.
All Jastrow parameters, including exponents, are obtained by means of VMC energy minimizationC. J. Umrigar et al. (2006b). Possible correlation effects not included by our Jastrow parameterization are recovered by performing LRDMC calculations. As a projector method, LRDMC allows one to obtain the best variational wave function with the same nodal structure as the initial variational wave function, the so called fixed node approximation (FN), giving an upper bound of the true ground state energy even with non local pseudopotentialsM. Casula et al. (2005, 2010).
II.2 Finite-size errors
Contrary to standard DFT methods, QMC calculations have to be performed on a supercell. Therefore, finite size (FS) effects can be a relevant source of error in QMC calculations. Several methods have been proposed for correcting FS errors. One source of FS errors arises from the kinetic and Hartree term and can be treated by standard DFT approach with point sampling. This is a genuine one-body contribution, and can be corrected by , i.e. the difference between the DFT energy per atom with a fully converged point mesh and the energy per atom of the supercell with finite volume and number of electrons .
The other source of errors (two-body terms) is related to the finite size effects of the exchange and correlation (XC) functionals, not explicitly included in . We calculate the two-body term corrections using the functional proposed by Kwee, Zhang and Krakauer (KZK) Hendra Kwee et al. (2008). In Ref. Hendra Kwee et al., 2008 the authors proposed to estimate this type of FS error within the LDA framework, where the exchange and correlation energy functional is replaced by the LDA functional parameterized for a finite system, which keeps an explicit dependence on the number of particles. Therefore, the total one- and two-body correction is given by , where is the DFT energy computed with the KZK functional for electrons.
We observe that FS errors can be particularly relevant for open shell metallic systems. The AGP wave function approach allows to include many determinants in a effective way, removing the degeneracy of the open shell by an appropriate fractional occupation of the degenerate levels. Within LDA, by using a negligible smearing in the occupation of the KS energy levels, the degenerate orbitals containing the HOMO are partially occupied with the same charge, and can be used consistently in the AGP wave function.
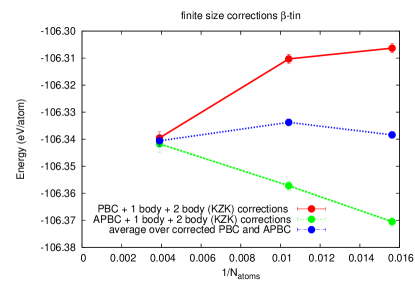
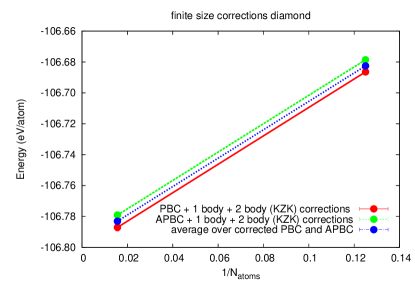
For alleviating the effects of the one-body terms, we performed VMC and LRDMC calculations averaging the KZK corrected energies over the two most symmetric points ( and ). Previous DMC calculationsD. Alfe et al. (2004); Hennig et al. (2010) were performed only at the point, leading to more pronounced size effects. In Tab. 1 we report the energy for different sizes together with KZK corrections, while in Fig. 2 we show how important is to average over the (PBC) and (APBC) points to reduce considerably the error in the finite size extrapolation222It is clear that with the PBC+APBC average of the KZK corrected energies we can reduce the error on the final transition pressure well below the meV/atom threshold reached in Ref. Hennig et al., 2010.. By averaging over PBC and APBC boundary conditions we reach an accuracy of 5 meV/atom with 64 atoms, well below the magnitude of other systematic errors, as we will see in Sec. III. Therefore, at variance with Ref. Hennig et al., 2010, where a single k-point was adopted in the size extrapolations, the finite size bias is not the largest error in our calculations.
| 64 tin | -106.3063(17) | -.0654 | -106.3705(17) | .2214 | -106.3384(12) | .07799 |
|---|---|---|---|---|---|---|
| 96 tin | -106.3103(17) | -0.0584 | -106.3572(20) | 0.0865 | -106.3338(13) | 0.01409 |
| 256 tina | -106.3395(23) | -.0273 | -106.3417(32) | .08855 | -106.3406(22) | .03064 |
| 64 diamond | -106.7871(23) | -0.0329 | -106.7791(23) | -0.0044 | -106.7831(16) | -0.0187 |
| 8 diamond | -106.6864(14) | -.6700 | -106.6786(14) | -.6632 | -106.6825(10) | -0.6666 |
-
Corrected by eV/atom to take into account that in this case for the long distance tail of the Jastrow a few variational parameters ansatz was adopted, as described in Sec. II.1. The same form was used in the Si case to estimate this correction.
III Impact of various approximations
III.1 Pseudopotential approximation
The change in Silicon coordination number (from to ), related to the structural transition from diamond to -tin geometries, may affect the transferability of Si PP’s in the two phases.
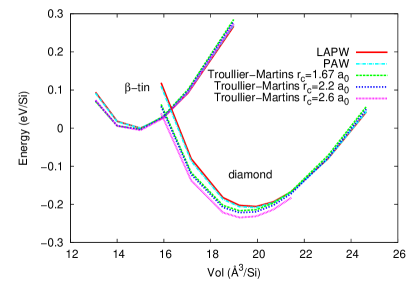
We verified the impact of PP’s on our final results, by estimating the transition pressure at the DFT-LDA level with different norm conserving PP’s and with the projector augmented-wave (PAW) methodBlöchl (1994); Kresse and Joubert (1999). 333 The parameters of the PAW data set are , , ( is local). The nonlocal channels are fitted at the eigenvalue and at Ry for and . The unbound channel is at Ry. The results have been compared with all electron calculations obtained with the Wien2kK. Schwarzland and P. Blaha (2003) code. In Fig. 3, we report the EOS obtained with norm conserving PP’s generated by the Troullier-Martins method with scalar relativistic corrections and different cutoff radii , the data obtained by the PAW method, and the reference all-electron results. The PP DFT calculations have been done with the PWSCF codeP. Giannozzi et al. (2009). We worked with a plane wave cutoff of 50 Ry and a charge density cutoff of 200 Ry. The number of non-equivalent k-points in the Brillouin zone is 160 for the -tin phase, and 80 for the diamond structure. We checked that those parameters give converged DFT results with a Gaussian broadening of 0.01 Ry of the Fermi surface.M. Methfessel and A. T. Paxton (1989) On the other hand, the Wien2k calculations are PP error free, and therefore they can be used to check the PP accuracy. They have been performed with an equivalent Brillouin zone integration over a k-point mesh, a muffin-tin radius ( is the Bohr radius), and a plane wave cutoff given by . These parameters give converged results. If the error from the PP approximation were negligible, all EOS curves would superimpose on each other. Instead, Fig. 3 shows that the EOS differ significantly. As reported in Tab. 2, the transition pressure seems to converge with respect to the Troullier-Martins core radius as it gets small. Its main effect is to shifts the relative position between the diamond and -tin EOS branches. The EOS from PP’s calculations are however different from the all-electron one, even for the smallest . Our results clearly show how the prediction of properties under pressure is affected by the PP approximations. The best choice in the DFT framework is to use the PAW pseudopotentials, which give both the transition pressure and EOS very close to the all-electron results.
| DFT method | (GPa) |
|---|---|
| LDA LAPW | 7.12 |
| LDA PW PAW | 7.21 |
| LDA PW Troullier-Martins | 7.44 |
| LDA PW Troullier-Martins | 7.65 |
| LDA PW Troullier-Martins | 8.27 |
At the QMC level additional errors may came from the lack of a consistent method to generate PP’s from the corresponding correlated QMC calculation for an isolated atom 444 Early attempts to generate PP’s at the QMC level was done in Ref. G. B. Bachelet et al., 1989. A direct evaluation of the core-valence interaction was attempted in Ref.D. Alfe et al., 2004.
In Tab. 3 we report our VMC and LRDMC results using Hartree-Fock, energy adjusted and LDA generated pseudopotentials. The transition pressures reported in Tab. 3 are evaluated by computing the energy of the diamond and -tin phase at the volume per atom of Å3 and Å3 respectively, and assuming that the curvature of the corresponding EOS is the same as the one computed for the Trail-Needs pseudopotentials.
| pseudopotential | VMC | LRDMC |
|---|---|---|
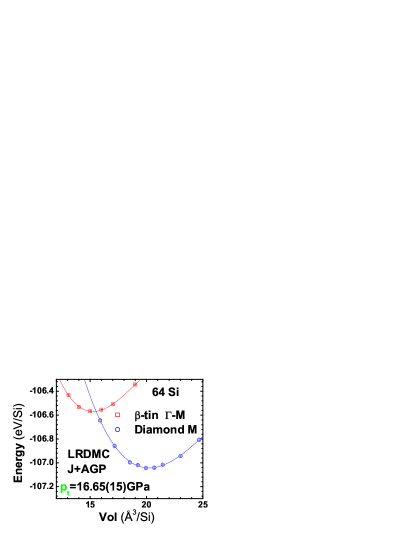
| HF Trail-Needs | 15.48(6) | 16.65(15) |
| energy adjusted Burkatzki-Filippi-Dolg | 15.80(6) | 16.50(12) |
| LDA Troullier-Martins | 15.39(18) | 16.83(19) |
| LDA Troullier-Martins | 15.08(18) | 16.11(19) |
Results in Fig. 3 and Tab. 3 clearly shows the interaction between core and valence electrons cannot be approximated by a rigid shift in energy ( as usually assumed estimating the effect of PP on the transition pressure).
Core-valence interactions accounts for a correction of GPa and were calculated in Ref. D. Alfe et al., 2004. In order to improve the accuracy of this correction an all electron calculation is required. At present this is almost impossible within QMC, and therefore an uncertainty of at least 1 GPa coming directly from the PP approximation is unavoidable in our QMC findings.
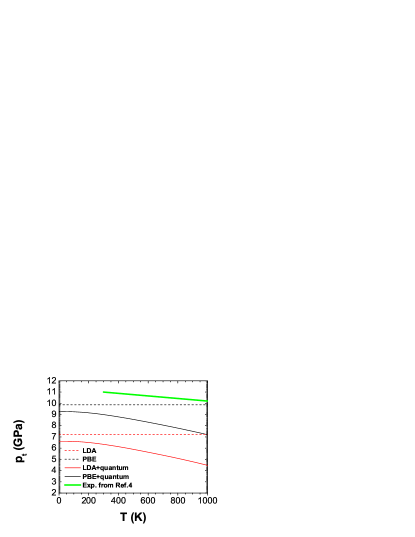
III.2 Phonons and temperature effects
The inclusion of finite temperature and zero point motion effects is crucial for a direct comparison of our results with finite temperature experiments (usually performed at room temperature). Both experiments V. V. Brazhkin et al. (1995) and theory K. Gaál-Nagy et al. (1999) indicate that temperature corrections induce a positive shift to the critical equilibrium line. On the other hand, a further shift in pressure is induced by the inclusion of zero point motion effects. Phonon dispersions are in fact different in the two phases and zero point motion effects do not compensate.
| V (Å3/Si) | 0K | 100K | 300K | 500K | 700K | 1000K |
|---|---|---|---|---|---|---|
| Diamond phase | ||||||
| 15.882 | 0.077/0.073 | 0.073/0.069 | 0.042/0.039 | -0.012/-0.016 | -0.084/-0.090 | -0.218/-0.226 |
| 17.169 | 0.069/0.068 | 0.067/0.066 | 0.040/0.041 | -0.012/-0.011 | -0.083/-0.081 | -0.215/-0.212 |
| 18.524 | 0.066/0.064 | 0.064/0.063 | 0.039/0.038 | -0.012/-0.014 | -0.082/-0.084 | -0.213/-0.216 |
| 19.228 | 0.064/0.062 | 0.062/0.061 | 0.038/0.036 | -0.014/-0.016 | -0.084/-0.087 | -0.216 -0.220 |
| 19.949 | 0.062/0.060 | 0.060/0.059 | 0.036/0.034 | -0.017/-0.019 | -0.088/-0.091 | -0.221/-0.225 |
| 20.687 | 0.060/0.058 | 0.058/0.057 | 0.033/0.031 | -0.020/-0.022 | -0.092/-0.095 | -0.226/-0.231 |
| 21.444 | 0.058/0.056 | 0.056/0.055 | 0.031/0.029 | -0.023/-0.026 | -0.096/-0.101 | -0.233/-0.238 |
| 23.013 | 0.054/0.052 | 0.052/0.051 | 0.025/0.023 | -0.032/0.034 | -0.108/0.112 | -0.249/0.254 |
| 24.656 | 0.050/0.048 | 0.048/0.047 | 0.019/0.017 | -0.040/0.044 | -0.120/0.124 | -0.265/0.271 |
| Sn phase | ||||||
| 13.081 | 0.055/0.053 | 0.053/0.051 | 0.025/0.022 | -0.033/0.036 | -0.110/0.114 | -0.251/0.257 |
| 14.004 | 0.049/0.047 | 0.048/0.046 | 0.017/0.014 | -0.044/0.048 | -0.125/0.130 | -0.272/0.280 |
| 15.000 | 0.044/0.042 | 0.042/0.040 | 0.008/0.005 | -0.058/0.063 | -0.144/0.150 | -0.299/0.308 |
| 15.978 | 0.039/0.037 | 0.036/0.035 | -0.002/0.005 | -0.073/0.078 | -0.164/0.172 | -0.328/0.339 |
| 17.031 | 0.034/0.032 | 0.030/0.028 | -0.014/0.019 | -0.093/0.100 | -0.192/0.202 | -0.368/0.382 |
| 18.984 | 0.026/0.025 | 0.020/0.019 | -0.037/0.040 | -0.129/0.135 | -0.242/0.250 | -0.438/0.450 |
Finite temperature effects and zero point motion energies are included in our estimate of the transition pressure, by calculating phonon dispersions for the -tin and diamond phase with the QE package. In order to study the convergence of our phonon calculations with the k-point mesh we performed PWSCF runs with large plane wave cutoff (up to 100 Ry), accurate k-point sampling (up to inequivalent k-points for the tin phase and inequivalent k-points for the diamond phase), as well as a small value of the Gaussian broadening (width of 0.0001 Ry). We have used the PAW data set as in the previous section for the LDA calculation, and an ultra-soft (US) PP generated with similar parameters and core radii for the PBE calculation.
Following Ref. K. Gaál-Nagy et al., 1999, we compute the harmonic correction to the free energy per atom, by using the phonon density of states available in QE after Fourier interpolation of the phonon bands, (namely by using matdyn.x):
| (4) |
where is assumed. In using the above expression, one has to take into account that the total phonon density of states per atom is obviously normalized to
| (5) |
as there are three phonon modes per atom in the thermodynamic limit. Integrations were changed to summations over a uniform mesh with high resolution (), and the original density of states was appropriately scaled to fulfill Eq. 5.
Free energy corrections (see Tab. 4) are then added to a total energy zero temperature calculations. In this way our calculation of the transition pressure, estimated by the Maxwell construction of the free energy curves, is essentially free of systematic errors within the chosen DFT functional, as long as phonon anharmonic effects can be neglected in the low temperature regime. This is a reasonable assumption below the melting temperature occurring at about .
To test the impact of the exchange and correlation functional on quantum correction estimates, we have performed calculations with both the PBE and LDA functionals. As shown in Fig. 4, although different functionals provide different transition pressures, the corrections to the bare values are very similar and consistent within GPa and in fair agreement with experimental results. The results demonstrate that phonons are rather well described within DFT and these corrections are very reliable at least before the melting point. Our results do not agree with a previous workK. Gaál-Nagy et al. (1999) on this subject, where the zero temperature quantum corrections were underestimated by about a factor two, and finite temperature corrections were larger by about a factor three. PP used in Ref.K. Gaál-Nagy et al., 1999 is no more available and we were not able to reproduce the quoted results. Presently the reason for this discrepancy is not clear.
With new available PP’s, our temperature corrections are very well converged, and appear in reasonable agreement with recent experimental data (see Fig. 4).
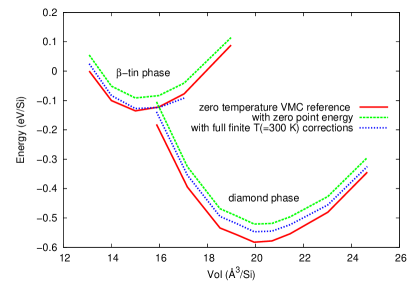
By using DFT-PBE free energy corrections to VMC total energies, we obtain the corrected VMC curve reported in Fig. 5, and the corrected transition pressures in Tab. 5.
| VMC | LRDMC | |
|---|---|---|
| Born-Oppenheimer | 15.48(6) | 16.65(15) |
| zero point motion | 14.84(6) | 15.71(14) |
| K | 14.53(6) | 15.74(17) |
As one can note, the zero point energy for the diamond phase is larger than the one for the -tin phase by eV, which decreases the transition pressure by GPa. The finite temperature correction is negative, and its absolute value is larger for the -tin phase. Therefore, a further reduction of GPa is obtained at K, which implies that the total correction at room temperature is GPa, a smaller value than the one estimated in Ref. K. Gaál-Nagy et al., 1999. At the LRDMC level, we obtain roughly the same total correction ( GPa), although it is more difficult to discriminate the temperature effect, as the statistical error is larger (see Tab. 5).
III.3 Kleinman-Bylander approximation
The matrix elements of the non-local PP can be evaluated either by direct numerical Gauss-Hermite (GH) integration over the polar coordinates or by using the Kleinman-Bylander (KB) approximationL. Kleinman and D. M. Bylander (1982); P. L. Blöchl (1990). The KB approach is a rather general concept, and it is applied in DFT calculations to make the calculation of the PP operator more efficient. In particular, in the plane-wave formalism the generated PP is conveniently expressed in the plane-wave basis set. On the other hand, in the QMC framework, one usually works in the coordinate representation where electron positions and spins are given, and this makes the KB construction hard to implement numerically. Consequently, the pseudopotentials used in QMC are usually generated in the so called semilocal form (local + non local part), and computed by performing a random integration over their angular componentsS. Fahy et al. (1990); L. Mitáš et al. (1991); M. Casula et al. (2005). However, in previous QMC calculations of the Si diamond-to--tin transitionD. Alfe et al. (2004); Hennig et al. (2010) the determinantal part has been generated from plane-wave DFT calculations, where the KB approximation was usedUmrigar (2010) to represent a pseudopotential originally written in a semilocal form. This procedure could lead in principle to a poorer form of the variational wave function in the proximity of the core, where the non-local PP is mostly localized, with an impact on its nodal structure, and therefore a larger FN error.
| Quantity | KB | GH | present | present |
|---|---|---|---|---|
| Total energy | -102.85692 | -102.84036 | -102.83975 | -102.83737 |
| Kinetic energy | 50.95461 | 50.83712 | 50.83563 | 50.83195 |
| Non-local pseudo | 22.13269 | 22.45092 | 22.45256 | 22.45398 |
| Quantity | KB | GH | present | present |
|---|---|---|---|---|
| Total energy | -105.32986 | -105.31911 | -105.31880 | -105.31302 |
| Kinetic energy | 44.0823 | 43.96216 | 43.96152 | 43.95454 |
| Non local pseudo | 21.43672 | 21.79496 | 21.79506 | 21.79468 |
To investigate the impact of KB approach, we compared the total energy, the kinetic energy, and the non-local term of the PP, obtained from a single M-point DFT calculation with and without the KB approximation. The results are shown in Tab. 6 for a system of Si in the -tin phase with and volume Å, and in the diamond phase with volume Å. Calculations within the KB approximation are done using the PWscf DFT implementationP. Giannozzi et al. (2009). We use the Qbox codeGygi (2010) for performing plane-wave calculations with Gauss-Hermite integration. An energy cut-off of Ry was used in all the plane-wave calculations. The exchange and correlation energy was described in the LDA by the Perdew-Zunger functionalJ. P. Perdew and A. Zunger (1981). The energies reported in Tab. 6 and Tab. 7 clearly show that the use of KB approximation causes an error of 0.3 eV/Si when evaluating the contribution from the non-local term of the PP. This error cancels out in the energy difference between the two phases, leaving the DFT results unbiased by this kind of approximation. In principle, our analysis cannot exclude that the nodal structure of the DFT generated wave function is unaffected close to the core, since there is a significant KB error in the PP contribution of the total energy. In practice, the close agreement between our LRDMC results, unaffected by the KB approximation, and the ones in Ref. Hennig et al., 2010, where this approximation has been used, shows that the cancellation of KB errors applies also in QMC calculations and leads to unbiased energy differences.
Our results are unaffected by the KB approximation by construction, as the DFT code implemented in the TurboRVB package uses the exact GH integration of the semilocal pseudopotentials. Moreover, the DFT results shown in Tab. 6 and Tab. 7 are a further validation of the convergence of our periodic Gaussian basis set. Indeed, we found a perfect agreement between the energies obtained with plane-wave calculations (performed by means of the Qbox code Gygi (2010) and without the KB approximation) and the ones obtained with our Gaussian basis set implementation in the TurboRVB packageSorella (2010).
IV Results
In this section we present our QMC results for the transition pressure, performed with the Trail-Needs pseudopotentials. We first validate the quality of our variational wave function in both the -tin and diamond phases. In the -tin phase, we compute the ratio in the proximity of the critical pressure (at volume Å3/atom), where this lattice parameter is experimentally known. We evaluate also the bulk modulus and other structural properties from the fit of the equation of state , and compare them with former experimental and theoretical values. Finally, we compute the transition pressure by performing the Maxwell construction on the EOS of both phases.
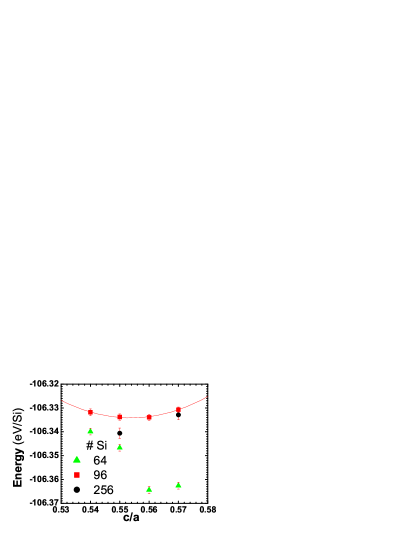
In Fig. 6 we report the VMC energies as a function of the ratio for the -tin phase at different supercell size (, , Si atoms) and fixed volume Å3/atom. All the energies include FS corrections within the KZK scheme, as reported in Subsec. II.2. The results in Fig. 6 are a first test of the quality of our WF for describing the -tin phase. With the Jastrow optimization we reproduce rather well the experimental value . Therefore for all the following VMC and LRDMC calculations we fix the ratio to the value .
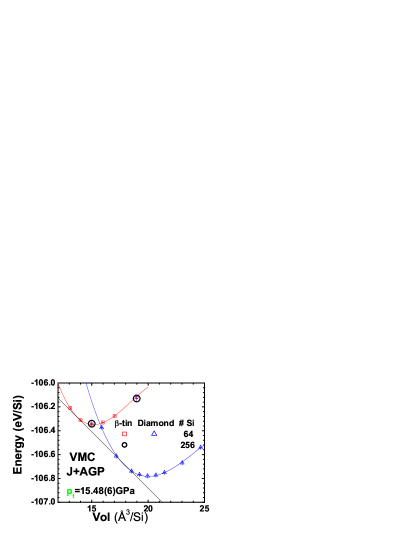
In Fig. 7 we reported the VMC results for the energy as a function of the volume . All the energies in the Figure include FS corrections using the KZK scheme. Although FS effects are more pronounced in the metallic phase, the results for the -tin phase clearly show that the FS errors are under control. In fact we find that the energies for the atoms supercell fall on the top of the data for the atoms calculations. LRDMC energies are shown in Fig. 8 for atoms supercell. VMC and LRDMC EOS are fitted using a cubic polynomial function. The results for bulk properties of the diamond phase, reported in Tab. 8, are in very good agreement with the experimental values, whereas the ones for the tin structure compares well with previous QMC data. Note also that there exists a sizable zero point motion correction to both the equilibrium volume and the bulk modulus, that has not been taken into account so far in previous works. We have estimated these corrections by adding to the EOS the zero temperature quantum corrections evaluated within the harmonic approximation and the PBE functional, as explained in Subsec. III.2.
| diamond phase | (Å3/Si) | (eV/Si) | B (GPa) |
|---|---|---|---|
| LDA | 19.77 | 5.29 | 95.75 |
| PBE | 20.42 | 4.62 | 89.4 |
| VMC | 20.1240.036111 Corrected by 0.1Å3/atom to take into account the zero point motion. | 4.60030.0015222 Corrected by -0.06eV/atom to take into account the zero point motion. | 102.31.4333 Corrected by -1.6GPa to take into account the zero point motion. VMC and LRDMC are further corrected by GPa to take into account non cubic terms in the interpolation within the equilibrium volume range () Å in the tin (diamond) phase. |
| LRDMC | 20.330.1111 Corrected by 0.1Å3/atom to take into account the zero point motion. | 4.66500.003222 Corrected by -0.06eV/atom to take into account the zero point motion. | 95.783333 Corrected by -1.6GPa to take into account the zero point motion. VMC and LRDMC are further corrected by GPa to take into account non cubic terms in the interpolation within the equilibrium volume range () Å in the tin (diamond) phase. |
| DMC (Ref. D. Alfe et al., 2004) | 20.21 0.03111 Corrected by 0.1Å3/atom to take into account the zero point motion. | 4.62 0.01 222 Corrected by -0.06eV/atom to take into account the zero point motion. | 101.410 333 Corrected by -1.6GPa to take into account the zero point motion. VMC and LRDMC are further corrected by GPa to take into account non cubic terms in the interpolation within the equilibrium volume range () Å in the tin (diamond) phase. |
| DMC (Ref. Hennig et al., 2010) | 20.080.05 111 Corrected by 0.1Å3/atom to take into account the zero point motion. | - | 987 333 Corrected by -1.6GPa to take into account the zero point motion. VMC and LRDMC are further corrected by GPa to take into account non cubic terms in the interpolation within the equilibrium volume range () Å in the tin (diamond) phase. |
| Exp. | 20.0444Taken from Ref. M. Hill, 1999 | 4.620.08555Taken from Ref. M.T. Yin and M.L. Cohen, 1982 | 99444Taken from Ref. M. Hill, 1999 |
| Sn phase | (Å3/Si) | (eV/Si) | B (GPa) |
| LDA | 14.92 | 5.10 | 115.4 |
| PBE | 15.45 | 4.29 | 110.7 |
| VMC | 15.25 0.05 666 Corrected by 0.11Å3/atom to take into account the zero point motion. | 4.186 0.0013 777 Corrected by -0.04eV/atom to take into account the zero point motion. | 119.7 3.5888 Corrected by -2.8GPa to take into account the zero point motion. VMC and LRDMC are further corrected by -5.6Gpa analogously to the diamond phase. |
| LRDMC | 15.34 0.16 666 Corrected by 0.11Å3/atom to take into account the zero point motion. | 4.211 0.0024 777 Corrected by -0.04eV/atom to take into account the zero point motion. | 111.3 8.3 888 Corrected by -2.8GPa to take into account the zero point motion. VMC and LRDMC are further corrected by -5.6Gpa analogously to the diamond phase. |
| DMC (Ref. Hennig et al., 2010) | 15.310.2 666 Corrected by 0.11Å3/atom to take into account the zero point motion. | - | 98.612 888 Corrected by -2.8GPa to take into account the zero point motion. VMC and LRDMC are further corrected by -5.6Gpa analogously to the diamond phase. |
The critical pressure of the diamond to -tin transition is reported in Tab. 9. VMC calculations give a raw of GPa, LRDMC data give GPa.
The inclusion of zero point motion, finite temperature and core-valence contributions bring the transition pressure to GPa (VMC) and GPa (LRDMC), for a total final shift of GPa (Tab. 9). Zero point motion and thermal corrections at K amount to GPa and to GPa respectively (they are estimated performing a PBE phonons calculations, as explained in Subsec. III.2). The core-valence interaction contribution is GPa from Ref. D. Alfe et al., 2004, the same value has been used in Refs. Hennig et al., 2010; D. Alfe et al., 2004; Wirawan Purwanto et al., 2009. Contributions beyond frozen core approximation are already included at the DFT level trough non-linear core corrections in the PP. We observe that previous calculations D. Alfe et al. (2004),Wirawan Purwanto et al. (2009)Hennig et al. (2010) consider a total correction to the raw data of GPa, because of the different value of the zero point energy and finite temperature effects. All previous calculations should be increased by GPa, for accounting this difference. .
| method | raw (GPa) | corrected (GPa) ( K) |
|---|---|---|
| LDA | 7.21 | 6.34 |
| PBE | 9.87 | 8.99 |
| VMC | 15.480.06 | 13.331.0 |
| LRDMC | 16.650.15 | 14.501.0 |
| DMC (Ref. D. Alfe et al., 2004) | 19.0 0.5 | 16.50.5 |
| DMC (Ref. Hennig et al., 2010) | 16.51.0 | 14.0 1.0 |
| AFQMC (Ref. Wirawan Purwanto et al., 2009) | 15.1 0.3 | 12.6 0.3 |
| Exp. | 10.0 - 12.5 | 10.0 - 12.5 |
Both our corrected VMC and LRDMC values are above the experimental range, and remarkably the more accurate LRDMC method leads to a transition pressure larger than the VMC result.
To further support the accuracy of our LRDMC calculations, we have systematically optimized the molecular orbitals by minimizing the VMC energy in presence of a Jastrow factor, starting from the LDA orbitals, for a system of Silicon atoms (see Tab.10). The optimization of the molecular orbitals allows us to assert the impact of the wave function on the final LRDMC results.
| system | DFT+J/LRDMC | FOPT/LRDMC |
|---|---|---|
| diamond VÅ PBC | -106.0120(12)/-106.3064(27) | -106.0493(10)/-106.3204(24) |
| tin VÅ PBC | -106.5557(11)/-106.8765(28) | -106.5890(10)/-106.8871(32) |
| tin VÅ APBC | -103.7359(13)/-104.0720(41) | -103.7617(9)/-104.0818(36) |
We have found that the LDA orbitals are a quite accurate starting point, but for the diamond at equilibrium geometry the total VMC energy decreases slightly more (eV/atom) than the one for the tin at high pressure, implying an increase in the transition pressure of about GPa at the VMC level. That is again consistent with the more accurate LRDMC calculation, which is much less affected by the optimization of the wave function as clearly shown in Tab. 10. Altogether these results point even more clearly in the direction of a larger zero temperature transition pressure.
V Conclusions
We have performed DFT and QMC calculations for the diamond-to-tin transition in Silicon. At the QMC level we have proven that it is possible to accurately and efficiently describe correlation effects across the metal-insulator transition by applying a relatively simple Jastrow factor to a DFT generated Slater determinant.
We have shown that the estimation of the PP effect is one of the most delicate issues in any QMC calculation, and represents so far the most significant source of systematic error in the transition pressure, amounting to about 1GPa, as described in Subsec. III.1. The core-valence correlation correction strongly depends on the PP, and is almost unpredictable without doing the corresponding all-electron calculation. Moreover, the only known QMC estimate for this correction (GPa), was done in Ref. D. Alfe et al., 2004 for the Trail-Needs PP, and is affected by a large statistical error ( GPa).
In the present work we have also found a significant reduction of the phonon correction to the transition pressure- from the quoted GPaK. Gaál-Nagy et al. (1999) to our fully converged LDA and PBE value of GPa at K. This shifts up all previous QMC estimates by GPa. Thus, we arrive at the conclusion that all Monte Carlo findings published so far predict a transition pressure that is significantly larger than the one observed at room temperature, from GPaWirawan Purwanto et al. (2009) to GPaD. Alfe et al. (2004) above the experimental upper edge of GPa.
Our VMC technique is in agreement with the value of the transition pressure recently reported by the AFQMC techniqueWirawan Purwanto et al. (2009). A clear increase of the transition pressure by about 1GPa is obtained when the accuracy of the calculation is improved by the LRDMC scheme. Although LRDMC total energies are more accurate, it is in principle possible that this technique could lead to results worse than the VMC ones in the estimation of the equation of state. However we believe that this is quite unlikely, because DMC as well as LRDMC always improve the accuracy of the physical estimates, as long as they are applied to a reasonably good variational wave function.
As a further independent check that a more accurate transition pressure is larger than the VMC estimate, we have optimized the Slater determinant in presence of the Jastrow factor for a small number of atoms, and found a consistent increase in the transition pressure. Although we cannot estimate more accurately the nodal error -namely the exact ground state result for given pseudopotential- it looks plausible that by fully optimizing the wave function this error should decrease. Therefore, our orbital optimization should give at least the trend of the correction to the approximate VMC result.
On the other hand, our LRDMC result is very close to the recent DMC calculation performed by Hennig et al.Hennig et al. (2010), where the same pseudopotential was used, whereas the DFT Slater determinant was obtained with the PBE functional and the KB approximation for the pseudopotentialUmrigar (2010). This agreement suggests also that the DMC/LRDMC technique is weakly dependent on the functional used to generate the DFT orbitals and should be considered rather accurate for a given pseudopotential.
To summarize, our best estimate of the transition pressure at room temperature is 14.5 GPa, with an uncertainty of 1 GPa coming mainly from the pseudopotential approximation, as our finite-size extrapolation error is definitely smaller. The discrepancy with respect to the experimental values leads us to conclude that further work is necessary to determine the phase boundary of the metal-insulator transition in Silicon. On one hand, from the experimental point of view one should verify whether, by removing the stress anisotropy in the experimental environment, the transition pressure can significantly increase and get closer to the QMC prediction, as suggested in Ref. Hennig et al., 2010. On the other hand, in QMC calculations it should be worth defining consistent pseudopotentials, since we have seen that they can significantly affect the EOS at large pressure. So far there is in fact no accurate method to estimate the systematic error related to the pseudopotential approximation, since an all-electron calculation of bulk silicon is basically prohibitive within the QMC method. A first attempt along these lines has been done in Ref. K. P. Esler et al., 2010. At this stage of development the construction of pseudopotentials is quite unsatisfactory for high accuracy QMC calculations, since the pseudopotentials are usually determined with different and less accurate techniques, as Hartree-Fock or LDA. Despite the recent progress in the use of pseudopotentials within DMCM. Casula et al. (2005); M. Casula (2006); M. Casula et al. (2010), the implementation of the pseudopotential approximation in the many-body QMC framework is not as mature as in the DFT, where a remarkable progress was made only after several years of experience with the so called PAW methodBlöchl (1994); Kresse and Joubert (1999). Thus, in QMC we believe there is room for a significant improvement to be realized in the next years.
Appendix A Gaussian periodic basis set
We use a localized Gaussian basis set on a box of of lengths , defining the periodic electron-ion distance as
| (6) |
where indicate the Cartesian components of the electron coordinates for and the corresponding ion ones with . The angular part of the Gaussian basis can be defined in strict analogy with the conventional scheme for open systems. They are obtained by multiplying the overall Gaussian by appropriate polynomials of and , where and labels the three Cartesian components. Strictly speaking in the periodic case there is an arbitrariness in defining this polynomials because the multiplication of a polynomial by any even cos-power defines an allowed element of the atomic basis satisfying the periodic or antiperiodic boundary conditions in each direction.
In order to define the basis in an accurate and convenient way, we have chosen the unique polynomials that contain the minimum possible cosine powers. For instance the angular part of the -wave orbital is defined by:
| for | ||||
| for | ||||
| for | ||||
Acknowledgements.
We acknowledge F. Gygi for his support in using the Qbox code. We thank Shiwei Zhang and Matteo Calandra for useful discussions and correspondence. We are especially in debt with Pasquale Pavone for useful comments and suggestions about the phonon calculations. MC thanks the Ecole Polytechnique, the japanese-french JST-CREST grant for financial support, and the NCSA computing facilities at the University of Illinois at Urbana-Champaign. SS was supported by MIUR COFIN07 and CINECA.References
- Miletich (2005) R. Miletich, EMU notes in Mineralogy: Mineral Behaviour at extreme Conditions (7th EMU School of Mineralogy, Heidelberg, Germany, 2005).
- J. C. Jamieson (1963) J. C. Jamieson, Science 139, 762 (1963), ISSN 0036-8075.
- M. I. McMahon and R. J. Nelmes (1993) M. I. McMahon and R. J. Nelmes, Phys. Rev. B 47, 8337 (1993), ISSN 0163-1829.
- G. A. Voronin et al. (2003) G. A. Voronin, C. Pantea, T. W. Zerda, L. Wang, and Y. Zhao, Phys. Rev. B 68, 020102 (2003).
- J. Z. Hu et al. (1986) J. Z. Hu, L. D. Merkle, C. S. Menoni, and I. L. Spain, Phys. Rev. B 34, 4679 (1986), ISSN 0163-1829.
- M. Tsujino et al. (2008) M. Tsujino, T. Sano, N. Ozaki, O. Sakata, M. Okoshi, N. Inoue, R. Kodama, and A. Hirose, The Review of Laser Engineering Supplemental Volume, 1218 (2008).
- S. V. Ovsyannikov et al. (2004) S. V. Ovsyannikov, V. V. Shchennikov, and A. Misiuk, JETP Letters 80, 405 (2004).
- A. Dal Corso et al. (1996) A. Dal Corso et al., Phys. Rev. B 53, 1180 (1996).
- In-Ho Lee and Richard M. Martin (1997) In-Ho Lee and Richard M. Martin, Phys. Rev. B 56, 7197 (1997).
- N. Moll et al. (1995) N. Moll, M. Bockstedte, M. Fuchs, E. Pehlke, and M. Scheffler, Phys. Rev. B 52, 2550 (1995).
- Perdew et al. (1996a) J. P. Perdew, K. Burke, and Y. Wang, Phys. Rev. B 54, 16533 (1996a), ISSN 0163-1829.
- Perdew et al. (1996b) J. Perdew, K. Burke, and M. Ernzerhof, Phys. Rev. Lett. 77, 3865 (1996b).
- Hennig et al. (2010) R. G. Hennig, A. Wadehra, K. P. Driver, W. D. Parker, C. J. Umrigar, and J. W. Wilkins, Phys. Rev. B 82 (2010), ISSN 1098-0121.
- K. Gaál-Nagy et al. (1999) K. Gaál-Nagy, A. Bauer, M. Schmitt, K. Karch, P. Pavone, and D. Strauch, Phys. Status Solidi B 211, 275 (1999).
- W. M. C. Foulkes et al. (2001) W. M. C. Foulkes, L. Mitas, R. J. Needs, and G. Rajagopal, Rev. Mod. Phys. 73, 33 (2001), ISSN 0034-6861.
- Leonardo Spanu et al. (2009) Leonardo Spanu, Sandro Sorella, and Giulia Galli, Phys. Rev. Lett. 103, 196401 (2009), ISSN 0031-9007.
- J. Kolorenc and L. Mitas (2008) J. Kolorenc and L. Mitas, Phys. Rev. Lett 101, 185502 (2008).
- D. Alfe et al. (2004) D. Alfe, M. J. Gillan, M. D. Towler, and R. J. Needs, Phys. Rev. B 70, 214102 (2004), ISSN 1098-0121.
- P. J. Reynolds et al. (1982) P. J. Reynolds, D. M. Ceperley, B. J. Alder, and W. A. Lester, J. Chem. Phys. 77, 5593 (1982).
- Wirawan Purwanto et al. (2009) Wirawan Purwanto, Henry Krakauer, and Shiwei Zhang, Phys. Rev. B 80, 214116 (2009), ISSN 1098-0121.
- S. Zhang and H. Krakauer (2003) S. Zhang and H. Krakauer, Phys. Rev. Lett. 90, 136401 (2003).
- C. J. Umrigar et al. (2006a) C. J. Umrigar, J. Toulouse, C. Filippi, S. Sorella, and R. G. Hennig, Phys. Rev. Lett. 98, 110201 (2006a).
- Hendra Kwee et al. (2008) Hendra Kwee, Shiwei Zhang, and Henry Krakauer, Phys. Rev. Lett. 100, 126404 (2008), ISSN 0031-9007.
- T. D. Beaudet et al. (2008) T. D. Beaudet, M. Casula, J. Kim, S. Sorella, and R. M. Martin, J. Chem. Phys. 129, 164711 (2008).
- M. Casula et al. (2004) M. Casula, C. Attaccalite, and S. Sorella, J. Chem. Phys. 121, 7110 (2004).
- P. Giannozzi et al. (2009) P. Giannozzi et al., J. Phys.: Condens. Matter 21, 395502 (2009).
- K. Schwarzland and P. Blaha (2003) K. Schwarzland and P. Blaha, Comput. Mater. Sci. 28, 259 (2003).
- Gygi (2010) F. Gygi, Qbox (2010), URL http://eslab.ucdavis.edu/software/qbox/.
- Sorella (2010) S. Sorella, Turborvb (2010), URL http://turborvb.qe-forge.org/.
- M. Casula et al. (2005) M. Casula, C. Filippi, and S. Sorella, Phys. Rev. Lett. 95, 100201 (2005).
- Trail and Needs (2005) J. R. Trail and R. J. Needs, The Journal of Chemical Physics 122, 174109 (pages 10) (2005), URL http://link.aip.org/link/?JCP/122/174109/1.
- Burkatzki et al. (2007) M. Burkatzki, C. Filippi, and M. Dolg, Jour. Chem. Phys. 126, 234105 (2007).
- N. Troullier and J. L. Martins (1991) N. Troullier and J. L. Martins, Phys. Rev. B 43, 1993 (1991).
- M. Casula and S. Sorella (2003) M. Casula and S. Sorella, J. Chem. Phys. 119, 6500 (2003).
- C. J. Umrigar et al. (2006b) C. J. Umrigar, J. Toulouse, C. Filippi, S. Sorella, and R. G. Hennig, Phys. Rev. Lett. 98, 110201 (2006b).
- Manuela Capello et al. (2008) Manuela Capello, Federico Becca, Michele Fabrizio, and Sandro Sorella, Phys. Rev. B 77, 144517 (2008).
- S. Azadi et al. (2010) S. Azadi, C. Cavazzoni, and Sandro Sorella, Phys. Rev. B 82, 125112 (2010).
- T. H. Dunning Jr. (1989) T. H. Dunning Jr., J. Chem. Phys. 90, 1007 (1989).
- K. A. Peterson and T. H. Dunning Jr. (2002) K. A. Peterson and T. H. Dunning Jr., J. Chem. Phys. 117, 10548 (2002).
- M. Casula et al. (2010) M. Casula, S. Moroni, S. Sorella, and C. Filippi, J. of Chem. Phys. 132, 154113 (2010).
- Blöchl (1994) P. E. Blöchl, Phys. Rev. B 50, 17953 (1994).
- Kresse and Joubert (1999) G. Kresse and D. Joubert, Phys. Rev. B 59, 1758 (1999).
- M. Methfessel and A. T. Paxton (1989) M. Methfessel and A. T. Paxton, Phys. Rev. B 40, 3616 (1989).
- V. V. Brazhkin et al. (1995) V. V. Brazhkin, A. G. Lyapin, S. V. Popova, and R. N. Voloshin, Phys. Rev. B 51, 7549 (1995).
- L. Kleinman and D. M. Bylander (1982) L. Kleinman and D. M. Bylander, Phys. Rev. Lett. 48, 1425 (1982).
- P. L. Blöchl (1990) P. L. Blöchl, Phys. Rev. B 41, 5414 (1990).
- S. Fahy et al. (1990) S. Fahy, X. W. Wang, and Steven G. Louie, Phys. Rev. B 42, 3503 (1990).
- L. Mitáš et al. (1991) L. Mitáš, E. L. Shirley, and D. M. Ceperley, J. Chem. Phys. 95, 3467 (1991).
- Umrigar (2010) C. J. Umrigar, private communication (2010).
- J. P. Perdew and A. Zunger (1981) J. P. Perdew and A. Zunger, Phys. Rev. B 23, 5048 (1981).
- M. Hill (1999) M. Hill, ed., Properties of Crystallin Silicon (INSPEC, London, 1999).
- M.T. Yin and M.L. Cohen (1982) M.T. Yin and M.L. Cohen, Phys. Rev. B 26, 5668 (1982).
- K. P. Esler et al. (2010) K. P. Esler, R. E. Cohen, B. Militzer, Jeongnim Kim, R. J. Needs, and M. D. Towler, Phys. Rev. Lett. 104, 185702 (2010).
- M. Casula (2006) M. Casula, Phys. Rev. B 74, 161102 (2006).
- G. B. Bachelet et al. (1989) G. B. Bachelet, D. M. Ceperley, and M. G. B. Chiocchetti, Phys. Rev. Lett. 62, 2088 (1989), ISSN 0031-9007.