11email: ckehrig@aip.de, oschnurr@aip.de 22institutetext: Department of Astronomy, University of Michigan, 500 Church Street, Ann Arbor, MI 48109
22email: msoey@umich.edu, fogel@umich.edu, pelleger@umich.edu 33institutetext: Department of Physics and Astronomy, University of Sheffield, Hounsfield Road, Sheffield, S3 7RH, UK
33email: Paul.Crowther@sheffield.ac.uk 44institutetext: Geneva Observatory, University of Geneva, 51, Ch. des Maillettes, 1290 Versoix, Switzerland
44email: daniel.schaerer@unige.ch 55institutetext: L owell Observatory, 1400 W. Mars Hill Road, Flagstaff, AZ 86001, USA
55email: massey@lowell.edu 66institutetext: Gemini Observatory, Hilo, HI 96720, USA
66email: kroth@gemini.edu
Gemini GMOS spectroscopy of HeII nebulae in M33
We have carried out a narrow-band survey of the Local Group galaxy, M33, in the HeII 4686 emission line, to identify HeII nebulae in this galaxy. With spectroscopic follow-up observations, we confirm three of seven candidate objects, including identification of two new HeII nebulae, BCLMP651, HBW673. We also obtain spectra of associated ionizing stars for all the HII regions, identifying two new WN stars. We demonstrate that the ionizing source for the known HeII nebula, MA 1, is consistent with being the early-type WN star MC8 (M33-WR14), by carrying out a combined stellar and nebular analysis of MC8 and MA1. We were unable to identify the helium ionizing sources for HBW 673 and BCLMP 651, which do not appear to be Wolf-Rayet stars. According to the [OIII]5007/H vs [NII]6584/H diagnostic diagram, excitation mechanisms apart from hot stellar continuum are needed to account for the nebular emission in HBW 673, which appears to have no stellar source at all.
Key Words.:
stars: atmospheres — stars: Wolf-Rayet — ISM: HII regions — ISM: lines and bands — galaxies: individual (M33) — galaxies: star formation1 Introduction
The nebular HeII 4686 emission line is often observed in the integrated spectra of blue compact dwarf galaxies [BCDs; e.g., Kunth & Sargent (1981); de Mello et al. (1998); Izotov et al. (2006a); Kehrig et al. (2008)], together with other signatures of high ionization (e.g.,[Ne V] and [Fe V] emission) (Thuan & Izotov 2005). It is often seen in Wolf-Rayet (WR) galaxies, especially in low-metallicity systems (e.g., Schaerer et al. 1999; López-Sánchez & Esteban 2010). Locally, however, HeII emission is extremely rare in ordinary HII regions (e.g., Garnett et al. 1991; Nazé et al. 2003a), excluding planetary nebulae. What is the origin of this line ? Only certain classes of WR stars, and possibly also certain O stars, are predicted to be hot enough to ionize nebular HeII (e.g.,Kudritzki 2002; Crowther 2007), whose ionization potential eV.
In the few, known examples of HeII nebulae in the Local Group, nebular HeII emission appears to be mostly associated with individual stars (e.g., Garnett et al. 1991). For example, two nebulae (G2.4+1.4 in the Milky Way and S3 in IC 1613) are ionized by WO stars (Johnson 1975; Davidson & Kinman 1982); and four nebulae, N79, N206 in the LMC, and N76, NGC249 in the SMC, are associated with early WN stars (Pakull 1991; Niemela et al. 1991; Testor & Pakull 1989; Pakull 2009). The N159 F nebula in the LMC is ionized by a massive X-ray binary (LMC X-1;Pakull & Angebault 1986), and the LMC N44 C nebula appears to be associated with a normal O7 star (Garnett et al. 2000), although it has also been suggested to be ionized by a “fossil” X-ray source (Pakull & Motch 1989) that is no longer present.
The WR phase occurs after 3-5 Myr for high mass stars, and has relatively short durations (few 105 yr), making WR stars vital, age-sensitive probes of high-mass star formation. Their HeII-ionizing luminosities are among the highest of any stars, reaching up to (e.g., Smith et al. 2002). The nebular HeII emission therefore offers a powerful probe to infer properties such as initial mass function, metallicities, and ages for distant star-forming regions. To properly understand and interpret HeII emission as a diagnostic, it is essential to establish which WR stars are responsible for nebular HeII. WR spectral energy distributions (SEDs) are notoriously difficult to model, involving complex radiation transfer in non-LTE, supersonic expanding atmospheres with important ionization stratification, inhomogeneities, and line blanketing (e.g., Crowther et al. 1995, 2002; Hamann & Koesterke 1998). As a result, model atmospheres have varied greatly; for example, Schmutz & De Marco (1999) point out very different predictions for the core effective temperature of the prototype WN4b star, HD 50896: Schmutz (1993) predicted 45,000 K, while Hamann & Koesterke (1998) predicted 100,000 K. There are especially dramatic differences in the model SEDs for the HeII edge at 228 Å. Fifteen years ago, early WC and WN stars often had been predicted to ionize He+ (e.g., Schaerer 1996), whereas more recent models now show softer SEDs and only occasional He+-ionizing emission (e.g., Crowther et al. 2002a; Smith et al. 2002). The elusiveness of HeII nebulae is consistent with this latter trend. However, it contrasts with the observed large number of nebular HeII-emitting WR galaxies (Schaerer et al. 1999).
A possible explanation for nebular HeII emission in metal-deficient objects is that in such low metallicity environments, WR stars possess sufficiently weak winds that are optically thin in the He+ continuum (e.g., Schmutz et al. 1992), thereby allowing the He+-ionizing radiation to escape from the stellar atmospheres. Thus, empirical determination of the stellar parameter space associated with nebular HeII photoionization will provide much-needed constraints for WR model atmospheres (e.g., Schaerer 1996; Crowther et al. 1999; Schaerer 2002).
Outside the Local Group, Brinchmann et al. (2008) analysed spectra of 570 WR galaxies from SDSS6 and conclude that at , the main sources of HeII ionizing photons appears to be O stars, arguing for a less dense stellar wind at these metallicities, while at higher abundances WN stars might increasingly dominate the ionization budget. de Mello et al. (1998) showed that the observed equivalent widths of nebular HeII4686 emission in the BCD IZw18 can be reproduced from an instantaneous burst model with the present WC/WO stars. They also demonstrate that there is a spatial correlation of nebular HeII4686 with the position of WR stars. A similar result was reported by Kehrig et al. (2008) who found WR stars in the BCD IIZw70 by means of integral field spectroscopy. They find that the region occupied by the likely ionizing cluster is associated to the nebular emission in 4686 Å indicating that the hard ionizing radiation responsible for the nebular HeII4686 emission can be related to the WR stars. However, although WR and O stars could be responsible for most of the HeII emission in BCDs and WR galaxies (e.g.,Schaerer 1996), other processes are apparently needed to explain this high ionization in a significant fraction of them (e.g., Guseva et al. 2000; Thuan & Izotov 2005)
Models of HeII 4686 as a diagnostic have already been computed, both without (e.g., Schaerer 1996, 2002; Smith et al. 2002) and with supernovae remnants [SNRs; Cerviño et al. (2002)]. The metal-poor sensitivity is a primary motivation to develop diagnostics for relatively unevolved starbursts, and strong nebular HeII1640,4686 emission is expected to be one of the best signatures of massive Population III stars (e.g., Schaerer 2002; Schaerer 2003 and references therein). Several searches for this spectral signature in high-redshift galaxies have been carried out (e.g., Dawson et al. 2004; Nagao et al. 2008; Ouchi et al. 2008 and review in Schaerer 2008).
To better understand the actual source of HeII nebular emission, we have carried out a systematic search for HeII nebulae in the Local Group galaxy, M33. The proximity of M33, together with its relatively low inclination () and high star-formation rate, makes this an ideal target for such a study. At its distance of 840 kpc (Freedman et al. 2001), 1 4 pc. Moreover, M33 has a well-determined metallicity gradient (Rosolowsky & Simon 2008; hereafter RS08), allowing us to search for objects over a range of metallicities. For example, the case of G2.4+1.4, in the direction of the Galactic Center, suggests that HeII nebulae can also form in metal-rich environments.
The paper is organized as follows. In §2, we report narrow-band imaging to identify candidate HeII nebulae, and follow-up spectroscopic observations. The nebular properties of our HII regions are discussed in §3. In §4, we describe our sample of confirmed HeII nebulae, including a detailed analysis of the object MA 1 and its resposible ionizing star, MC8. In §5 we discuss our results. Finally, §6 summarizes the main conclusions derived from this work.
2 Observations and data reduction
2.1 Narrow-band imaging
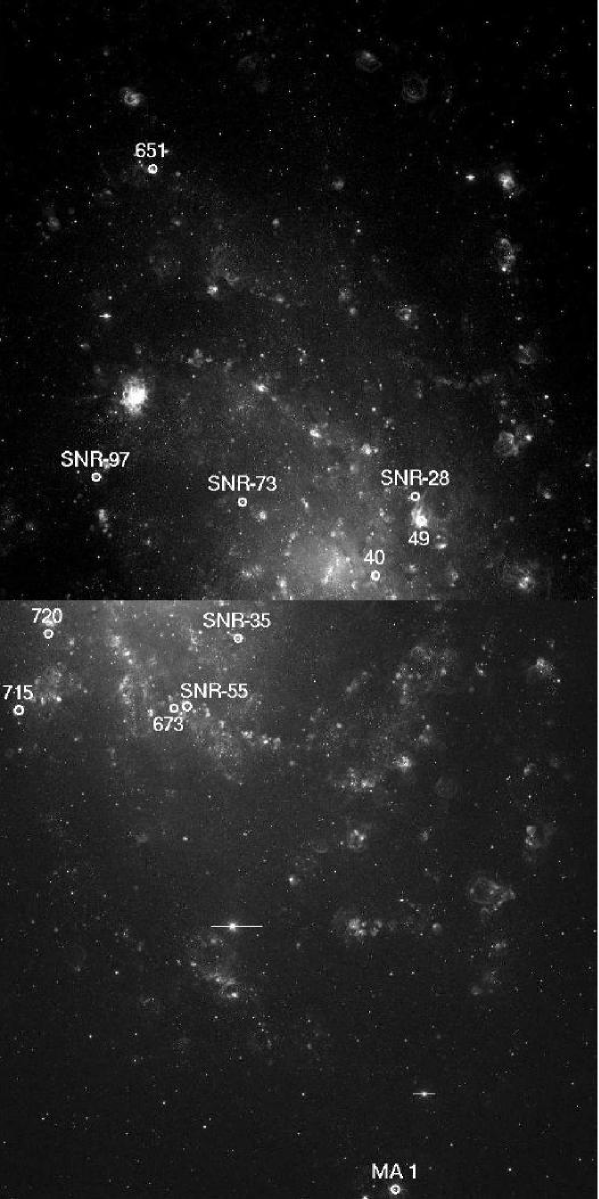
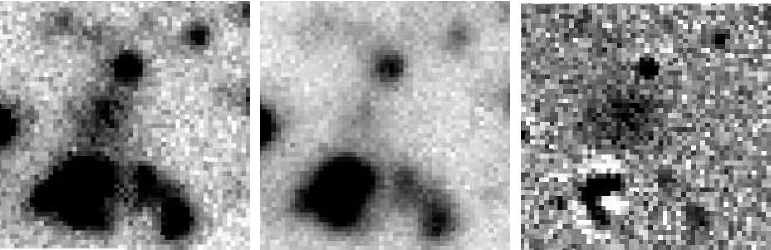
We obtained HeII narrow-band imaging of M33 with the MOSAIC imaging camera on the 4-m Mayall Telescope at Kitt Peak National Observatory, on November 3, 2003. We used the “WR HeII” filter centered at 4690 Å for emission-line imaging, and the “WR475” filter centered at 4750 Å for continuum observations. Both filters have a transmission full width at half-maximum (FWHM) of about 50 Å. The 36 MOSAIC field of view allowed us to image essentially the entire star-forming disk of M33 in two fields, North and South (Figure 1). These fields are centered at the same positions as the H narrow-band images obtained by one of us (PM) as part of the NOAO Survey of Resolved Stellar Content of Local Group Galaxies, which were also obtained with the MOSAIC camera. We observed in 20-minute exposures for a total of 100 minutes on the South field, and 140 minutes on the North field.
The data were reduced using the MSCRED routines in IRAF111IRAF is distributed by the National Optical Astronomical Observatories, which are operated by the Association of Universities for Research in Astronomy, Inc., under cooperative agreement with the National Science Foundation., including bias subtraction, flat-fielding, and bad pixel correction. The MOSAIC camera also generates a low-level reflection of the pupil, which was removed with the standard tools for this purpose in the MSCRED software package. The final, combined continuum image was then registered with the corresponding line image, again using the MSCRED tools.
From the continuum-subtracted images, we visually identified 12 candidate HeII nebulae in M33. The HeII emission is faint and apparently diffuse in all cases. Seven of the objects are diffuse HII regions, mostly associated with WR stars, while five are confirmed young SNRs.
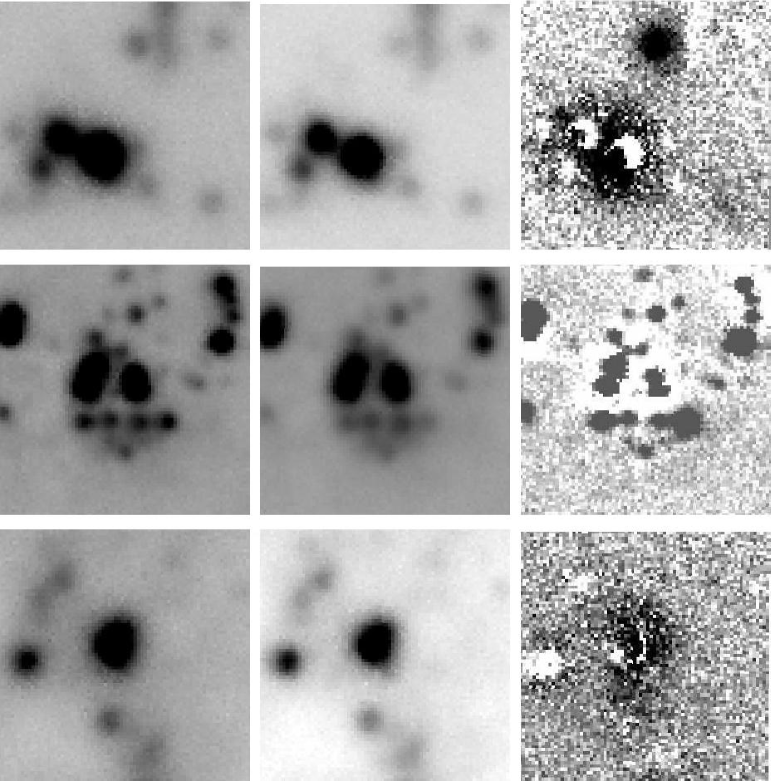
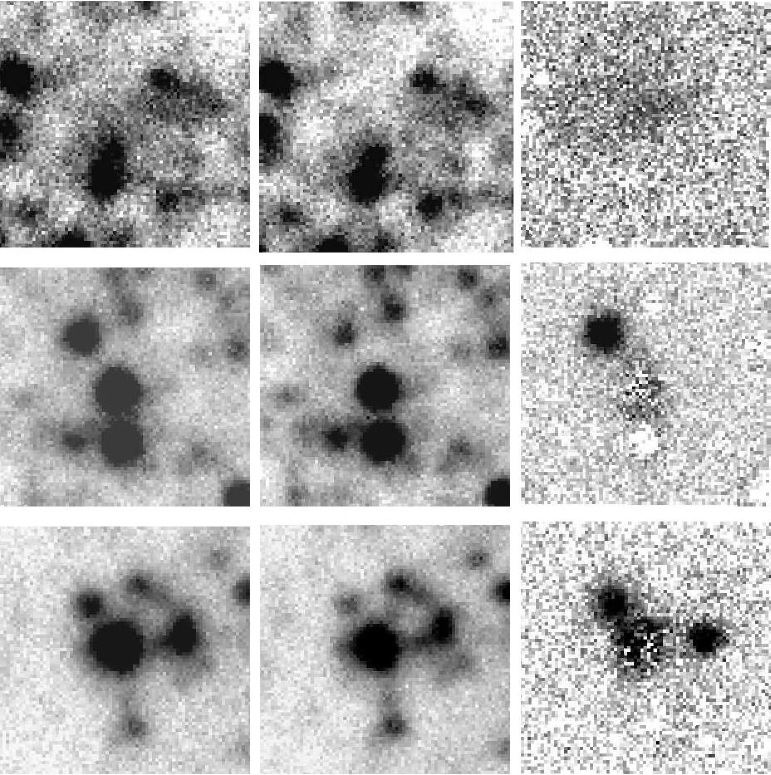
Figure 1 displays a portion (0.5∘ x 0.5∘) of the H images obtained previously, as described above. North and South fields of M33 are shown, with the location of the 12 observed HeII nebulae identified. The HeII emission-line, continuum and continuum-subtracted images of our seven HII regions are shown in Figure 2.
| Namea𝑎aa𝑎aCatalog abbreviations are the following: BCLMP, Boulesteix et al. (1974); MA, Mayall & Aller (1942); HBW, Hodge et al. (1999) | Other designation | R.A. | DEC | Galactocentric | Slit PA | Observing date |
|---|---|---|---|---|---|---|
| (J2000.0) | (J2000.0) | distance (Kpc) | (degrees) | |||
| MA 1 | HII-anon | 01 33 02.2 | +30 11 18.8 | 7.3 | 246.6 | 25 Sep 2008 |
| BCLMP 49 | NGC 595 | 01 33 33.5 | +30 41 33.6 | 1.4 | 90.0 | 24 Sep 2008 |
| BCLMP 40 | 01 33 43.1 | +30 39 06.2 | 0.6 | 100.0 | 24 Sep 2008 | |
| HBW 673 | HII-z29 | 01 33 49.5 | +30 33 19.5 | 1.7 | 216.0 | 29 Aug 2006 |
| BCLMP 720 | 01 34 16.0 | +30 36 42.8 | 2.0 | 213.4 | 24 Sep 2008 | |
| BCLMP 715 | 01 34 22.3 | +30 33 13.8 | 2.6 | 215.3 | 24 Sep 2008 | |
| BCLMP 651 | 01 34 29.5 | +30 57 16.6 | 4.7 | 340.4 | 26 Sep 2008 |
2.2 Spectrophotometric data
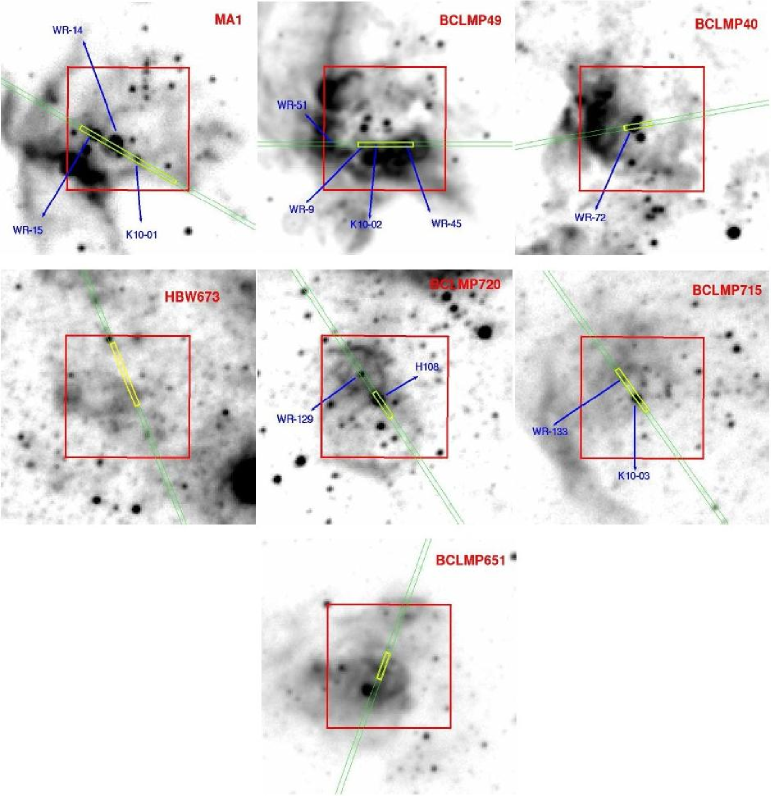
We obtained follow-up spectroscopic data of our sample objects with the Gemini Multi-Object Spectrograph (GMOS; Hook et al. 2004) at the Gemini-North observatory. We were awarded two different runs, one in service mode during semester 2006B (program GN-2006B-Q-83), and another in classical mode during the nights 2008 September 24 - 26 (program GN-2008B-C-5). The seven target HII regions are listed in Table 1. Columns (1) and (2) show the ID for each object from the catalogs of Boulesteix et al. (1974), Hodge et al. (1999), and Mayall & Aller (1942). Columns (3) and (4) give the object coordinates. Column (5) quotes the deprojected galactocentric distance of each nebula for our assumed distance of 840 kpc to M33 and an inclination angle of 56 degrees (Zaritsky et al. 1989). Column (6) gives the long-slit position angle (PA) used for each object. The last column shows the corresponding spectroscopic observing date. Figure 3 shows our finding charts for the sample, using the H emission-line images in Figure 1. The associated hot stars (see Table 3) are identified, together with the slit positions for our observations (green boxes). Yellow boxes show where the nebular HeII emission falls within the slit, and represent the apertures for our extracted spectra.
The GMOS detector array consists of three EEV CCDs in a row. We used the B600 grating in the blue, covering a spectral range 3600 – 6400 Å (centered at 5000 Å). On the red side, the R600 (centered at 7730 Å) was utilized, providing a spectral range from 6300 to 9110 Å. The data were binned by a factor of 4 in the spatial dimension and by 2 in the spectral dimension, yielding 0.29/pix and a spectral resolution of 3.6 Å FWHM sampled at 0.9 Å/pixel. The complete spectroscopic setup information is given in Table 2. We obtained spectra of both the nebulae and their associated ionizing stars, using a slit width of 0.75. Observations of the spectrophotometric standard stars BD+284211 and BD+254655 were obtained during the observing nights for flux calibration. Bias frames, dome flat-fields and copper-argon arc exposures were taken as part of the Gemini baseline calibrations.
| Spectral range | Dispersion | Resolving power | Spatial resolution | Exposure time | |
|---|---|---|---|---|---|
| (Å) | (Å pix-1) | (” pix-1) | (sec) | ||
| 3600 - 6400 | 0.90 | 1688 | 0.29 | ||
| 6300 - 9110 | 0.94 | 3744 | 0.29 |
The raw images were processed using the Gemini GMOS routines within IRAF. Biases and flat-fields were combined with the tasks gbias and gsflat, respectively. Science targets and standard stars were reduced with task gsreduce, which applies the overscan correction, subtracts off the bias, mosaics the three detectors of GMOS interpolating across the chip gaps for science data, and applies the flat field correction. The wavelength calibration was established from the arcs with the task gswavelength giving residuals 0.1 Å. The science spectra were further wavelength calibrated by applying the task gstransform. We use the task gsextract to extract the one dimension spectra performing sky subtraction. The sensitivity function was created by using the task gsstandard, and finally we flux calibrated the science images making use of the task gscalibrate. The uncertainty in the instrument response fitting across the spectrum for blue and red sides is 2 .
| HII region | Associated ionizing star(s) | |||
|---|---|---|---|---|
| Namea𝑎aa𝑎aLGGS designation (JHHMMSS.ss+DDMMSS.s) from Massey et al. (2006). | Other designationb𝑏bb𝑏bStar identifications are MC = Massey & Conti (1983); M33-WR = Massey & Johnson (1998; hereafter MJ98); NGC595-WR = Drissen et al. (1993); AM = Armandroff & Massey (1985); W91 = see Massey et al. (1995) and MJ98; Hnnn = Corral (1996); K10-nn = this work. | Spectral Type | ||
| Previous workc𝑐cc𝑐cSpectral types from MJ98, Abbott et al. (2004), Drissen et al. (2008) and references therein. | This work | |||
| MA 1 | J013303.19+301124.2 | MC8 = M33-WR14 | WN | WNE |
| J013303.19+301124.2 | MC9 = M33-WR15 | WN | WNE | |
| J013302.66+301120.4 | K10-01 | — | WN3-4 | |
| BCLMP 49 | J013333.81+304129.6 | NGC595-WR9 | WN7 | WN7 |
| J013333.66+304129.8 | K10-02 | — | O | |
| J013333.46+304129.8 | featurelessd𝑑dd𝑑dWe are not able to provide a classification for the star since its spectrum shows no obvious stellar features. | |||
| J013333.31+304129.7 | AM5 = M33-WR45 = NGC595-WR3 | WC6 | WC6 | |
| J013334.38+304130.2 | AM7 = M33-WR51 = NGC595-WR7 | WNL | WN8 | |
| BCLMP 40 | J013343.19+303906.2 | “W91 129” (M33-WR72) | WN7+abs | WN7-8 |
| HBW 673 | no obvious star associated | |||
| BCLMP 720 | J013416.07+303642.1 | H108 | P Cyg LBV candidatee𝑒ee𝑒eP Cyg LBV candidate classification comes from Massey et al. (2007). | P Cyg LBV candidate |
| J013416.28+303646.4 | MC70 = M33-WR129 | WC5 | WC5 | |
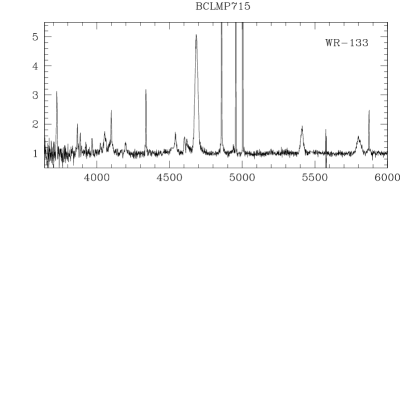
| BCLMP 715 | J013422.54+303317.1 | MC72 = M33-WR133 | WN | WN4 |
| J013422.37+303313.7 | K10-03 | — | WN4 | |
| BCLMP 651 | J013429.44+305719.2 | featurelessd | ||
| J013429.65+305711.2 | featurelessd | |||
In Table 3 we list the dominant ionizing stars for our HII regions, and their rectified, blue spectra are plotted in Figure 4. These stellar spectra were used to estimate spectral classifications. For three of the stars in Table 3, designated as K10-, spectral types were not known before. We also refine spectral types provided previously by others. We base our classification of WN stars on the line ratios proposed by Smith et al. (1996) (e.g., HeII5411/HeI5875; NV4604/NIII4640; NIV4057/NV-III4604-40). The two WC stars in our sample were classified using the CIII5696/CIV5808 line ratio (Crowther et al. 1998). We also confirm the luminous blue variable (LBV)-like spectrum of the M33 star J013416.07+303642.1 classified previously as a P Cyg LBV candidate by Massey et al. (2007). For three stars in our sample we are not able to give any spectral type since their spectra have low S/N and show no obvious stellar features.
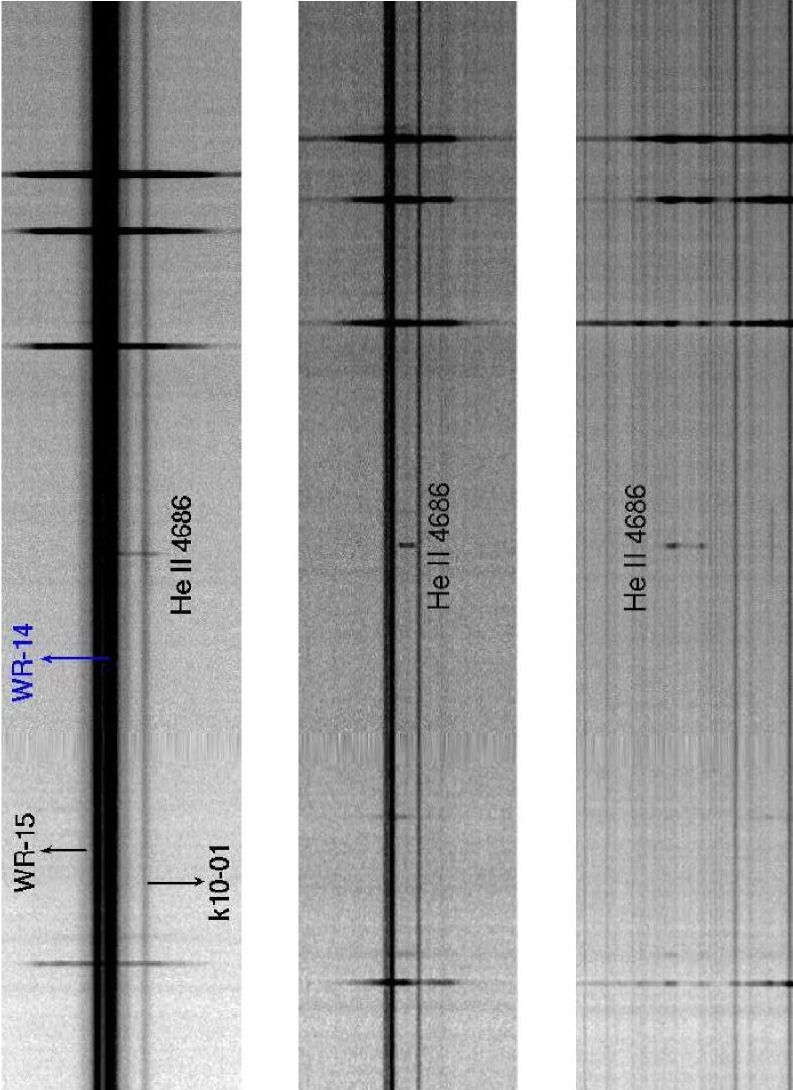
Blue and red spectra for the HII regions are displayed in Figures 5 and 6, respectively. From these spectra, we are able to confirm nebular HeII emission in three of the seven HII regions: MA 1, BCLMP651 and HBW673, the last two being new HeII-emitting nebulae identified for the first time. Portions of our two dimensional spectra of MA 1, BCLMP651 and HBW673 are shown in Figure 7 from which we can see spatially extended HeII4686 emission, thus confirming its nebular nature. Figure 8 presents the wavelength range 4255 - 4775 Å for these three nebulae, from which we can see the faint, temperature sensitive emission line [OIII]4363 and the nebular HeII4686.
Emission-line fluxes were measured in the 1D spectra (Figures 5 and 6) using the IRAF task SPLOT, which integrates the line intensity from a locally fitted continuum. The derived line fluxes were computed via gaussian fitting. We carried out an iterative procedure to derive both the logarithmic reddening, C(H), and the equivalent width of the absorption in the hydrogen lines, EWabs, which we use to correct the measured line intensities for both effects. We used the Galactic reddening law of Cardelli et al. (1989) and assumed that EWabs is the same for all Balmer lines (e.g., Kobulnicky & Skillman 1996, Kobulnicky et al. 1999). We computed a linear fit to the ratio of the measured-to-theoretical Balmer decrements as a function of the aforementioned reddening law, while simultaneously varying the values for the EWabs. This fit provides a value of C(H) for each value of EWabs. We then adopted the EWabs and C(H) values from the best fit (i.e. with minimum chi-square). The uncertainty of the fit is adopted as the error in C(H). In order to estimate how the EWabs correction affects our results, we compare the values of C(H) with and without the aforementioned EWabs correction, and we find that most are the same within the uncertainties. This indicates that, in general, the contribution of the EWabs in the final flux measurements is not significant. Moreover, in all cases, our estimations for the do not exceed the typical value of 2Å from McCall (1982).
Since the blue and red spectra have no emission lines in common, the two sets were matched the following way: in the blue wavelength range, the strength of the emission lines was normalized to H, while in the red, the line fluxes are normalized to H. After reddening correction, the two sides are scaled assuming an intensity ratio of H/H = 2.86 (Case B, = 104 K, =100 cm-3). The blue side of our spectra is the one whose flux calibration is taken as reference.
Reddening-corrected emission-line intensities, normalized to H, are shown in Table 4, together with the values of C(H) and EWabs that provide the best match between the corrected and the theoretical Balmer line ratios. For four objects the uncertainties in C(H) are larger than the measured values, and therefore consistent with no reddening. Since [OII]3727 is the line most affected by extinction in our spectra, for these objects, we checked how much [OII]3727/H changes with and without the reddening correction. We found that the changes are within the quoted uncertainties.
The line-flux errors are calculated using the expression by Gonzalez-Delgado et al. (1994),
| (1) |
where is the standard deviation of the continuum near the emission line, is the width of the region used to measure the line in pixels, is the spectral dispersion in Å/pixel, and EW represents the equivalent width of the line. The final errors quoted in Table 4 account for the uncertainty in the extinction coefficient C(H) and include contributions of 2 due to the uncertainties in the instrument response fitting. Systematic errors are not included.
| Wavelength | MA 1 innera𝑎aa𝑎aEmission-line fluxes from the inner, HeII-emitting part of the nebula (see Section 4.1.2 for details). | BCLMP49 | BCLMP40 | HBW673 | BCLMP720 | BCLMP715 | BCLMP651 |
|---|---|---|---|---|---|---|---|
| 3727 [O II] | 54.0 7.0 | 172 7 | 195 53 | 337 182 | 280 28 | 97.0 19.0 | 215 17 |
| 3868 [Ne III] | 55.0 10.0 | 4.00 1.00 | — | 181 59 | — | 31.0 7.0 | 43.0 4.0 |
| 3889 H8+He I | 18.0 1.0 | 18.0 1.0 | — | — | 23.0 9.0 | 14.0 6.0 | 21.0 3.0 |
| 3968H7+[Ne III] | 34.0 6.0 | 14.0 1.0 | — | 77.0 43.0 | 18.0 8.0 | — | 34.0 3.0 |
| 4100 H | 25.0 4.0 | 26.0 2.0 | — | 24.0 2.0 | 26.0 9.0 | 26.0 5.0 | 29.0 3.0 |
| 4340 H | 49.0 2.0 | 47.0 1.0 | 47.0 12.0 | 48.0 10.0 | 47.0 2.0 | 47.0 3.0 | 46.0 2.0 |
| 4363 [O III] | 9.00 3.00 | — | — | 18.0 5.0 | — | — | 4.70 0.50 |
| 4471 He I | — | 4.00 0.40 | — | — | 8.00 1.00 | — | 4.60 0.50 |
| 4686 He II | 19.0 2.0 | — | — | 55.0 9.0 | — | — | 11.0 1.0 |
| 4861 H | 100 1 | 100 1 | 100 6 | 100 6.0 | 100 2 | 100 2 | 100 1 |
| 4959 [O III] | 207 1 | 47.0 1.0 | 12.0 5.0 | 554 39 | 25.0 1.0 | 160 5 | 147 2 |
| 5007 [O III] | 602 30 | 139 2 | 36.0 6.0 | 1663 119 | 73.0 2.0 | 484 14 | 440 7 |
| 5876 He I | 9.00 2.00 | 11.8 0.3 | — | 10.0 2.0 | 15.0 1.0 | 12.0 1.0 | 12.0 1.0 |
| 6300 [O I] | — | 0.70 0.10 | — | — | 1.70 0.60 | 4.00 1.00 | 3.20 0.20 |
| 6548 [N II] | 3.00 1.00 | 8.70 0.30 | 20.0 8.0 | 26.0 7.0 | 17.0 1.00 | 8.00 1.00 | 8.50 0.50 |
| 6563 H | 286 6 | 286 7 | 286 113 | 286 79 | 286 20 | 286 25 | 286 16 |
| 6584 [N II] | 6.00 1.00 | 26.0 1.0 | 58.0 23.0 | 86.0 24.0 | 53.0 4.0 | 23.0 3.0 | 24.0 1.0 |
| 6678 He I | 4.00 1.00 | 3.50 0.20 | — | — | 4.80 0.40 | 3.30 0.60 | 2.80 0.20 |
| 6717 [S II] | 8.00 1.00 | 5.10 0.30 | 30.0 9.0 | 55.0 16.0 | 43.0 3.0 | 29.0 3.0 | 25.0 2.0 |
| 6731 [S II] | 5.00 1.00 | 4.00 0.20 | 22.0 8.0 | 37.0 11.0 | 30.0 2.0 | 20.0 2.0 | 17.0 2.0 |
| 7136 [Ar III] | 8.00 1.00 | 9.30 0.40 | 4.00 1.00 | 23.0 8.0 | 6.70 0.70 | 11.0 1.0 | 9.00 1.00 |
| 9069 [S III] | 12.0 4.0 | 7.40 0.50 | 5.00 2.00 | 8.00 4.00 | 6.00 1.00 | 7.00 3.00 | 5.00 1.00 |
| 0.09 0.08 | 0.37 0.03 | 0.22 0.57 | 0.09 0.39 | 0.12 0.10 | 0.05 0.12 | 0.04 0.08 | |
| (Å) | 0.3 | 1.7 | 2.0 | 0.1 | 0.3 | 1.2 | 0.1 |
3 Nebular properties
| Parameter | MA 1a𝑎aa𝑎aNebular properties of MA 1 were derived using the emission-line fluxes from the inner, HeII-emitting part of the nebula (see Section 4.1.2 for details). | BCLMP 49 | BCLMP 40 | HBW673 | BCLMP 720 | BCLMP 715 | BCLMP651 |
|---|---|---|---|---|---|---|---|
| ([S II])(cm-3) | 100 | 159 | 100 | 100 | 100 | 100 | 100 |
| ([O III])(104 K) | 1.35 0.20 | — | — | 1.19 0.11 | — | — | 1.18 0.04 |
| ([S III])(104 K) | — | — | — | 1.17 0.12 | — | — | 1.17 0.04 |
| ([O II])(104 K) | — | — | — | 1.14 0.08 | — | — | 1.12 0.03 |
| 12 + log (O+/H+) | 6.80 0.18 | — | — | 7.82 0.26 | — | — | 7.65 0.05 |
| 12 + log (O2+/H+) | 7.92 0.15 | — | — | 8.50 0.10 | — | — | 7.94 0.04 |
| 12 + log (O/H)b𝑏bb𝑏bMA 1, HBW673, BCPLM651: O/H abundance derived using ([OIII]); BCLMP49, BCLMP40, BCLMP720,BCLMP715: O/H derived from Pettini & Pagel (2004) - O3N2 method. | 8.00 0.05 | 8.35 | 8.65 | 8.66 0.09 | 8.54 | 8.20 | 8.12 0.03 |
| 12 + log (N+/H+) | 5.77 0.12 | — | — | 7.08 0.11 | — | — | 6.55 0.03 |
| log (N/O) | -1.03 0.10 | — | — | -0.74 0.28 | — | — | -1.10 0.06 |
| 12 + log (Ne2+/H+) | 7.30 0.20 | — | — | 8.01 0.19 | — | — | 7.40 0.06 |
| log (Ne/O) | -0.62 0.09 | — | — | -0.49 0.22 | — | — | -0.54 0.07 |
| 12 + log (S+/H+) | 5.19 0.10 | — | — | 6.19 0.11 | — | — | 5.86 0.03 |
| 12 + log (S2+/H+) | 6.26 0.09 | — | — | 6.18 0.08 | — | — | 5.98 0.03 |
| 12 + log (S/H) | 6.47 0.10 | — | — | 6.67 0.09 | — | — | 6.26 0.03 |
| 12 + log (Ar2+/H+) | 5.58 0.11 | — | — | 6.17 0.08 | — | — | 5.76 0.03 |
| 12 + log (Ar/H) | 5.73 0.11 | — | — | 6.21 0.08 | — | — | 5.79 0.03 |
| log ([OII]/[OIII])c𝑐cc𝑐c[OII]3727/[OIII]4959,5007. | -1.18 0.06 | -0.03 0.02 | 0.61 0.24 | -0.82 0.24 | 0.45 0.04 | -0.82 0.09 | -0.44 0.03 |
| log ([SII]/[SIII])d𝑑dd𝑑d[SII]6717,6731/[SIII]9069 | 0.03 0.07 | 0.09 0.03 | 1.02 0.14 | 1.06 0.11 | 1.09 0.04 | 0.85 0.21 | 0.92 0.03 |
For our seven HII regions, we calculated the physical properties of the ionized gas in the HeII-emitting zone (see Figure 3). Physical conditions and chemical abundances for the HII regions are given in Table 5. The quoted uncertainties account for measurement and reddening coefficient errors. Electron densities, electron temperatures and ionic abundances of the ionized gas were derived using the IRAF nebular package (Shaw & Dufour 1994). We obtained the electron densities, , from the [SII]6717/6731 line ratio. The derived estimates and upper limits for place all of the HII regions in the low-density regime ( 100 cm-3).
We were able to measure the faint auroral line [OIII]4363 from the spectra of the three confirmed HeII nebulae: MA 1, BCLMP 651, HBW 673. For these three objects, we derived the electron temperatures ([OIII]) ( = 10-4 x ) using the [OIII]4363/[OIII]4959,5007 line ratio. For MA 1, since there is a gradient in between the innermost, HeII-emitting region (13,500 K) and the outer region (10,000 K), we measure the physical properties and chemical abundances from the innermost region. Also, we find MA 1 to be density bounded, and so the ionic species are more co-spatial (see Section 4.1.2 for more details on the MA 1 nebula); we therefore derive the chemical abundances of the different elements assuming a single, observed temperature.
For BCLMP 651 and HBW673, ([OII]) was calculated from the relation between [OII] and [OIII] electron temperatures given by Pilyugin et al. (2006): ([OII]) = 0.72([OIII])+0.26. Since no auroral line could be measured in the low excitation zone, we assumed the approximation ([SII]) ([NII]) ([OII]) to be valid. As we did not detect the line [SIII]6312 in any of our objects, a theoretical relation between [OIII] and [SIII] electron temperatures was used for BCLMP651 and HBW673: ([SIII]) = 1.05([OIII]) - 0.08 (Pérez-Montero & Díaz 2005). This relation differs slightly from the empirical relation found by Garnett (1992), mostly due to the introduction of the new atomic coefficients for S2+ from Tayal & Gupta (1999).
In order to derive the chemical abundances we followed as summarized below.
Oxygen. A small fraction of oxygen is expected to be in the form of the O3+ ion in HII regions which show high-ionization emission lines like HeII4686. According to the photoionization models from Izotov et al. (2006b), the O3+/O is 1 only in the highest-excitation HII regions for which O+/(O+ + O2+) 10, as in the case of MA 1 and HBW673. Thus, in order to derive the total oxygen abundances for these two objects, we proceed as following. For MA 1 we assumed O3+/(O+ + O2+) = 4.43, as obtained from a detailed photoionization model of this object (see Section4.1.2).
In the case of HBW673, we added the fraction of the unseen O3+ ion in its oxygen abundance following the prescription by Izotov et al. (2006b), that gives O3+/(O+ + O2+) 0.19. We also checked that using the oxygen ionization correction factor (ICF) from the MA1 photoionization model shifts the total oxygen abundance of HBW673 by 0.06 dex, that is within the quoted uncertainty. For BCLMP651 we set O3+/H+ to zero, since it shows O+/(O+ + O2+) 10, and assume O/H = (O+/H+) + (O++/H+).
To obtain the oxygen abundances in those HII regions in which [OIII]4363 could not be measured, we applied a commonly used, strong-line method from Pettini & Pagel (2004): the O3N2 index [log([OIII]5007/H)/([NII]6584/H)], whose associated uncertainty is 0.25 dex. Nevertheless one should bear in mind that calibrations of different strong-line indices provide different metallicities (see Bresolin et al. 2009 and references therein for a more detailed discussion).
Sulfur and argon. We derive S+/H+ abundances from the fluxes of the [SII]6717,6731 emission lines. Abundances of S2+/H+ were obtained from the flux of the [SIII]9069 line. We calculate the abundance of Ar2+/H+ from the emission of [ArIII]7136, assuming ([ArIII]) ([SIII]) (Garnett 1992). To derive the total argon and sulfur abundances for BCLMP651 and HBW673, we adopted the metallicity-dependent ICFs of Izotov et al. (2006b). In the case of MA 1, we assume Ar+/Ar2+ = 0.016, Ar3+/Ar2+ = 0.378, and S3+/(S+ + S2+) = 0.512, taken from our photoionization modeling of the MA 1 nebula (see Section 4.1.2).
Nitrogen and neon. We calculated the N/O and Ne/O abundance ratios assuming that N/O=N+/O+ and Ne/O = Ne++/O++, based on the similarity of the ionization potentials of the ions involved (Peimbert & Costero 1969). This ICF scheme has been used in previous work (e.g., López-Sánchez et al. 2007; Hägele et al. 2008; Bresolin et al. 2009) and is a good approximation for high ionization degree objects. In our spectra, neon is seen via the [NeIII] emission line at 3869 Å. For this ion, we also took the [OIII] electron temperature as representative of the high-excitation zone, in BCLMP 651 and HBW673.
Figure 9 shows the standard [OIII]5007/H versus [NII]6584/H diagnostic diagram (Baldwin et al. 1981; hereafter BPT) for our sample of seven candidates HeII-emitting nebulae. The solid curve, from Kauffmann et al. (2003), separates objects photoionized by purely thermal (stellar) sources from regions that are excited by additional processes. The majority of our objects are found in the zone of objects photoionized by thermal sources. However, HBW 673, one of our HeII nebulae, is the only object located outside of this zone (see Section 4.2 for a more detailed discussion of HBW 673).
4 Description of the individual HeII nebulae
4.1 MA 1
This object is Number 1 in the list of emission-line nebulae in M33 by Mayall & Aller (1942). MA 1 is one of the first HeII nebulae identified in a spiral galaxy beyond the Milky Way (Garnett et al. 1992) and is one of McCall’s four “Rosetta Stone” extragalactic HII regions (McCall 1982). It shows a complex morphology of arcs, loops, and filaments having a diameter of 50 (200 pc at our assumed distance of 840 kpc) as seen from the H image (see Figure 3). MA 1 is one of the outermost known HII regions in M33, located about 30, or 7.3 kpc, from the nucleus.
We obtain 12 + log(O/H) 8.00 for MA 1, consistent with previous work, which demonstrated the low O/H of this nebula (e.g., Massey 1985; Garnett et al. 1992; Crockett et al. 2006). The line intensities in this HII region are similar to values seen in metal-poor HII galaxies (see Kehrig et al. 2004, Figure 14). The presence of HeII4686 emission in MA 1 was reported by Garnett et al. (1992) and Crockett et al. (2006). The latter showed that the HeII emission is nebular in nature but they did not identify the source of He+-ionizing photons in MA 1. The high log([OIII]/H) of 0.78 (see Table 4), confirms the unsually high excitation and ionization state of this nebula (e.g., RS08), which is unusual for HII regions with similar O/H. Our spectrum of MA 1 confirms that the nebular HeII emission is spatially extended (Figure 7); its observed HeII4686/H = 0.19 is consistent with that found for some other metal-poor HII regions excited by WNE stars (e.g., N76 in the SMC; see Table 9). Below, we investigate whether the early-type WN star MC8 [Massey & Conti (1983) alias M33-WR14 (MJ98)], is capable of supplying the high energy photons required for He II nebular emission from MA 1.
4.1.1 Stellar atmosphere models for the WN source MC8
Here, we investigate whether the early-type WN star MC8 [Massey & Conti (1983) alias M33-WR14 (MJ98)], is capable of supplying the high energy photons required for He II nebular emission from MA 1. Stellar atmosphere models are constructed using the code CMFGEN (Hillier & Miller 1998), which solves the radiative transfer equation in the co-moving frame, under the additional constraints of statistical and radiative equilibrium.
From Figure 3, the early type WN source MC8 is by far the brightest source within the MA 1 nebula. Indeed, ground-based photometry from Massey et al. (2006) indicates V = 16.14 mag, from which E(B-V)=0.06 mag (via = 0.09) implies = –8.7 mag for our assumed distance of 840 kpc. In contrast, absolute magnitudes of WN-type stars in the Large Magellanic Cloud range from –2 to –7.5 mag (Crockett et al. 2007), with = –4 mag typical for single early-type WN stars. In addition, the stellar He II 4686 equivalent width is 3 Å, versus 30–500 Å for LMC single, early-type WN stars (Crowther & Hadfield 2006). The properties of MC8 are therefore consistent with a WN star located within a compact, young star cluster such as Brey 65 in the LMC (Walborn et al. 1999), in which the He II 4686 emission strength is severely diluted by other cluster members (mostly O, B and A stars). Alternatively, could MC8 be an Of supergiant, since they possess much weaker He II 4686 emission than WN stars plus brighter absolute magnitudes of = –7 mag. We are able to discriminate between these two possibilies since Of supergiants possess narrow 4686 emission, with FWHM2–7Å (Crowther et al. 2002b) versus FWHM = 25-60 Å for early-type WN stars (Crowther & Hadfield 2006). From our MC8 Gemini GMOS spectrum, He II 4686 emission is broad (FWHM 30 Å), allowing us to conclude that MC8 is a probable cluster hosting an early-type WN star.
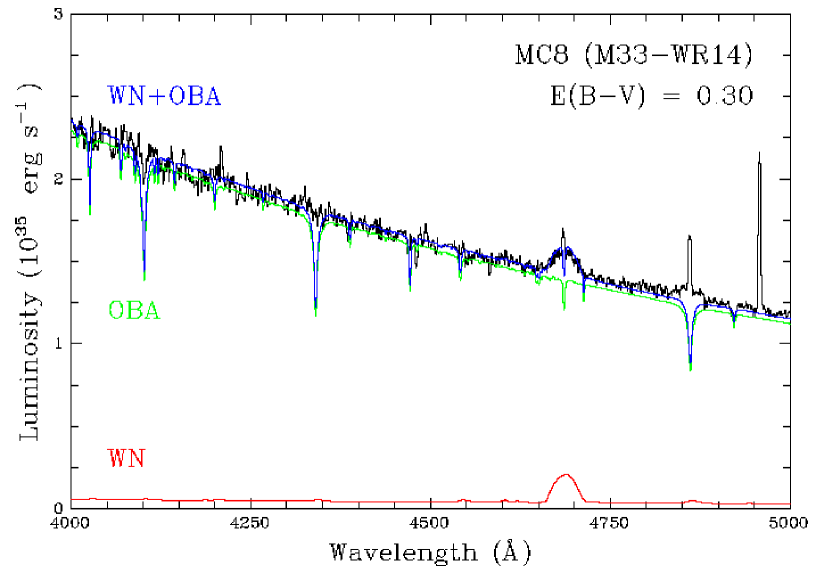
Therefore, in our analysis of MC8 we are unable to fix the absolute magnitude of the early-type WN star, and instead focus upon reproducing the line luminosity of He II 4686. We have convolved the GMOS spectrum of MC8 with standard filters, from which synthetic photometry of V = 17.35 mag (and B–V = 0.09 mag) is obtained, indicating that 50 of the continuum light from the MC8 source is included within the slit (recall Figure 3). Fortunately, since the WN star is included, we are able to estimate its He II 4686 line luminosity. To assess the extinction, we have compared the GMOS spectrum to a 3 Myr old, instantaneous burst, LMC metallicity starburst99 (Leitherer et al. 1999) evolutionary synthesis model. An extinction of E(B-V) = 0.30 mag is required to reproduce the spectral energy distribution of the GMOS dataset (Figure 10), from which we obtain a 4686 line luminosity of 4.5 1035 erg s-1 for the WN star, versus an average of 8.4 7.1 1035 erg s-1 for LMC early-type WN stars (Crowther & Hadfield 2006).
In addition, we are unable to derive a stellar temperature for the WN star since 4686 is the sole diagnostic available to us. In view of the limitations imposed by the sparse continuum and line constraints, we have calculated generic stellar atmosphere models for the WN star hosted by MC8 using CMFGEN. Our approach mimics the study of HD 9974 (WN3) by Marchenko et al. (2004) except for more extensive model atoms: H I, He I-II, C IV, N III-V, O III-VI, Ne IV-V, Si IV, S IV-V, Ar V-VII, Ca V-VII, Fe IV-VII, Ni IV-VII, totalling 822 super-levels (23,098 lines). Other than H, He, CNO we adopt solar abundances (Asplund et al. 2009), scaled to 0.3 Z⊙ (see Table 5). In the absence of CNO features, we adopt equilibrium WN abundances, namely X(N)=0.2%, X(C)=X(O)=0.03%. With regard to wind clumping (Hillier 1991), this is incorporated using a radially-dependent volume filling factor, , with = 0.1 at terminal velocity , resulting in a reduction in mass-loss rate by a factor of 3.
In the absence of Wolf-Rayet temperature diagnostics from our GMOS dataset of MC8, Rühling (2008) has undertaken spectral analyses of all WN stars in the LMC including 50 WN3–4 stars. From this comprehensive study, an average of = 90 30 kK was obtained that we shall adopt here for the WN star in MA8. As discussed previously (e.g., Schmutz et al. 1992; Schaerer 2002), the wind density of WN atmospheres can dictate the hardness of their ionizing fluxes more significantly than stellar temperature. We demonstrate this effect by selecting three stellar luminosities of the WN component, namely log L/ = 5.3, 5.6 and 5.9, which correspond to stellar masses of 10, 16 and 25 (Schaerer & Maeder 1992), spanning a representative range for WN stars (Crowther 2007). For these three cases, the (clumped) mass-loss rate required to reproduce the He II 4686 feature was relatively uniform, 0.8, 1.1, 1.2 yr-1, respectively, with 1750 km s-1 for each case. However, since the stellar luminosity varies by a factor of four, the wind becomes progressively more transparent at higher luminosity, hardening the ionizing spectrum, as revealed by the number of He+ ionizing photons, , shown in Table 6 for each model atmosphere. In Figure 10 we compare the de-reddened GMOS spectrum of MC8 with both the cluster spectral energy distribution and high luminosity WN model.
| Parameter | log / = 5.3 | log /= 5.6 | log / = 5.9 |
|---|---|---|---|
| (kK)a | 90 | 90 | 90 |
| (kK)a | 78 | 80 | 85 |
| dM/dt (10-5 M⊙ yr-1) | 0.8 | 1.1 | 1.2 |
| MV (mag) | -3.4 | -4.0 | -4.4 |
| log Q0 | 49.16 | 49.47 | 49.76 |
| log Q1 | 48.92 | 49.24 | 49.55 |
| log Q2 | 38.40 | 46.46 | 48.32 |
4.1.2 Photoionization modeling of the MA 1 nebula
We now model the MA1 HII region with the photoionization code CLOUDY, v. C08.00 (Ferland et al. 1998), using these stellar atmosphere models for MC8 to define the ionizing spectral energy distribution. While we do not know which, if any, of the three atmosphere models is representative of MC8, our purpose here is to investigate feasibility. We adopt the measured chemical abundances in the central region listed in Table 5, which are consistent with the reported abundance gradient in M33 (e.g., RS08). He II emission is emitted fairly uniformly within the inner nebula, 22 pc in radius. In addition, the outer region of the nebula has a complex morphology extending up to a radius of 60 pc [see Figure 2 and Figure 7 (top panel)]. To account for these distinct nebular components we construct a two-zone photoionization model, composed of an inner and outer region, each with a constant density listed in Table 7. A constant cosmic ray energy density of (Williams et al. 1998) is included, but is negligible.
Of the three atmosphere models, solely the model illuminated by the highest luminosity (log = 5.9) atmosphere is capable of reproducing the observed HeII emission, for the observed ionization parameters log , where , is the H-ionizing photon emission rate, and is the Strömgren radius. The parameters for the two parts of this model nebula are listed in Table 7.We self consistently use the emergent radiation transmitted through the highly ionized gas of the inner region as the ionization source of the outer region beyond the He II emission, accounting for an observed difference in between the inner region (13,500 K) and outer region (10,000 K). The two lower-luminosity WN atmospheres predict the nebular intensity of HeII4686/H to be orders of magnitude lower than observed, and they are not capable of producing nebular He II 4686 emission with realistic choices of metallicity and .
Table 8 shows good agreement between the observed nebular line strengths and the photoionization model. The standard deviation between the observed and predicted emission is 17, excluding [SIII], which is affected by telluric absorption. These models demonstrate that the SED of the log = 5.9 atmosphere is a plausible ionization source for the surrounding nebula, without a need to invoke additional ionization sources. We note that the central line of sight is optically thin: the 2-D morphology revealed by the images and the weakness of [OII] relative to [OIII] indicates that an ionization front is not present in the line of sight toward the He II nebula, consistent with our model. Early spectral observations by McCall (1982) also suggested parts of the nebula to be density bounded based on the [OII] / [OIII] ratio.
While neither our model stellar atmosphere nor model nebula is necessarily meant be an accurate physical representation of this region, the reasonable agreement demonstrates that the observed star is indeed capable of reproducing the observed nebula.
| Parameter | Inner region | Outer region |
|---|---|---|
| Log (cm3) | 1.85 | 0.95 |
| Log (cm) | 19.50 | 19.91 |
| Log (cm) | 19.78 | 20.09 |
| (km/s) | 4.0 | 4.0 |
| 12 + log (He/H) | 11.0 | 11.0 |
| 12 + log (O/H) | 8.00 | 8.00 |
| 12 + log (N/H) | 6.97 | 6.97 |
| 12 + log (Ne/H) | 7.38 | 7.38 |
| 12 + log (S/H) | 6.47 | 6.47 |
| 12 + log (Ar/H) | 5.73 | 5.73 |
| Wavelength | MA 1 Inner | Inner model | MA 1 Outer | Outer model |
|---|---|---|---|---|
| 3727 [O II] | 54.0 7.0 | 56.0 | 78.6 1.7 | 81.7 |
| 3868 [Ne III] | 55.0 10.0 | 70.0 | 47.3 1.0 | 64.0 |
| 4363 [O III] | 9.00 3.00 | 10.00 | 3.50 0.50 | 8.00 |
| 4686 He II | 19.0 2.0 | 17.0 | 0.10 0.20 | 0.30 |
| 4861 H | 100 1 | 100 | 100 1 | 100 |
| 5007 [O III] | 602 30 | 612 | 556 28 | 569 |
| 5876 He I | 9.00 2.00 | 10.70 | 13.0 2.6 | 12.2 |
| 6584 [N II] | 6.00 1.00 | 6.40 | 12.1 1.2 | 10.1 |
| 6678 He I | 4.00 1.00 | 3.00 | 2.60 0.40 | 3.40 |
| 6717,6731 [S II] | 13.0 1.0 | 13.4 | 26.5 2.0 | 19.0 |
| 7136 [Ar III] | 8.00 1.00 | 8.40 | 8.90 0.40 | 9.30 |
| 9069 [S III] | 12.0 4.0 | 21.1 | 29.1 1.2 | 23.6 |
4.2 HBW673
HBW673 is a relatively faint and small HII region about 2 kpc from the center of the galaxy. Its diameter is roughly 20 ( 80 pc at our assumed distance of 840 kpc), as measured from the image, and in contrast to MA 1, HBW673 does not show a complex morphology (see Figure 3). From Figure 7 (bottom) we can see that there is no obvious star associated with HBW673. The spectrum of HBW673 has very strong emission at 4686 showing one of the highest values of HeII4686/H=0.55 observed among the local HeII nebulae (see Table 9). In addition, HBW673 exhibits extremely high excitation in [OIII] and in [NeIII] (see Table 4).
The spectrum of HBW673 is not that of a SNR, lacking the variety of different ions that are shock-excited in classical SNRs (e.g., Blair et al. 1981). A PN-type nature of HBW673 is also ruled out. The typical size of a Galactic PN is some tenths of a parsec (e.g., Peimbert 1990), while evolved PNe have been found with sizes of up to 4 pc (e.g., Corradi et al. 1997). At our assumed distance of 840 kpc to M33, 1 corresponds to 4 pc and therefore any extended emission region in our images is not considered to be a PN. Such high relative fluxes of the HeII4686 emission line indicate that radiation with photon energies greater than 4 Rydberg is intense, and difficult to explain by ionizing stellar radiation (e.g., Thuan & Izotov 2005; Izotov et al. 2004). In addition, the BPT diagnostic diagram (Figure 9) for our sample of HII regions shows that HBW 673 is outside the zone of normal HII regions. This suggests that the main excitation mechanism in HBW673 is not a hot stellar continuum, but another ionization source. HBW673 is not coincident with any known X-ray sources.
4.3 BCLMP651
The third HeII nebula we identified is BCLMP651 with a diameter of 30 (120 pc at our assumed distance of 840 kpc). The nebular morphology consists of a bright knot on the southeast side, and a second, fainter one on the northwest side of the nebula. For BCLMP651 there does not appear to be any WR star responsible for the extended HeII emission. Figure 7 (middle) shows that the nebular HeII emission is placed between two continuum sources. We were not able to detect any obvious stellar features in our spectra of these objects, which only have S/N . Like the other HeII nebulae, BCLMP651 is also a high-excitation object, with e.g., high [NeIII]/H=0.40, in comparison to the other five HII regions for which we do not see nebular HeII emission (see Table 4). This object also is not coincident with any known X-ray source.
5 Discussion
From our sample of seven candidate HeII nebulae in M33, we confirm the presence of nebular HeII4686 emission line in the spectra of three objects: MA 1, HBW673 and BCLMP651. In addition to MA 1, there are four more confirmed He II nebulae ionized by WN stars in the Local Group: LMC N79 (Pakull 1991), LMC N206 (Niemela et al. 1991), SMC N76 (Testor & Pakull 1989; Garnett et al. 1991) and NGC 249 (Pakull 2009) in the SMC. However, WN stars are not the only sources capable to ionize HeII. The Galactic nebula G2.4+1.4 and the S3 nebula in IC 1613 exhibit nebular HeII emission associated with WO stars (Johnson 1975; Dopita et al. 1990; Davidson & Kinman 1982; Garnett et al. 1991), while the nebular He II emission in LMC N44C is puzzling since emission is centered on an O7 star (Garnett et al. 2000) which is not expected to be hot enough to produce He+-ionizing photons. Pakull & Motch (1989) have proposed N44C to be a fossil X-ray ionized nebula, but a clearer view of this object is still needed (see Garnett et al. 2000)
Among our sample, the HeII nebulae HBW673 and BCLMP651 are also intriguing objects. The former does not seem to be associated with any hot star. Yet, except for the presence of strong nebular HeII emission, it shows a fairly normal, highly excited, HII region spectrum. Moreover, electron temperatures in these nebulae are not unusally high ( 12,000 K).
RS08 have analysed Keck spectra of 61 HII regions in M33, and detected HeII4686 emission from five of these objects (BCLMP38b, C001Ab, BCLMP711a, BCLMP90, BCLMP208f). They claim the HeII4686 emission is almost certainly nebular as it is spatially resolved in these five HII regions. Their strongest source, BCLMP38b, was also detected in our continuum-subtracted He II image, but it was compact and unresolved, and so we were not able to identify it as an extended He II nebula. Magrini et al. (2007) also report the existence of HeII emission in three M33 HII regions (BCLMP258b, BCLMP220, BCLMP45). Doing a coordinate cross-reference with the catalog of WR stars in M33 (Massey et al. 2006), we find that with the exception of BCLMP38b, no HeII nebula presented by RS08 and Magrini et al. (2007) appears to be associated with a WR star. The object BCLMP38b appears to be associated with the WC star MC45 (M33-WR76), which might be responsible for the ionization in the nebula, although no WC stars are currently known to ionize He II nebulae. A more detailed study is necessary to assess whether MC45 is the He II-ionizing source.
| Galaxy | Region | 12+log(O/H) | Ionizing source | Spectral type | HeII4686/H [F(H)=100] | Referencesb𝑏bb𝑏b(1) Abbott et al. (2004); (2) Davidson & Kinman (1982); (3) Dopita et al. (1990); (4) Esteban et al. (1992); (5) Garnett et al. (1991); (6) Garnett et al. (2000); (7) Johnson (1975); (8) Kehrig et al. (this paper); (9) Kingsburgh & Barlow (1995); (10) Nazé et al. (2003a); (11) Nazé et al. (2003b); (12) Niemela et al. (1991); (13) Pakull & Angebault (1986); (14) Pakull & Motch (1989); (15) Pakull (1991); (16) Pakull (2009); (17) Polcaro et al. (1995); (18) Rosolowsky & Simon (2008); (19) Testor & Pakull (1989) |
|---|---|---|---|---|---|---|
| MW | G2.4+1.4 | 8.45 | WR102 | WO2 | 40-120 | 7, 3, 4, 17 |
| LMC | N44C | 8.32 | X-5? | X-ray Neb? | 2-14 | 14, 6 |
| LMC | N159 | 8.36a𝑎aa𝑎aThe stellar temperature, , is derived from the Stefan-Boltzmann relation, with the stellar radius defined at a Rosseland optical depth of =20. The effective temperature, , is similarly derived, using the effective radius defined at =2/3. | X-1 | HMXB | 5 | 13, 5 |
| LMC | N79 | 8.17-8.27 | BAT99-2 | WN2b(h) | 21-56 | 15, 11 |
| LMC | N206 | 8.36 | BAT99-49 | WN4:b+O8V | 8-10 | 12, 10 |
| SMC | N76 | 7.93 | AB7 | WN4+O6I(f) | 16-24 | 19, 5, 10 |
| SMC | NGC249 | 8.11a𝑎aa𝑎aFor LMC N159 and SMC NGC249, since no metallicity measurement has been reported in the literature, we show the average values of the LMC and SMC oxygen abundance from Russell & Dopita (1990) | SMC-WR10 | WN3ha | 16 | |
| IC1613 | S3 | 7.70 | WO3 | 23 | 2, 5, 9 | |
| M33 | BCLMP38b | 8.39 | MC45 | WC4 | 17 | 18, 1 |
| M33 | BCLMP90 | 8.50 | no obvious hot star associated | 8 | 18 | |
| M33 | C001Ab | 8.61 | no obvious hot star associated | 2 | 18 | |
| M33 | BCLMP208f | 8.07 | no obvious hot star associated | 3 | 18 | |
| M33 | BCLMP711a | 8.28 | no obvious hot star associated | 4 | 18 | |
| M33 | MA 1 | 8.00 | MC8 | WNE | 19 | 8 |
| M33 | HBW673 | 8.66 | no obvious hot star associated | 55 | 8 | |
| M33 | BCLMP651 | 8.12 | no obvious hot star associated | 11 | 8 |
Table 9 summarizes the HII regions with confirmed nebular He II 4686 emission detected so far in the Local Group. The ionizing sources are apparently quite heterogenous. As discussed previously, the HeII-ionizing sources of M33 HBW673, M33 BCLMP651 and LMC N44C are still unknown. In several studies of nebular HeII emission in BCDs, Izotov and collaborators (e.g., Thuan & Izotov 2005; Izotov et al. 2006a) find the presence of nebular HeII4686 emission even at large distances from young clusters, indicating that mechanisms other than stellar photoionization (e.g., shocks or high-mass X-ray binaries) seem to be present, at least in some objects. A similar result was found by Monreal-Ibero et al. (2010). These authors studied the ionized gas and massive stellar population in the HII galaxy NGC 5253, and found that the nebular HeII4686 emissions to be, in general, not coincident with WR stars. One can easily envision a mixture of different contributions, including possibly from SNRs, to the observed HeII emission beyond the Local Group. We should also stress that from our survey for HeII nebulae in M33, we identified five SNRs with HeII emission. Thus, SNRs or shock-excited objects (e.g., Pakull et al. 2010) can also be responsible for some HeII nebulae.
Even among the WR HeII nebulae, the ionizing stars show different spectral types (Table 9) and at present, it is not possible to look for systematic properties that differentiate the HeII-ionizing WR stars from the remainder of them due to the relatively small number of local WR HeII nebulae detected so far. However, an association of nebular HeII emission with WR stars (e.g., MA 1) in low-metallicity environments seems to exist. Model atmospheres of Smith et al. (2002) predict that low wind densities favour transparent winds such that only weak winds are expected to produce a significant He+ continuum below 228 Å. Since mass-loss rates of WR stars are predicted (Vink & de Koter 2005) and observed to scale with metallicity (Crowther et al. 2002a), it is expected that HeII nebulae are preferentially associated with WR stars in metal-poor regions. Indeed, seven of the eight WR stars which exhibit nebular HeII are in nebulae with 12 + log(O/H) 8.4 (see Table 9).
6 Summary
To investigate the properties of HeII nebulae and the origin of the nebular HeII4686 emission, we have carried out a survey for HeII nebulae in the Local Group galaxy M33. Due to its proximity, M33 allows HII regions excited by few/single stars to be resolved. Since M33 shows a well defined metallicity gradient, this galaxy also offers the opportunity to probe the metallicity dependence of the nebular HeII line formation and strength. The rarity of HII regions which show nebular HeII among Local Group galaxies illustrates the significance of such regions within M33.
From our HeII narrow-band imaging of M33, we identified seven candidates for HeII nebulae, for which we obtained follow-up optical spectra. We detect nebular HeII emission in the spectra of three of the seven candidate HII regions: MA 1, BCLMP651, and HBW673, the latter two being newly confirmed HeII nebulae. All three are high-excitation HII regions.
We have assessed whether the observed early-type WN star MC8 is a plausible source for the hard ionizing radiation of MA 1 through a combined stellar and nebular analysis. A high luminosity, relatively transparent WN wind is capable of reproducing the nebular properties, although MC8 is almost certainly an unresolved star cluster (cf. Brey 65 and Brey 73 in LMC; Walborn et al. 1999).
The absence of a hot WR star in BCLMP651 and HBW673 suggests possible similarities with N44C and N159 in the LMC, where the high excitation is linked to possible X-ray sources within the nebulae. To date, however, no X-ray counterpart has been linked to either HBW673 or BCLMP651. In HBW673, the highest-excitation object in our sample, the presence of a hard radiation source other than a hot stellar continuum is indicated by the BPT diagnostic diagram (Figure 9). At present we are unable to identify the likely source powering the emission in BCLMP 651 and HBW 673. Further study of these two objects, which contribute to the heterogeneity of ionizing sources, is required. Additional study of local HII regions with He II emission are needed to lead us to a clearer understanding of the sources of nebular HeII emission before their applicability to starbursts can be properly assessed.
Acknowledgements
Our gratitude to the NOAO Gemini Science Center and Gemini Observatory staff, including Kevin Volk, Dara Norman and Jennifer Holt. We wish to thank the anonymous referee for his/her useful comments and suggestions. MSO and CK acknowledge support from the National Science Foundation, grants AST-0448893 and AST-0806476. CK, as a Humboldt Fellow, acknowledges support from the Alexander von Humboldt Foundation, Germany. OS acknowledges support from the Science and Technology Facilities Council, UK. DS is supported by the Swiss National Science Foundation. We thank E. Rosolowsky and J.D. Simon for providing us with their Keck/LRIS datasets. This work is based on observations obtained in programs GN-2006B-Q83 and GN-2008B-C5, at the Gemini Observatory, which is operated by AURA under a cooperative agreement with the NSF on behalf of the Gemini partnership: the National Science Foundation (United States), the Science and Technology Facilities Council (United Kingdom), the National Research Council (Canada), CONICYT (Chile), the Australian Research Council (Australia), CNPq (Brazil) and CONICET (Argentina).
References
- Abbott et al. (2004) Abbott, J. B., Crowther P. A., Drissen, L. et al. 2004, MNRAS, 350, 552
- Armandroff & Massey (1985) Armandroff, T. E., & Massey, P. 1985, ApJ, 291, 685
- Asplund et al. (2009) Asplund, M., Grevesse, N., Sauval, A. J., & Scott, P. 2009, ARA&A, 47, 481
- Baldwin et al. (1981) Baldwin, J. A., Phillips, M. M., & Terlevich, R. 1981, PASP, 93, 5
- Blair et al. (1981) Blair, W. P., Kirshner, R. P., & Chevalier, R. A. 1981, ApJ, 247, 879
- Boulesteix et al. (1974) Boulesteix, J., Courtes, G., Laval, A., Monnet, G., & Petit, H. 1974, A&A, 37, 33
- Bresolin et al. (2009) Bresolin, F., Gieren, W., Kudritzki, R.-P., Pietrzyński, G., Urbaneja, M. A.,& Carraro, G. 2009, ApJ, 700, 309
- Brinchmann et al. (2008) Brinchmann, J., Kunth, D., & Durret, F. 2008, A&A, 485, 657
- Cardelli et al. (1989) Cardelli, J. A., Clayton, G. C., & Mathis, J. S. 1989, ApJ, 345, 245
- Cerviño et al. (2002) Cerviño, M., Mas-Hesse, J. M., & Kunth, D. 2002, A&A, 392, 19
- Corradi et al. (1997) Corradi, R. L. M., Perinotto, M., Schwarz, H. E., & Claeskens, J.-F. 1997, A&A, 322, 975
- Corral (1996) Corral, L. J. 1996, AJ, 112, 1450
- Crockett et al. (2006) Crockett, N. R., Garnett, D. R., Massey, P., & Jacoby, G. 2006, ApJ, 637, 741
- Crockett et al. (2007) Crockett, R. M., et al. 2007, MNRAS, 381, 835
- Crowther et al. (1995) Crowther, P. A., Hillier, D. J., & Smith, L. J. 1995, A&A, 293, 403
- Crowther et al. (1998) Crowther, P. A., De Marco, O., & Barlow, M. J. 1998, MNRAS, 296, 367
- Crowther et al. (1999) Crowther, P. A., Pasquali, A., De Marco, O. et al. 1999, A&A, 350, 1007
- Crowther et al. (2002a) Crowther, P. A., Dessart, L., Hillier, D. J., Abbott, J. B., & Fullerton, A. W. 2002, A&A, 392, 653
- Crowther et al. (2002b) Crowther, P. A., Hillier, D. J., Evans, C. J., Fullerton, A. W., De Marco, O., & Willis, A. J. 2002, ApJ, 579, 774
- Crowther & Hadfield (2006) Crowther, P. A., & Hadfield, L. J. 2006, A&A, 449, 711
- Crowther (2007) Crowther, P. A. 2007, ARA&A, 45, 177
- Davidson & Kinman (1982) Davidson, K., & Kinman, T. D. 1982, PASP, 94, 634
- Dawson et al. (2004) Dawson, S., et al. 2004, ApJ, 617, 707
- de Mello et al. (1998) de Mello, D. F., Schaerer, D., Heldmann, J., & Leitherer, C. 1998, ApJ, 507, 199
- Dopita et al. (1990) Dopita, M. A., McGregor, P. J., Rawlings, S. J., & Lozinskaia, T. A. 1990, ApJ, 351, 563
- Drissen et al. (1993) Drissen, L., Moffat, A. F. J., & Shara, M. M. 1993, AJ, 105, 1400
- Drissen et al. (2008) Drissen, L., Crowther, P. A., Ubeda, L., & Martin, P. 2008, MNRAS, 389, 1033
- Esteban et al. (1992) Esteban, C., Vilchez, J. M., Smith, L. J., & Clegg, R. E. S. 1992, A&A, 259, 629
- Ferland et al. (1998) Ferland, G. J., Korista, K. T., Verner, D. A. et al. 1998, PASP, 110, 761
- Freedman et al. (2001) Freedman, W. L., et al. 2001, ApJ, 553, 47
- Garnett et al. (1991) Garnett, D. R., Kennicutt, R. C., Jr., Chu, Y.-H., & Skillman, E. D. 1991, ApJ, 373, 458
- Garnett et al. (1992) Garnett, D. R., Odewahn, S. C., & Skillman, E. D. 1992, AJ, 104, 1714
- Garnett (1992) Garnett, D. R. 1992, AJ, 103, 1330
- Garnett et al. (2000) Garnett, D. R., Galarza, V. C., & Chu, Y.-H. 2000, ApJ, 545, 251
- Gonzalez-Delgado et al. (1994) Gonzalez-Delgado, R. M., et al. 1994, ApJ, 437, 239
- Guseva et al. (2000) Guseva, N. G., Izotov, Y. I., & Thuan, T. X. 2000, ApJ, 531, 776
- Hägele et al. (2008) Hägele, G. F., Díaz, Á. I., Terlevich, E. et al. 2008, MNRAS, 383, 209
- Hamann & Koesterke (1998) Hamann, W.-R., & Koesterke, L. 1998, A&A, 333, 251
- Hillier (1991) Hillier, D. J. 1991, A&A, 247, 455
- Hillier & Miller (1998) Hillier, D. J., & Miller, D. L. 1998, ApJ, 496, 407
- Hodge et al. (1999) Hodge, P. W., Balsley, J., Wyder, T. K., & Skelton, B. P. 1999, PASP, 111, 685
- Hook et al. (2004) Hook, I. M., Jørgensen, I., Allington-Smith, J. R. et al. 2004, PASP, 116, 425
- Izotov et al. (2004) Izotov, Y. I., Noeske, K. G., Guseva, N. G. et al. 2004, A&A, 415, L27
- Izotov et al. (2006a) Izotov, Y. I., Schaerer, D., Blecha, A. et al. 2006, A&A, 459, 71
- Izotov et al. (2006b) Izotov, Y. I., Stasińska, G., Meynet, G., Guseva, N. G., & Thuan, T. X. 2006, A&A, 448, 955
- Johnson (1975) Johnson, H. M. 1975, ApJ, 198, 111
- Kauffmann et al. (2003) Kauffmann, G., et al. 2003, MNRAS, 346, 1055
- Kehrig et al. (2004) Kehrig, C., Telles, E., & Cuisinier, F. 2004, AJ, 128, 1141
- Kehrig et al. (2008) Kehrig, C., Vílchez, J. M., Sánchez, S. F., Telles, E., Pérez-Montero, E., & Martín-Gordón, D. 2008, A&A, 477, 813
- Kingsburgh & Barlow (1995) Kingsburgh, R. L., & Barlow, M. J. 1995, A&A, 295, 171
- Kobulnicky & Skillman (1996) Kobulnicky, H. A., & Skillman, E. D. 1996, ApJ, 471, 211
- Kobulnicky et al. (1999) Kobulnicky, H. A., Kennicutt, R. C., Jr., & Pizagno, J. L. 1999, ApJ, 514, 544
- Kudritzki (2002) Kudritzki, R. P. 2002, ApJ, 577, 389
- Kunth & Sargent (1981) Kunth, D., & Sargent, W. L. W. 1981, A&A, 101, L5
- Leitherer et al. (1999) Leitherer C., Schaerer, D., Goldader, J. D. et al. 1999, ApJS, 123, 3
- López-Sánchez et al. (2007) López-Sánchez, Á. R., Esteban, C., García-Rojas, J., Peimbert, M., & Rodríguez, M. 2007, ApJ, 656, 168
- López-Sánchez & Esteban (2010) López-Sánchez, Á. R., & Esteban, C. 2010, A&A, 516, A104
- Magrini et al. (2007) Magrini, L., Vílchez, J. M., Mampaso, A., Corradi, R. L. M., & Leisy, P. 2007, A&A, 470, 865
- Marchenko et al. (2004) Marchenko, S. V., et al. 2004, MNRAS, 353, 153
- Massey & Conti (1983) Massey, P., & Conti, P. S. 1983, ApJ, 273, 576
- Massey (1985) Massey, P. 1985, PASP, 97, 5
- Massey et al. (1995) Massey, P., Armandroff, T. E., Pyke, R., Patel, K., & Wilson, C. D. 1995, AJ, 110, 2715
- Massey & Johnson (1998) Massey, P., & Johnson, O. 1998, ApJ, 505, 793
- Massey et al. (2006) Massey, P., Olsen, K. A. G., Hodge, P. W. et al. 2006, AJ, 131, 2478
- Massey et al. (2007) Massey, P., McNeill, R. T., Olsen, K. A. G. et al. 2007, AJ, 134, 2474
- Mayall & Aller (1942) Mayall, N. U., & Aller, L. H. 1942, ApJ, 95, 5
- McCall (1982) McCall, M. L. 1982, Ph.D. Thesis, University of Texas
- Monreal-Ibero et al. (2010) Monreal-Ibero, A., Vilchez, J. M., Walsh, J. R., & Munoz-Tunon, C. 2010, arXiv:1003.5329
- Nagao et al. (2008) Nagao, T., et al. 2008, ApJ, 680, 100
- Nazé et al. (2003a) Nazé, Y., Rauw, G., Manfroid, J., Chu, Y.-H., & Vreux, J.-M. 2003a, A&A, 408, 171
- Nazé et al. (2003b) Nazé, Y., Rauw, G., Manfroid, J., Chu, Y.-H., & Vreux, J.-M. 2003b, A&A, 401, L13
- Niemela et al. (1991) Niemela, V. S., Heathcote, S. R., & Weller, W. G. 1991, IAUS, 143, 425
- Ouchi et al. (2008) Ouchi, M., et al. 2008, ApJS, 176, 301
- Pakull & Angebault (1986) Pakull, M. W., & Angebault, L. P. 1986, Nature, 322, 511
- Pakull & Motch (1989) Pakull, M. W., & Motch, C. 1989, Nature, 337, 337
- Pakull (1991) Pakull, M. W. 1991, IAUS, 143, 391
- Pakull (2009) Pakull, M. W. 2009, IAUS, 256, 437
- Pakull et al. (2010) Pakull, M. W., Soria, R., & Motch, C. 2010, Nature, 466, 209
- Peimbert & Costero (1969) Peimbert, M., & Costero, R. 1969, Boletin de los Observatorios Tonantzintla y Tacubaya, 5, 3
- Peimbert (1990) Peimbert, M. 1990, Reports on Progress in Physics, 53, 1559
- Pérez-Montero & Díaz (2005) Pérez-Montero, E., & Díaz, A. I. 2005, MNRAS, 361, 1063
- Pettini & Pagel (2004) Pettini, M., & Pagel, B. E. J. 2004, MNRAS, 348, L59
- Pilyugin et al. (2006) Pilyugin, L. S., Vílchez, J. M., & Thuan, T. X. 2006, MNRAS, 370, 1928
- Polcaro et al. (1995) Polcaro, V. F., Rossi, C., Norci, L., & Viotti, R. 1995, A&A, 303, 211
- Rosolowsky & Simon (2008) Rosolowsky, E., & Simon, J. D. 2008, ApJ, 675, 1213
- Rühling (2008) Rühling, U. 2008, Diplomarbeit, Universität Potsdam, Germany (http://www.astro.physik.uni-potsdam.de/ftp/ruehling/Diplomarbeit-Ruehling-2008.pdf)
- Russell & Dopita (1990) Russell, S. C., & Dopita, M. A. 1990, ApJS, 74, 93
- Schaerer & Maeder (1992) Schaerer, D., & Maeder, A. 1992, A&A, 263, 129
- Schaerer (1996) Schaerer, D. 1996, ApJ, 467, L17
- Schaerer et al. (1999) Schaerer, D., Contini, T., & Pindao, M. 1999, A&AS, 136, 35
- Schaerer (2002) Schaerer, D. 2002, A&A, 382, 28
- Schaerer (2003) Schaerer, D. 2003, A&A, 397, 527
- Schaerer (2008) Schaerer, D. 2008, IAU Symposium, 255, 66
- Schmutz et al. (1992) Schmutz, W., Leitherer, C., & Gruenwald, R. 1992, PASP, 104, 1164
- Schmutz (1993) Schmutz, W. 1993, Space Sci. Rev., 66, 253
- Schmutz & De Marco (1999) Schmutz, W., & De Marco, O. 1999, Wolf-Rayet Phenomena in Massive Stars and Starburst Galaxies, 193, 147
- Shaw & Dufour (1994) Shaw, R. A., & Dufour, R. J. 1994, Astronomical Data Analysis Software and Systems III, 61, 327
- Smith et al. (1996) Smith, L. F., Shara, M. M., & Moffat, A. F. J. 1996, MNRAS, 281, 163
- Smith et al. (2002) Smith, L. J., Norris, R. P. F., & Crowther, P. A. 2002, MNRAS, 337, 1309
- Tayal & Gupta (1999) Tayal, S. S., & Gupta, G. P. 1999, ApJ, 526, 544
- Testor & Pakull (1989) Testor, G., & Pakull, M. 1989, Recent Developments of Magellanic Cloud Research, 141
- Thuan & Izotov (2005) Thuan, T. X., & Izotov, Y. I. 2005, ApJS, 161, 240
- Vink & de Koter (2005) Vink, J. S., & de Koter, A. 2005, A&A, 442, 587
- Walborn et al. (1999) Walborn, N. et al. AJ, 118, 1684
- Williams et al. (1998) Williams, J. P., Bergin, E. A., Caselli, P., Myers, P. C., & Plume, R. 1998, ApJ, 503, 689
- Zaritsky et al. (1989) Zaritsky, D., Elston, R., & Hill, J. M. 1989, AJ, 97, 97


angle=-90.0]Portion ( 4250 - 5100 Å) of 2D longslit spectral image of MA 1 (top), BCLMP651 (middle) and HBW673 (bottom), showing the spatially extended nature of the nebular HeII 4686 emission. The width of the image (vertical dimension) is approximately 220 on the sky.
[