Colour gradients in normal and compact early-type galaxies at 1z2
Abstract
We have derived colour gradients for a sample of 20 early-type galaxies (ETGs) at selected from the GOODS-South field. The sample includes both normal ETGs (13) having effective radii comparable to the mean radius of local ones and compact ETGs (7) having effective radii from two to six times smaller. Colour gradients have been derived in the F606W-F850LP bands ( UV-U rest-frame) taking advantage of the ultradeep HST-ACS observations covering this field and providing a spatial resolution of about 0.8 kpc at the redshift of the galaxies. Despite of the narrow wavelength baseline covered (1000 Å), sampling approximatively the emission dominated by the same stellar population, we detect significant radial colour variations in 50 per cent of our sample. In particular, we find five ETGs with positive colour gradients (cores bluer than the external regions), and five galaxies with negative colour gradients (cores redder than the external regions), as commonly observed in the local Universe. These results show that at , when the Universe was only 3-4 Gyr old, ETGs constituted a composite population of galaxies whose different assembly histories have generated different stellar distributions with the bluest stellar population either in the center or in the outskirts as well as throughout the whole galaxy. Moreover, we find that compact galaxies seem to preferentially show a blue cores while moving towards normal galaxies, central stellar populations become progressively redder. Nonetheless, the narrow baseline covered together with the low statistics still prevent us to be conclusive about a possible physical connection between colour gradients and the degree of compactness of high- ETGs.
keywords:
galaxies: elliptical and lenticular, CD galaxies:formation, galaxies: evolution, galaxies: high-, galaxies: stellar content1 Introduction
A powerful tool to investigate how stellar mass is accreted onto ETGs from their formation until now, is to resolve the spatial distributions of their stellar populations and observe how they changed with time. Indeed, colour gradients are the most direct measure that can provide us with information on the stellar distribution within a galaxy, but until now, instrumental limits have restricted their study only to the local and intermediate Universe. In the last years, the advent of the HST and its capability into resolve distant galaxies are opening new possibilities into estimating colour gradients even for high- galaxies. Actually, the lack of multiband imaging has prevented an effective analysis of colour gradients of high- () ETGs in all but two cases. McGrath et al. (2008) derived the colour-maps for 2 ETGs at 1.5 in the F814W-F160W HST bands, finding flat gradients out to 2Re. Some years before, Moth & Elston (2002) studied the rest-frame UV218-U300 colour gradient for two samples of 33 galaxies at 0.51.2 and 50 galaxies at 2.03.5 in the Hubble Deep Field North. In fact, this analysis even representing the widest study of colour gradients of high- galaxies until then, is limited by the presence of photometric redshift for half of the high- sample, and suffers of the large pixel scale of HST-NIC3 camera which provides a spatial resolution of 1.6 kpc at 1.5 insufficient to clearly assess the morphology of the galaxies and properly investigate colour gradients at R Re. Nonetheless, in their composite samples they found an inversion in the colour trend from negative values (stars redder in the center) at lower redshifts to a positive values (stars bluer in the center) at higher redshifts. Actually, positive colour gradients were also detected in a sample of pure spheroidals at intermediate redshifts (Menanteau et al., 2001; Menanteau et al., 2005), suggesting an inversion of colour gradients from negative values generally observed in the local Universe to positive values at higher redshift. In fact, the first studies on high- ETGs are showing that local and early ETGs populations differ not only for the radial colour variations, but that the whole picture is more complex than the homogeneous one hypothesized from studies of local ETGs.
Recent observations (Saracco et al., 2009; Mancini et al., 2010) have shown that at high- (12), when the Universe was only 3-4 Gyr old, ETGs (hereafter we say compact) with effective radius 2-3 times smaller than that of a typical present-day ETG coexist with a majority of early-type galaxies whose dimensions are similar to those of local ETGs (we say normal). The only attempt to measure the velocity dispersion of a high- (=2.186) compact ETG (van Dokkum et al., 2009) has resulted in a value of 510 suggesting in these galaxies a denser distribution of stellar mass than in normal ETGs. At the same time, the few estimates of velocity dispersions recovered for normal high- ETGs confirmed their similarity with local populations even for stellar mass density (Cenarro & Trujillo, 2009; Cappellari et al., 2009; Onodera et al., 2010). These findings point out that the way in which the stellar mass was accreted on ETGs in the first 3-4 Gyr, is not univocal for the whole population, but on the contrary, the differences both in dimension and in structure of compact and normal high- ETGs suggest that they underwent different scenarios of formation and/or early evolution (Saracco et al., 2010a).
Moreover, the compact ETGs, at first sight, seemed to be very rare in the local Universe (Shen et al., 2003; Trujillo et al., 2009) and this evidence corroborates the idea that compact and normal galaxies should have different mass assembly histories even in the following 9-10 Gyr. Indeed, differently from normal galaxies, compact ETGs should undergo a size evolution to reconcile them with the local dimension of a typical local ETGs. Many scenarios were proposed to match the size/density of high- and local ETGs e.g. non dissipative “dry” merger, adiabatic expansion, age/colour gradient (Boylan-Kolchin et al., 2006; Naab et al., 2009; Fan et al., 2008; Damjanov et al., 2009; La Barbera & de Carvalho, 2009). Among these, wide credit is given to the merger hypothesis (Naab et al., 2009; Hopkins et al., 2010) even if no result is still conclusive (Nipoti et al., 2009). Additionally, in the last year, a new hypothesis is rising beside these scenarios. Indeed, compact galaxies with masses and radii comparable with those found at high- are now detected both in local and intermediate galaxy clusters (Valentinuzzi et al., 2010a, b) as well as in the field (Stockton et al., 2010) and the number density of compact galaxies in local clusters turns out to be consistent with the one measured at high- (Saracco et al., 2010a). This unexpected results have shaken the previous belief whereby compact galaxies were physical systems confined to the early Universe and that they must subsequently undergo an apparent or real size evolution. Indeed, the recent observations have shown that even the local population of ETGs is composed, as in the early Universe, by normal galaxies which obey the well studied scaling relation and by a fraction of compact galaxies that, with their small radius, and enhanced stellar mass density fall out of any correlations.
From these observations, it is clear that to gain insight in the complex picture of ETGs formation and evolution, it is necessary to individually define the mass assembly paths followed by both normal and compact ETGs. To address this topic it turns out to be fruitful to study the evolution of the stellar content of both compact and normal galaxies from the early Universe until the present day, and investigate if any difference occurs. To this aim, in this paper we present the study of colour gradients for a composite sample of both compact and normal high- ETGs. This work ascertains the feasibility of this analysis even for high- ETGs, and provides us the first direct information on the distribution of the stellar content in the first stages of their life.
In Section 2, we present our sample, and in Section 3 we describe the methods used to derive colour gradients for high- ETGs. In Section 4 we show our results and in Section 5 we present our conclusions.
Throughout this paper we adopt a standard cosmology with H0 = 70 km s-1 Mpc-1, = 0.3 and = 0.7. All the magnitudes are in AB system.
2 The sample
An exhaustive study of the colour gradients in high- ETGs until now has been severely limited by many factors such as the lack of spectroscopic redshifts, of a morphological classification, and of images with high resolution and signal to noise. Indeed, in the redshift range we are interested in (12), the redshift estimates are strictly compromised by the lack of prominent features in the optical spectra, and as pointed out by Mancini et al. (2010), a reduced S/N can affect the estimate of the effective radius due to the lack of possible peripheral structures with low surface brightness such as wings or halos. In fact, the minimum spatial resolution and the signal-to-noise ratio necessary to properly model the light profiles from at least the first central kpc to regions beyond the effective radius, is achievable only with deep space-based imaging. Till now, these constrains have strongly limited the collection of a representative sample able to address this topic from the already meagre observations available for high- ETGs.
We collected a sample of 20 ETGs at 0.91.92 best suited for our purpose (see below), extracted from the complete sample of 34 ETGs selected from the southern field of the Great Observatories Origins Deep Survey (GOODS-South v2; Giavalisco et al. 2004) by Saracco et al. (2010a). The survey provides each galaxy both with deep HST-ACS imaging in four bands (F435W, F606W, F775W and F850LP) and with spectroscopic redshift (Vanzella et al. 2008 and references therein). In addition, surface brightness parameters in the F850LP band, age and stellar mass M⋆ derived in an homogeneous way for the whole sample are available. For more details on the selection criteria, morphological classification, stellar mass and age estimations of the original complete sample, see Saracco et al. (2010a) and references therein.
Among the four bands at our disposal, we opted to measure the F606W-F850LP colour variations corresponding approximatively to UV-U colour in the rest-frame in order to obtain a compromise between the wavelength baseline covered and the S/N achieved. Actually, the F453W images have a S/N 2 times lower than that of F606W images, and this would have prevented us from a reliable analysis of the surface brightness parameters for most of the sample. From the original sample of 34 ETGs, we removed 3 galaxies showing X-ray emission and 11 galaxies showing anomalies in the analysis of the F606W-band images. In particular, these comprise 6 galaxies whose fitting light profile does not reproduce the observed ones, that is showing significant residuals in the residual maps, and 5 galaxies whose S/N was too low to derive their surface brightness profile out to Re. For the remaining 20 galaxies, the FWHM of 0.1” of both F606W- and F850LP-band HST-ACS images, corresponding to a spatial resolution element of 0.8 kpc at z=1.5, and the exposure times ranging from 20 ks to 50 ks, and from 35 ks to 100 ks for the F606W and F850LP filters, respectively, allow us to accurately define the light profile from the innermost regions to well beyond Re.
Following Saracco et al. (2010a) we define “compact” ETGs those galaxies that, in the F850LP band, lie more than one sigma below the local size-mass (SM) relation by Shen et al. (2003), i.e. the relation between the effective radii Re and the stellar masses. To visually observe how our galaxies are distributed respect the SM relation, and hence their degree of compactness, in Fig. 1
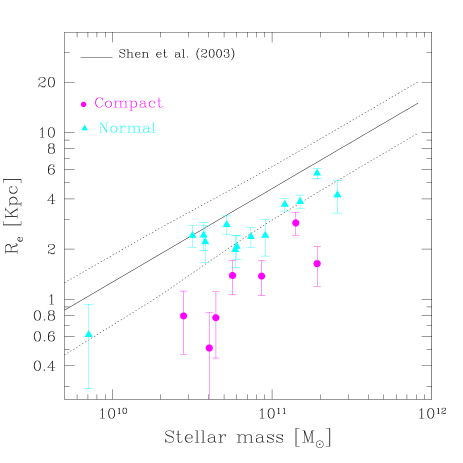
we report the SM relation in the F850LP band for our sample (solid symbols) and for local galaxies (solid line, Shen et al. 2003). The dashed lines represent the scatter at 1. It turns out that 7 out of 20 galaxies (solid points) of our sample are “compact”. In order to have a quantitative estimates of the degree of compactness, we used the ratio Re/(Re,z=0-1 ) where Re is the effective radius of the galaxy and Re,z=0 is the effective radius that a galaxy of equal mass would have at = 0 as derived by the local SM relation. In table LABEL:sp we report the compactness values for our galaxies. It is to note that, according to this definition, compact galaxies have Re/(R0.9 and lower value of degree of compactness corresponds to galaxies more compact.
Thus, after the selection, our sample is formed by 20 ETGs at 0.91.92, 7 compact and 13 normal, with stellar masses ranging from 1010 M⊙ to 31011 M⊙, and age varying from 1 Gyr to 3.5 Gyr.
3 Estimate of colour gradient of ETGs
Following previous works (e.g. Peletier et al. 1990; Saglia et al. 2000), to obtain a quantitative estimate of colour variation (UV-U)restframe along a fixed galaxy radius we measured the logarithmic slope of the galaxy colour profile (R)-(R):
| (1) |
where (R) and (R) are the surface brightness profiles of the galaxy in the UV and U, respectively.
3.1 Estimates of light profiles of high- ETGs
We fitted the light profiles of our galaxies in the F606W and F850LP bands with a Sersic profile (1968):
| (2) |
where the effective radius re [arcsec], the surface brightness at re, , and the Sersic index are the three structural parameters that shape the profile. To perform the fit we took advantage of the software (v2, Peng et al., 2002), a semiautomatic tool that starting from initial parameters provided by the user, accurately models galaxy profile by means of a two-dimensional fit. In the fitting procedure, the software convolves the galaxy model with the point-spread function (PSF) to take into account the blurring of the profile due to the diffraction and scattering of light as it passes through the telescope and instrument optics. The impact of the PSF on the light profile regards mainly the internal region of the profile (e.g. see Peng et al., 2002) where it is extremely sensitive to the Sersic index and if not taken into account can alter the shape, and consequently the slope of the colour profile. To properly remove this effect, for each galaxy we fitted the surface brightness parameters adopting different PSFs. We modelled the PSFs by sampling the light profiles of some unsaturated stars as near as possible to the galaxy, as well as by averaging these profiles and retaining as the “true” PSF model, the one which returns the best residual map. The output of the software returns to the user the total magnitude Mtot, the Sersic index , the semimajor axis , and the axial ratio , which are related to the light profile parameters through:
| (3) |
and
| (4) |
where = Mtot + 2.5 (2 r), b = 2 - 1/3 + 0.009876/ as found by Prugniel Simien (1997), and (2) is the complete Gamma function (Ciotti 1991). To derive the colour variation along a fixed galaxy radius, it is necessary that the light-profiles in the two bands are evaluated on identical ellipses both for shape and for orientation in order to prevent any artificial gradient. To obtain this, we run GALFIT on the F606W images keeping fixed both the position angle and the axial ratio b/a at the values estimated on the F850LP images. We chose the F850LP band as reference being the one providing the highest S/N ratio. In some cases (3 galaxies both in F850LP- and F606W-band images and 5 only in F606W-band images) the fitting procedure is not able to converge. For these galaxies, we re-performed the fit setting the Sersic index to a fixed value. In particular, we run the algorithm many times with different value of fixed , and kept as final solution the one for which the fit converges and the residual map are lacking of any remaining features and structures. In table LABEL:sp we report the total magnitude F606Wtot and F850LPtot for the two bands, respectively, the effective radius, and the Sersic index with their uncertainties as estimated by for the two bands. It is to note that errors are known to be severely underestimated (see Häussler et al., 2007). The galaxies fitted with a fixed value of can be recognized by their Sersic index errors setted at 0.0.
| Object | z | F606Wtot | F850LPtot | Re,606 | Re,850 | n606 | n850 | Compactness | |
|---|---|---|---|---|---|---|---|---|---|
| mag | mag | kpc | kpc | Re/(Re,z=0-1) | mag/dex | ||||
| 12965 | 1.02 | 25.650.04 | 23.260.02 | 0.540.03 | 0.610.02 | 3.30.5 | 3.8 0.2 | 1.21 | 0.0 0.2 |
| 11888 | 1.04 | 23.830.06 | 21.510.01 | 3.6 0.4 | 2.370.05 | 5.40.3 | 4.780.06 | 1.07 | -0.190.08 |
| 11539 | 1.10 | 23.400.05 | 20.7 0.2 | 4.6 0.4 | 4.2 0.4 | 4.50.2 | 4.00.1 | 0.91 | 0.040.09 |
| 9066 | 1.19 | 25.500.06 | 23.0 0.4 | 2.190.15 | 2.430.16 | 2.50.0 | 3.50.2 | 1.72 | -0.3 0.2 |
| 12789 | 1.22 | 25.930.05 | 23.090.05 | 0.910.08 | 2.2 0.2 | 3.50.0 | 5.00.3 | 1.54 | 0.7 0.4 |
| 12000 | 1.22 | 25.030.06 | 22.600.01 | 2.7 0.2 | 2.400.07 | 5.00.0 | 5.00.0 | 1.90 | -0.080.12 |
| 9369 | 1.30 | 25.830.08 | 22.940.04 | 0.940.12 | 1.980.15 | 2.70.5 | 4.70.2 | 1.03 | 0.5 0.4 |
| 11804 | 1.91 | 25.410.07 | 23.510.03 | 3.2 0.2 | 2.860.16 | 2.50.0 | 4.50.0 | 0.87 | -0.8 0.3 |
| 2 | 0.96 | 22.640.04 | 20.230.01 | 5.4 0.3 | 5.690.13 | 5.30.1 | 5.710.06 | 1.45 | -0.02 0.09 |
| 13 | 0.98 | 22.720.02 | 20.370.01 | 4.6 0.2 | 3.710.04 | 5.50.1 | 5.460.03 | 1.24 | -0.160.06 |
| 20 | 1.02 | 23.660.01 | 20.950.01 | 2.730.05 | 3.850.09 | 4.00.0 | 5.380.06 | 1.13 | 0.0 0.08 |
| 23 | 1.04 | 24.170.06 | 21.370.02 | 3.2 0.3 | 2.800.08 | 3.40.2 | 3.900.07 | 1.59 | -0.300.13 |
| 3 | 1.04 | 23.710.03 | 21.520.01 | 1.180.08 | 1.390.02 | 7.70.4 | 4.870.06 | 0.74 | 0.430.04 |
| 11 | 1.09 | 24.860.04 | 22.000.02 | 2.150.13 | 2.4 0.2 | 5.00.0 | 5.000.02 | 0.96 | 0.090.10 |
| 12 | 1.12 | 24.080.05 | 21.620.01 | 1.8 0.2 | 1.370.03 | 6.50.4 | 4.940.07 | 0.56 | 0.040.05 |
| 8 | 1.12 | 24.830.03 | 22.020.01 | 1.590.09 | 2.070.04 | 5.00.0 | 5.000.00 | 1.06 | 0.21 0.09 |
| 2148 | 1.60 | 25.7 0.3 | 23.290.04 | 4.6 6.8 | 1.640.15 | 5.525.73 | 4.80.3 | 0.42 | 0.3 0.4 |
| 2111 | 1.61 | 26.320.09 | 23.870.03 | 0.780.11 | 0.780.04 | 2.80.7 | 3.50.3 | 0.49 | -0.3 0.4 |
| 2355 | 1.61 | 26.170.10 | 24.210.02 | 0.920.17 | 0.790.03 | 3.50.9 | 2.10.2 | 0.68 | 0.50.4 |
| 472 | 1.92 | 26.370.04 | 24.380.02 | 0.400.03 | 0.510.03 | 2.30.6 | 2.40.3 | 0.34 | 0.30.5 |
3.2 Testing the reliability of structural parameters
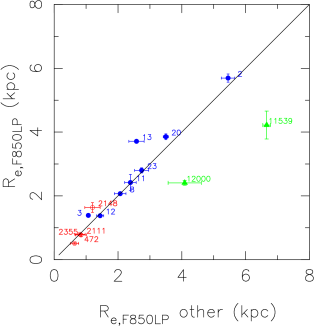
Having derived the structural parameters, we checked how our estimates are related to those of other studies. To this aim, we used the 14 galaxies of our sample in common with other groups. In particular, 8 galaxies are from Rettura et al. (Rettura et al.2006) while 4 galaxies are from Cimatti et al. (2008) and 2 from di Serego Alighieri et al. (2005). In Fig 2 we show the comparison between our estimates of the effective radii Re [kpc] measured in the F850LP band and those by other groups. The agreement is good (within the errors) for 60 of the sample and, above all, no trend is observed in the whole range of radius, magnitude, and redshift.
We then assured the reliability of our estimates through two different checks: i) performing a set of simulations, and ii) comparing the fitted and the observed light profiles.
Simulations were aimed at checking for the presence of possible bias in the measures due to instrumental effects both in the F850LP and F606W bands. For each galaxy of our sample,with , we generated its model with the same surface brightness parameters and magnitude and embedded it in a real background extracted as near as possible to the real galaxy. We recover the morphological parameters of the simulated galaxy applying the same fitting procedure used to derive the real profile. The comparison between real parameters and best fitting parameters is shown in Fig. 3 for the two bands.


No systematic bias is detected in effective radius, Sersic index , or mean surface brightness, in either bands.
Some galaxies of our sample have an effective radius smaller than 0.1”, and hence the PSF dominates the light profile beyond 0.5Re. Through these simulations, we assessed the reliability of in recovering the structural parameters also for these objects. In Fig. 3 the open points are those galaxies for which the ACS-PSF FWHM is greater than 0.55Re. We chose this limit since colour gradients are usually derived between 0.1Re and Re, and hence we are interested in assessing the accuracy of the estimate of Re and for all the cases in which PSF dominates more than half of the fitted colour profile. No bias is detected even in this case.
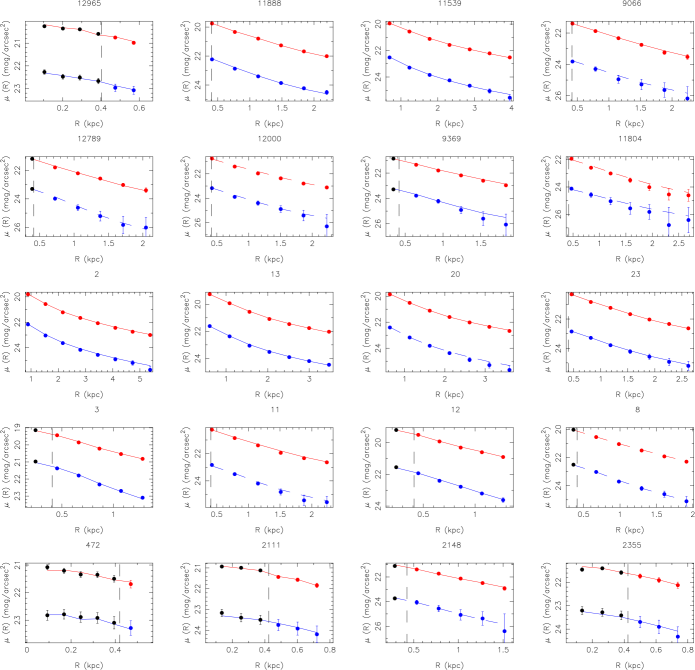
Finally, we compared the fitted light profile convolved with the PSF with the observed one. This latter were computed by measuring the surface brightness in concentric circular coronas of fixed width. In Fig. 4 the light profiles of ETGs are shown. Coloured lines represent the fitted PSF-convolved light profiles for F606W and F850LP bands (blue and red curve in each panel, respectively), and solid points trace the corresponding profiles measured on F606W- and F850LP-band images (blue and red points, respectively). The dashed vertical lines represent the radius corresponding to the PSFs FWHM. Galaxies with a fixed Sersic index are highlighted with dashed light profile curves. The errors on the observed profiles were estimated with Sextractor (Bertin & Arnouts, 1996) and corrected for the correlated noise due to the drizzling following Casertano et al. (2000). This comparison can immediately help to test the reliability of the fit. Indeed, the agreement is generally very good, even in the cases of compact galaxies (ID 11804, 3, 12, 472, 2111, 2148, 2355) whose light profiles are dominated by the PSF.
3.3 Colour gradients
Following the Eq. 2, from the structural parameters re, , and, Mtot, we derived the colour profiles -(R) as:
| (5) | |||
| (6) |
and estimated their logarithmic slope with an orthogonal least-squares fit. To be consistent with the previous studies on colour gradients (see, e.g, Peletier et al. 1990) of local ETGs we fitted the profiles between 0.1Re and Re. In Fig 5 and 6 the results are reported for “normal” and “compact” galaxies, respectively.
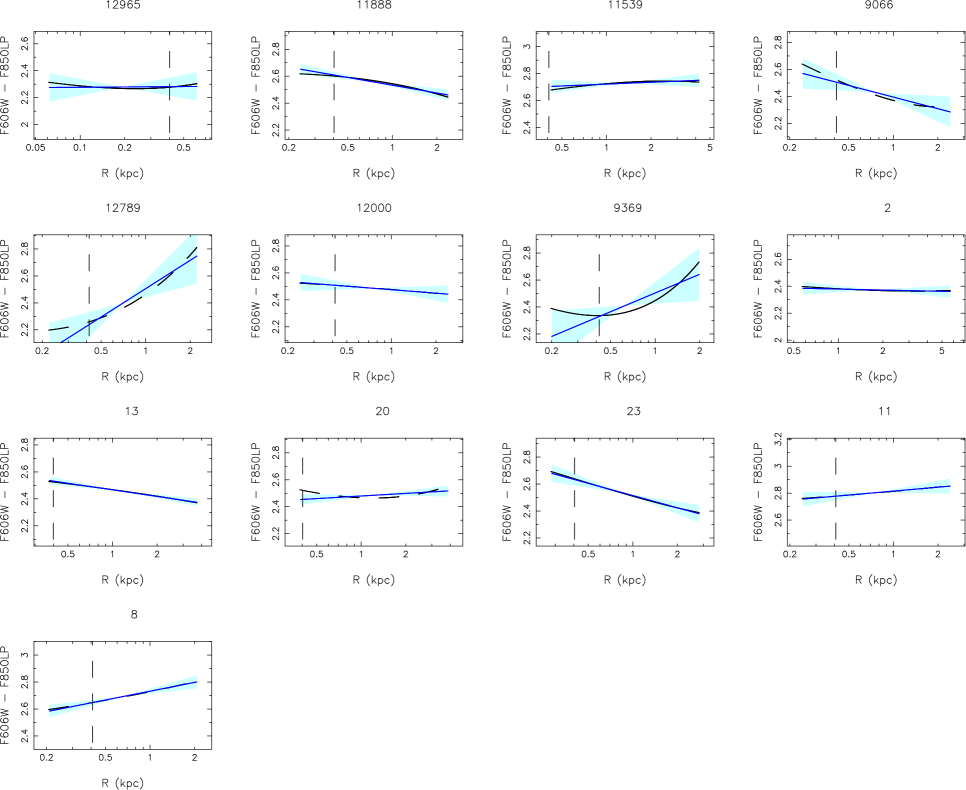
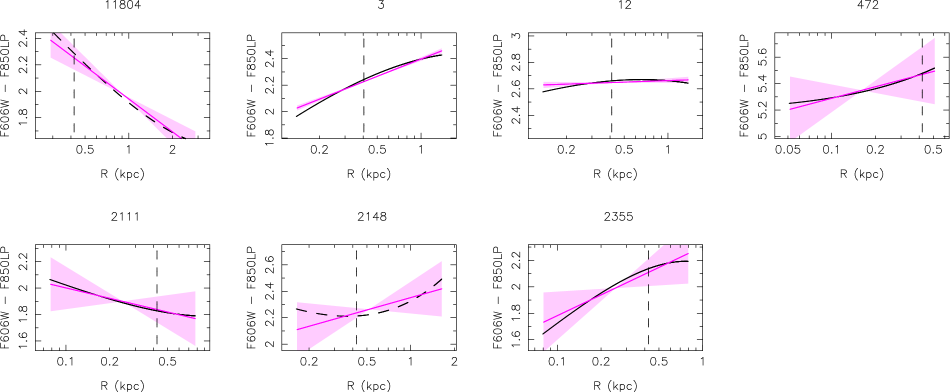
Black curves represent the colour profiles between 0.1Re and Re and coloured lines are the fitted slopes. The dashed vertical lines indicate the radius of the PSF at FWHM. Black dashed curves represent galaxies with light profiles fitted with a Sersic index fixed for at least one band. The coloured area indicate the 1 errors on colour gradient. For each galaxy, in Tab. LABEL:sp the value of the gradient and its corresponding error are reported. The latter one is not the formal error provided by for structural parameters (see Table LABEL:sp) but takes into account also the effect of S/N on the estimated parameters.
To this aim, for each galaxy, we generated the corresponding simulated galaxy both in F606W and F850LP band and embedded each of them in 50 different backgrounds extracted from their own image. For each galaxy, considering all the possible combinations between these two set of simulations, we measured 2500 simulated colour gradients and set the standard deviation of this sample as final error on the real colour gradient. From the Fig. 5 and 6, it immediately turns out that despite the extremely narrow wavelength baseline covered (1000 Å in the rest-frame) which samples approximately the same stellar population, we detected colour variations in high- ETGs. The result is not dependent by the fitted region. Indeed, we re-estimated the colour gradients between the radius of the PSF FWHM and Re and between the radius of the PSF FWHM and 1.5Re and compared them with the “classical” ones between 0.1Re and Re (Fig. 7).
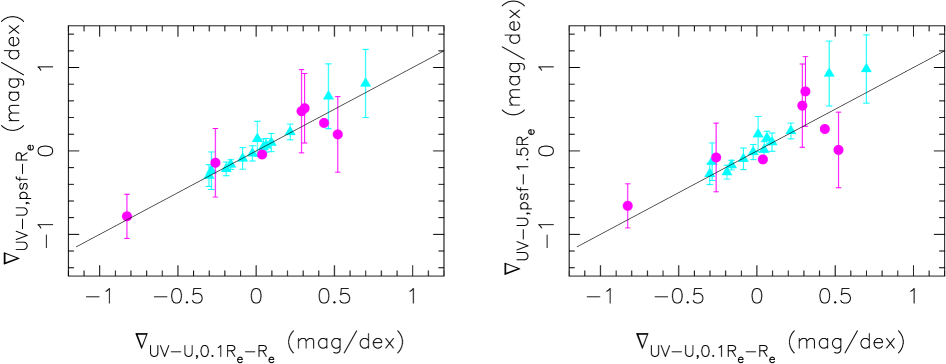
The three estimates are consistent each other and even fitting the gradients outside the radius corresponding to the PSF FWHM, ETGs still show both positive and negative variation in the colour along their radius.
As pointed out before, colour gradients for five galaxies of our sample were derived with the Sersic index fixed in the fitting of the F606W band, while for three galaxies the structural parameter was locked in the fitting of both images. To test how much a misleading estimate of the parameter can affect the gradient, for each ETG with Sersic index locked in at least one band, we simulated 14 galaxies with structural parameters equal to the real one and Sersic index varying in the range [1.758.25] with a step of 0.5. We added real background noise to these models and we fit the light profiles of the simulated galaxies holding fixed to the original value (Table 1) while allowing the other parameters to vary. From the analysis of the corresponding colour gradients, it turns out that for galaxies with Sersic index locked in a single band, the colour gradients of simulated galaxies with varying are fully compatible with the value we derived having set the Sersic index to the value we present. Concurrently, simulations suggest that the gradient estimate is not so stable to the simultaneous variation of the in both bands. Thus, our estimates of colour gradients result to be fully reliable for 17 out of 20 galaxies.
4 Results
From Fig. 5 and Fig. 6 it clearly emerges that, despite the narrow wavelength baseline covered, high- ETGs show significant colour gradients. Most intriguingly, differently from what is widely found in the local Universe, high- ETGs do not show a systematic reddening toward the center, but exhibit a uniform distribution of gradients from positive to negative values as can also be seen in Fig 7. Indeed, while 10 out of 20 galaxies have colour gradients consistent with a flat distribution of blue stars within high- ETGs (null colour gradient, galaxy ID: 12965, 11539, 12000, 2, 20, 11, 12, 2148, 2111, 472), five galaxies show effective negative colour gradients (galaxy ID: 11888, 9066, 11804, 13, 23) and the remaining five have sharp positive gradients (galaxy ID: 12789, 9369, 3, 8, 2355). This spread from positive to negative values reflects into a mean colour gradient for the whole sample of UV-U = 0.100.30 mag dex-1. Although we present the widest sample of high- colour gradients available at the moment, we remind the reader that it is not complete in magnitude and/or mass and this limitation can affect the value of the mean colour gradient UV-U for the whole population of high- ETGs. At the same time, while the incompleteness of our sample can affect the mean value, it does not influence the other important result we obtain: the spatial distribution of stellar content is not univocal in the high- ETGs population. Indeed, our results show that high- ETGs are a composite population formed by galaxies with the bluest population placed either in the center or in the periphery as well as distributed homogeneously throughout the whole galaxy.
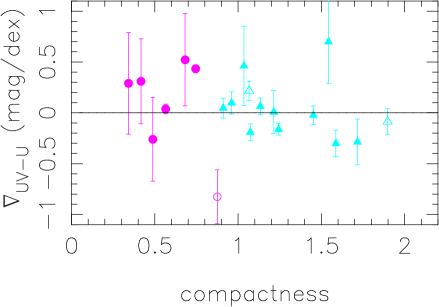
To assess whether any difference exists in the stellar distribution of normal and compact high- ETGs, in Fig. 8 we report colour gradient as a function of the galaxy degree of compactness (see Sect. 2). Circles represent compact galaxies, while triangles are normal ones. The open points represent galaxies for which Sersic indices are locked in both bands. Since simulations leave a room of space to uncertainties into the estimates of the colour gradients in these systems, we prefer not to take into account these points. We observe that the present galaxy sample seems to show a mild correlation between the degree of compactness and colour gradient. Indeed, compact galaxies seem to preferentially show a bluer core than the outer regions, while moving towards normal galaxies stellar populations become redder in the center as observed in the local Universe. In fact, only one compact galaxy out of 6 (15) has a negative colour gradient (but compatible within the error with a positive value) against the 45 in the case of normal galaxies. This difference is detectable in the mean colour gradient value of the two samples. Indeed, while the mean colour gradient of compact galaxies is UV-U = 0.220.28, normal galaxies have a mean value of UV-U = 0.040.30. Even if the two mean estimates seem to point towards a different nature of the two samples, it is to note that they are consistent within the errors and that the KS probability for the two samples of being extracted from different populations is not significant (26). At the same time, the Spearman’s rank test with a coefficient = -0.34 shows that the correlation between the two quantities has a probability of 85 to not be observed by chance, but even in this case, the poor statistics of our sample prevent us to reach a firm conclusion. In fact, the trend slightly hinted in Fig. 8 can be even due to the incompleteness of our sample. Unfortunately, we are not able to discriminate how and in which direction (if any) the selection criteria of our sample can arrange the distribution of the points in Fig. 8, and hence the effect they could have on the supposed connection. Thus, although the quality of our sample allow us to investigate the internal colour distribution of both compact and normal high- ETGs, we cannot be conclusive about the suggested physical connection between the degree of compactness and radial colour variations.
5 Conclusions
We analysed (UV-U)restframe colour gradients in a sample of 20 ETGs at 0.91.92 comprising both normal and compact galaxies. Despite the short wavelength baseline covered, we detect effective radial colour variations in 50 of the galaxies of our sample, while the remaining show a gradient comparable with zero. In particular, we detect significant radial colour variations in 10 out of the 20 galaxies of our sample: five galaxies exhibit a reddening towards the internal regions (negative colour gradient), as generally observed in the local Universe, and five galaxies show stellar populations bluer in the central regions than in the outskirts, which reflects in positive colour gradients. This result supports the previous findings on colour gradients at intermediate and high redshifts (e.g. Menanteau et al., 2001; Moth & Elston, 2002; Ferreras et al., 2009) which already revealed the presence of blue core ETGs which are not common in the local Universe.
Taking advantage of our composite sample including both compact and normal ETGs, we investigate possible systematics in the stellar content of these physically different systems. Actually, the distribution of our data in the plane defined by colour gradients and compactness is suggestive of a mild correlation whereby the colour gradient decreases from positive to negative values moving from compact towards normal galaxies. This trend reflects in the mean values of colour gradients of compact and normal galaxies, 0.220.28 and 0.040.30 respectively, even if the difference is not statistically significant to point toward two strictly different mass assembly histories. Concurrently, the Spearman’s test assess that the correlation between ETGs compactness and colour gradient could be present with a probability of 85 suggesting a possible physical connection between the two quantities. However, we cannot reach a firm conclusion since the poor statistics and the incompleteness could concur to originate a fake correlation. Moreover, it is to note that this trend could be affected by the short wavelength baseline covered which do not sample the emission of the oldest stellar populations.
Although the limits of our sample do not allow us to strictly assess or deny this suggested trend, theoretical simulations of the hierarchical assembly of the stellar matter seem to support the presence of blue cores in compact galaxies (Hopkins et al., 2008). Indeed, at higher redshifts, the progenitor galaxies tend to have a greater amount of gas not yet converted in stars. In a merger event involving a gas rich galaxy, the torsion forces convey this reservoir toward the center giving origin to an intense and short burst of star formation. Concurrently, the pre-existing stars tend to arrange themselves in the external regions leading to the formation of an ETG with a younger (and hence bluer) stellar population in the center than in the outskirts and, consequently, with a positive colour gradient. On the contrary, in later epochs, the progenitor galaxies, having already consumed their gas both in internal processes and in previous mergers, cannot fuel the central starburst and, hence, their dry merger will not result in a blue core galaxy. Additionally, the enhancement with redshift of the gas fraction at the disposal of progenitor galaxies could explain not only the increasing presence of blue core galaxies at higher redshift, but also their compact dimensions. In fact, the blue core galaxies, due to the central starburst they underwent in the early strong dissipative merger, will have surface brightness profiles more centrally peaked, hence with smaller Re, than ETGs formed in non-dissipative mergers. As a consequence, ETGs formed in early mergers will tend to have both bluer cores and to be more compact.
Supporting this scenario, recently it has been found that high- ETGs formed at earlier epochs are preferentially compact galaxies (Saracco et al., 2010b). Even if these evidences seem to concur to this picture, many aspect are still missing, e.g. which internal and/or external processes would be responsible of the enhanced central star formation, and hence of the positive colour gradients, observed also in normal galaxies.
To gain more insight in the complex scenario of early-type galaxy formation and evolution it would be fruitful enlarge the wavelength baseline covered, in order to sample also the emission dominated by the oldest stellar population (Gargiulo et al. in preparation). This will allow us to better characterize the stellar content of high- ETGs as whole and, in particular, to deeply investigate the presence of possible systematics between the stellar populations of normal and compact ETGs.
Acknowledgments
I would like to thank Chris Haines and Francesco La Barbera for their helpful comments and support. This work is based on observations made with the NASA/ESA Hubble Space Telescope, obtained from the data archive at the Space Telescope Science Institute which is operated by the Association of Universities for Research in Astronomy. This work has received financial support from ASI (contract I/016/07/0 and I/009/10/0).
References
- Bertin & Arnouts (1996) Bertin E., Arnouts S., 1996, AAS, 117, 393
- Boylan-Kolchin et al. (2006) Boylan-Kolchin M., Ma C., Quataert E., 2006, MNRAS, 369, 1081
- Cappellari et al. (2009) Cappellari M., di Serego Alighieri S., Cimatti A., Daddi E., Renzini A., Kurk J. D., Cassata P., Dickinson M., Franceschini A., Mignoli M., Pozzetti L., Rodighiero G., Rosati P., Zamorani G., 2009, ApJL, 704, L34
- Casertano et al. (2000) Casertano S., de Mello D., Dickinson M., Ferguson H. C., Fruchter A. S., Gonzalez-Lopezlira R. A., Heyer I., Hook R. N., Levay Z., Lucas R. A., Mack J., Makidon R. B., Mutchler M., Smith T. E., Stiavelli M., Wiggs M. S., Williams R. E., 2000, AJ, 120, 2747
- Cenarro & Trujillo (2009) Cenarro A. J., Trujillo I., 2009, ApJL, 696, L43
- Cimatti et al. (2008) Cimatti A., Cassata P., Pozzetti L., Kurk J., Mignoli M., Renzini A., Daddi E., Bolzonella M., Brusa M., Rodighiero G., Dickinson M., Franceschini A., Zamorani G., Berta S., Rosati P., Halliday C., 2008, AA, 482, 21
- Damjanov et al. (2009) Damjanov I., McCarthy P. J., Abraham R. G., Glazebrook K., Yan H., Mentuch E., Le Borgne D., Savaglio S., Crampton D., Murowinski R., Juneau S., Carlberg R. G., Jørgensen I., Roth K., Chen H., Marzke R. O., 2009, ApJ, 695, 101
- di Serego Alighieri et al. (2005) di Serego Alighieri S., Vernet J., Cimatti A., Lanzoni B., Cassata P., Ciotti L., Daddi E., Mignoli M., Pignatelli E., Pozzetti L., Renzini A., Rettura A., Zamorani G., 2005, AA, 442, 125
- Fan et al. (2008) Fan L., Lapi A., De Zotti G., Danese L., 2008, ApJ, 689, L101
- Ferreras et al. (2009) Ferreras I., Lisker T., Pasquali A., Kaviraj S., 2009, MNRAS, 395, 554
- Giavalisco et al. (2004) Giavalisco M., Ferguson H. C., Koekemoer A. M., Dickinson M., Alexander D. M., Bauer F. E., Bergeron J., Biagetti C., Brandt W. N., Casertano S., 2004, ApJ, 600, L93
- Häussler et al. (2007) Häussler B., McIntosh D. H., Barden M., Bell E. F., Rix H., Borch A., Beckwith S. V. W., Caldwell J. A. R., Heymans C., Jahnke K., Jogee S., Koposov S. E., Meisenheimer K., Sánchez S. F., Somerville R. S., Wisotzki L., Wolf C., 2007, ApJS, 172, 615
- Hopkins et al. (2010) Hopkins P. F., Bundy K., Hernquist L., Wuyts S., Cox T. J., 2010, MNRAS, 401, 1099
- Hopkins et al. (2008) Hopkins P. F., Cox T. J., Hernquist L., 2008, ApJ, 689, 17
- La Barbera & de Carvalho (2009) La Barbera F., de Carvalho R. R., 2009, ApJ, 699, L76
- Mancini et al. (2010) Mancini C., Daddi E., Renzini A., Salmi F., McCracken H. J., Cimatti A., Onodera M., Salvato M., Koekemoer A. M., Aussel H., Le Floc’h E., Willott C., Capak P., 2010, MNRAS, 401, 933
- McGrath et al. (2008) McGrath E. J., Stockton A., Canalizo G., Iye M., Maihara T., 2008, ApJ, 682, 303
- Menanteau et al. (2001) Menanteau F., Abraham R. G., Ellis R. S., 2001, MNRAS, 322, 1
- Menanteau et al. (2005) Menanteau F., Martel A. R., Tozzi P., Frye B., Ford H. C., Infante L., Benítez N., Galaz G., Coe D., Illingworth G. D., Hartig G. F., Clampin M., 2005, ApJ, 620, 697
- Moth & Elston (2002) Moth P., Elston R. J., 2002, AJ, 124, 1886
- Naab et al. (2009) Naab T., Johansson P. H., Ostriker J. P., 2009, ApJ, 699, L178
- Nipoti et al. (2009) Nipoti C., Treu T., Auger M. W., Bolton A. S., 2009, ApJ, 706, L86
- Onodera et al. (2010) Onodera M., Daddi E., Gobat R., Cappellari M., Arimoto N., Renzini A., Yamada Y., McCracken H. J., Mancini C., Capak P., 2010, ApJL, 715, L6
- Peletier et al. (1990) Peletier R. F., Valentijn E. A., Jameson R. F., 1990, AA, 233, 62
- Peng et al. (2002) Peng C. Y., Ho L. C., Impey C. D., Rix H., 2002, AJ, 124, 266
- (26) Rettura A., Rosati P., Strazzullo V., Dickinson M., Fosbury R. A. E., Rocca-Volmerange B., Cimatti A., di Serego Alighieri S., Kuntschner H., Lanzoni B., Nonino M., Popesso P., Stern D., Eisenhardt P. R., Lidman C., Stanford, S. A., 2006, AA, 395, 554
- Saglia et al. (2000) Saglia R. P., Maraston C., Greggio L., Bender R., Ziegler B., 2000, AA, 360, 911
- Saracco et al. (2009) Saracco P., Longhetti M., Andreon S., 2009, MNRAS, 392, 718
- Saracco et al. (2010a) Saracco P., Longhetti M., Gargiulo A., 2010a, MNRAS, pp L115+
- Saracco et al. (2010b) Saracco P., Longhetti M., Gargiulo A., 2010b, MNRAS, submitted
- Sersic (1968) Sersic J. L., 1968, Atlas de galaxias australes
- Shen et al. (2003) Shen S., Mo H. J., White S. D. M., Blanton M. R., Kauffmann G., Voges W., Brinkmann J., Csabai I., 2003, MNRAS, 343, 978
- Stockton et al. (2010) Stockton A., Shih H., Larson K., 2010, ApJL, 709, L58
- Trujillo et al. (2009) Trujillo I., Cenarro A. J., de Lorenzo-Cáceres A., Vazdekis A., de la Rosa I. G., Cava A., 2009, ApJ, 692, L118
- Valentinuzzi et al. (2010a) Valentinuzzi T., Fritz J., Poggianti B. M., Cava A., Bettoni D., Fasano G., D’Onofrio M., Couch W. J., Dressler A., Moles M., Moretti A., Omizzolo A., Kjærgaard P., Vanzella E., Varela J., 2010a, ApJ, 712, 226
- Valentinuzzi et al. (2010b) Valentinuzzi T., Poggianti B. M., Saglia R. P., Aragon-Salamanca A., Simard L., Sanchez-Blazquez P., D’Onofrio M., Cava A., Couch W. J., Fritz J., Moretti A., Vulcani B., 2010b, ArXiv e-prints
- van der Wel et al. (2005) van der Wel A., Franx M., van Dokkum P. G., Rix H., Illingworth G. D., Rosati P., 2005, ApJ, 631, 145
- van Dokkum et al. (2009) van Dokkum P. G., Kriek M., Franx M., 2009, Nature, 460, 717
- Vanzella et al. (2008) Vanzella E., Cristiani S., Dickinson M., Giavalisco M., Kuntschner H., Haase J., Nonino M., Rosati P., Cesarsky C., Ferguson H. C., GOODS Team 2008, AA, 478, 83