Galaxy Zoo Supernovae
Abstract
This paper presents the first results from a new citizen science project: Galaxy Zoo Supernovae. This proof of concept project uses members of the public to identify supernova candidates from the latest generation of wide-field imaging transient surveys. We describe the Galaxy Zoo Supernovae operations and scoring model, and demonstrate the effectiveness of this novel method using imaging data and transients from the Palomar Transient Factory (PTF). We examine the results collected over the period April–July 2010, during which nearly 14,000 supernova candidates from PTF were classified by more than 2,500 individuals within a few hours of data collection. We compare the transients selected by the citizen scientists to those identified by experienced PTF scanners, and find the agreement to be remarkable – Galaxy Zoo Supernovae performs comparably to the PTF scanners, and identified as transients 93% of the spectroscopically confirmed SNe that PTF located during the trial period (with no false positive identifications). Further analysis shows that only a small fraction of the lowest signal-to-noise SN detections () are given low scores: Galaxy Zoo Supernovae correctly identifies all SNe with detections in the PTF imaging data. The Galaxy Zoo Supernovae project has direct applicability to future transient searches such as the Large Synoptic Survey Telescope, by both rapidly identifying candidate transient events, and via the training and improvement of existing machine classifier algorithms.
keywords:
supernovae: general — surveys – methods: data analysis1 Introduction
Supernovae (SNe) have a profound influence upon many diverse areas of
astrophysics. They are the key source of heavy elements in the
universe, driving cosmic chemical evolution. Their energy input can
initiate episodes of star formation, and they are themselves the
product of the complex physics underlying the final stages of stellar
evolution. The homogeneous nature of the thermonuclear Type Ia SNe
provides the most mature and direct probe of dark energy. Despite
this importance in astrophysics, we understand surprisingly little
about the physics governing SN explosions. Only the progenitors of
the core collapse Type IIP SNe have been directly identified: the
physical nature of other SN types remains uncertain (for reviews
see Hillebrandt & Niemeyer, 2000; Smartt, 2009). We remain ignorant
about many aspects of SN rates, light-curves, spectra, demographics,
and the dependence of these properties on environment, progenitor
composition, and explosion physics.
In part, this is due to the historical difficulty and technical
challenges associated with locating SNe in the required numbers to
create statistically meaningful samples, particularly at low redshift
where high quality follow-up data can most easily be attained. This
situation has changed with the availability of large format CCD
detectors. Automated, wide-field transient searches on dedicated 1-2m
class telescopes and facilities are underway, typically observing
thousands of square degrees every few days
(e.g. Keller et al., 2007; Law et al., 2009). These
flux-limited ‘rolling searches’ select transient events without regard
to host galaxy properties or type.
This large amount of imaging data naturally generates its own
particular logistical challenges in dealing with the data flow, and
identifying transient astrophysical objects of interest in the data
(‘candidates’) for scientific study and analysis. Of particular
importance is the rapid identification of new candidates once the
imaging data has been obtained and processed. Though many aspects of
survey operations, such as image processing, can be efficiently
pipelined, the identification of new transient sources remains
challenging, with human operators (‘scanners’) invariably charged with
wading through new detections on a nightly basis. Though computer
algorithms can assist with identifying objects of interest in the
data, this scanning can still absorb a significant amount of
researcher time. A related issue is spectroscopic follow-up, a limited
resource that must be prioritised and allocated efficiently to the
detected candidates, with the absolute minimum of false candidates
observed.
Two high-redshift SN searches highlight these challenges. The
Supernova Legacy Survey (SNLS; e.g. Astier et al., 2006) used
the MegaCam instrument on the 3.6m Canada–France–Hawaii Telescope to
survey 4 deg2 with a cadence of a few days. Following automated
cuts on signal-to-noise and candidate shape, each square degree would
typically generate 200 candidates for each night of observation
(Perrett et al., 2010). Visual inspection would decrease this
number to 20 plausible real transients. The Sloan Digital Sky
Survey-II Supernova Survey (SDSS-SN;
e.g. Frieman et al., 2008) used the SDSS 2.5m telescope to survey a
larger area of 300 deg2, though to a shallower depth than SNLS
(Sako et al., 2008). After the removal of moving (solar
system) objects, in the first season (3 month period), human scanners
viewed 3000–5000 objects each night spread over six scanners
(100,000 over the whole season). Although this number was radically
reduced in later seasons as more automated procedures were developed
(14,000 during season 2), the burden on human scanners was still
large (Sako et al., 2008). With new wide-field transient
surveys generating many more candidates than these two surveys,
advances in both automated techniques and human scanning are clearly
required.
This paper details a new method for sorting through SN candidates,
based upon the citizen science project ‘Galaxy Zoo’
(Lintott et al., 2008, 2010). New candidate
transient events are uploaded to the Galaxy Zoo Supernovae website, and
are visually examined and classified by members of the public, guided
by a tutorial and associated decision tree. Each candidate is
examined and classified by multiple people and given an average score,
with the candidates ranked and made available for further
investigation in real-time. The advantages of this approach are
considerable. First, the burden of candidate scanning is largely
removed from the science team running the survey. Second, each
candidate is inspected multiple times (versus once by a scanner in
previous transient surveys), reducing the chances that the candidate
could be missed. Third, with a large number of people scanning
candidates, more candidates can be examined in a shorter amount of
time – and with the global Zooniverse (the parent project of Galaxy
Zoo) user base this can be done around the clock, regardless of the
local time zone the science team happens to be based in. This speed
can even allow interesting candidates to be followed up on the same
night as that of the SNe discovery, of particular interest to quickly
evolving SNe or transient sources. Fourth, the large number of human
classifications collected can be used to improve machine learning
algorithms for automated SNe classification.
This paper reports the results from the early operations (over 3
month period) of this system. In section 2, we
describe the Palomar Transient Factory, data from which were used in
the tests and running of Galaxy Zoo Supernovae.
Section 3 describes Galaxy Zoo Supernovae,
including the ranking system for candidates used by the citizen
science classifiers. Section 4 has details of the tests
and first results of the Galaxy Zoo Supernovae operation. We discuss
the future direction of this project in section 5.
2 The Palomar Transient Factory
The Palomar Transient Factory (PTF) is a wide-field survey exploring
the optical transient sky. The survey is built around the 48 inch
Samuel Oschin telescope at the Palomar Observatory, recently equipped
with the CFH12k mosaic camera (formerly at the Canada-France-Hawaii
Telescope) offering an 7.8 square degree field of view, and
robotised to allow remote and automated observations. Observations
are mainly conducted using the Mould- filter.
A full description of the operations of the PTF experiment can be
found in Law et al. (2009). Of most relevance for SN
studies are the ‘5-day cadence’ and ‘dynamical cadence’ experiments,
each using % of the observing time. The dynamic cadence
revisits survey fields on time-scales of 1 minute up to 5 days and is
particularly sensitive to rapid transient events (as well as longer
duration SNe), whereas the 5-day cadence is specifically targeted to
extra-galactic SN studies (Rau et al., 2009). Even in the 5
day cadence, images are typically taken in pairs separated in time by
about one hour. This is to help identify moving objects (i.e.,
asteroids) in the imaging data, which might otherwise masquerade as
new transients.
2.1 PTF real-time operations
The PTF (near)-real-time search pipeline is hosted by the National Energy Scientific Computing Center (NERSC) at the Lawrence Berkeley National Laboratory (LBNL). After data is taken and transferred from the Palomar observatory to NERSC, the pipeline generates new subtraction images within an hour (Nugent et al., 2010), subtracting an older, deep ‘reference’ image from the new observations. The two images are photometrically matched using the hotpants program111http://www.astro.washington.edu/users/becker/hotpants.html, an implementation of the Alard (2000) algorithm. Candidate transient events are then identified as detections in the subtraction images using SExtractor (Bertin & Arnouts, 1996). Fluxes and various other relevant parameters are measured before storing all candidates in a database. Each candidate is also ‘scored’ (producing the PTF ‘real-bogus’ value) using a machine-learning algorithm (the ‘PTF robot’) based on the characteristics of the detection and previous history of the candidate (Bloom et al., in prep.). The vast majority (%) of these candidates are not real astrophysical transient events – the search algorithm is designed to be as inclusive as possible, with most of the candidates rejected via simple cuts. These include:
-
1.
The ratio of both semi-major and semi-minor axes of the candidate shape to the seeing must be greater than 0.15 and less than 0.85, and the ratio of the FWHM of the candidate to the seeing must be greater than 0.5 and less than 2.0. These ensure that the candidate has a reasonable spatial extent when compared to the seeing,
-
2.
In a 7 pixel by 7 pixel box placed on top of the candidate, the number of pixels deviating by more than 2 must be less than 6, and the number deviating by more than 3 must be less than 2.
-
3.
Each candidate must be seen in at least one image taken in the previous 10 nights (including the night of detection), a constraint designed to remove fast moving solar system objects,
-
4.
Candidates within 1″ of previously located objects (excluding the previous 10 nights) are removed to avoid the repeated detection of (e.g.) AGN or variable stars.
The effectiveness of these cuts means that a typical full night of PTF
observing will yield 100–500 (average 200) candidates
that survive these culls, which can then be further sorted using only
a short decision tree in Galaxy Zoo Supernovae.
Though the ultimate aim is to make the human scanners redundant with a
fully automated machine-learning classification pipeline, at the
current time a substantial amount of human scanning is still required
to identify the good candidates (in part, this scanning can be used to
train machine-based methods). Candidates are inspected visually by
human scanners in the PTF team, using a web interface to reject false
transient detections. The human scanner can dynamically alter a set
of cuts to control the candidates that are shown for a given image,
including the signal-to-noise, shape parameters, the full-width
half-maximum (FWHM) of the candidate compared to the global image
value, and the output score from the machine classifier. Based on the
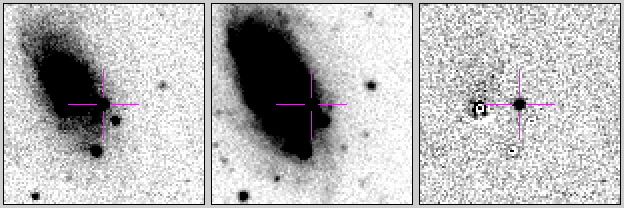
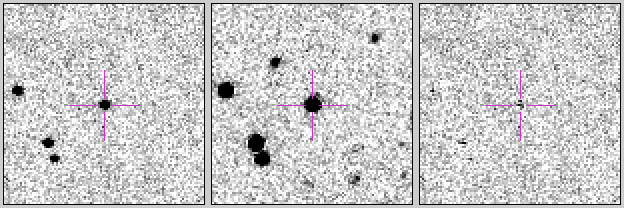
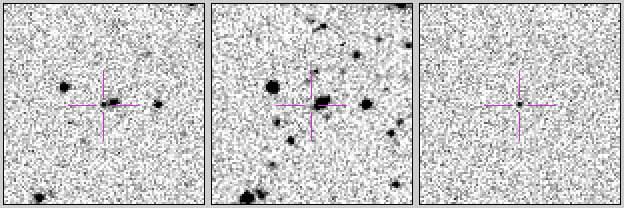
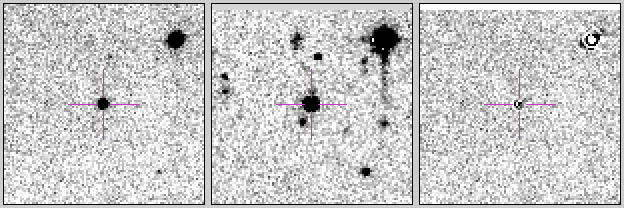
cuts chosen, the scanner is presented with a series of detection
‘triplets’ – each triplet contains three images showing the current
image of the field (containing SN light together with all other
objects), the historical or reference image of the same field (with no
SN light), and the difference between the two (which should contain
only the SN light). Examples of triplets are shown in
Fig. 1. The human scanner then decides, based on
his or her subjective (but informed) judgement, whether each of the
candidates presented is a real transient event, and if so marks that
candidate as either a SN-like transient or a variable star.
The primary goal of Galaxy Zoo Supernovae in PTF is to initially
supplement, but perhaps ultimately replace, the role of the PTF human
scanners. By presenting a transient candidate to a number of
different classifiers not only is the time of the PTF team freed to
spend on tasks not suitable for the general public, but the potential
of mis-classification of candidates due to individual human error is
significantly reduced. The 5-day and dynamical cadence programs in
PTF collect data on every night of the year March to November (weather
permitting) and on each night 2–4 of the PTF team share the scanning
tasks, examining 500 candidates. This not only requires several
person-hours of work, but the large number of classifications by a
small number of PTF-scanners is likely to contain errors, and this is
where the repeat-classification by Galaxy Zoo Supernovae volunteers
can help.
The Galaxy Zoo Supernova project also has other aims. A longer-term
goal is to provide sufficient classification data for the training and
improvement of the PTF machine-learning classification algorithm. A
final consideration is to build expertise in the citizen science
community for future transient surveys, which of course generate many
more candidates than PTF, perhaps approaching thousands of genuine
candidates on a nightly basis.
3 Galaxy Zoo Supernovae
3.1 Description of a typical ‘Zoo’
The Galaxy Zoo Supernovae
website222http://supernova.galaxyzoo.org/ is built
using the Zooniverse333http://zooniverse.org
Application Programming Interface (API) toolset. The Zooniverse API
is the core software supporting the activities of all Zooniverse
citizen science projects. Built originally for Galaxy Zoo 2, the
software is currently being used by six different projects. The
Zooniverse API is designed primarily as a tool for serving up a large
collection of ‘assets’ (for example, images or video) to an interface,
and collecting back user-generated interactions with these assets.
So that the project website can retain a high performance during
spikes of activity, Galaxy Zoo Supernovae is hosted on Amazon Web
Services which provides a virtualised machine environment that can
auto-scale in size based upon server load. The site uses the Elastic
Compute Cloud444http://aws.amazon.com/ec2 (EC2) for
web/database servers and the Simple Storage
Service555http://aws.amazon.com/s3 (S3) for image
storage.
Image assets are presented to volunteers of the website through custom
user interfaces, designed to aid the volunteer in classifying the
object. For many projects this interface takes the form of a decision
tree which walks the volunteer through a number of questions
concerning the current image. The interaction of the volunteer with
the website produces a set of ‘annotations’ which together constitute
a ‘classification’ of the asset. These are stored for later analysis
or in the case of Galaxy Zoo Supernovae are scored in real-time to
change the behaviour of the website.
3.2 Galaxy Zoo Supernovae website operations
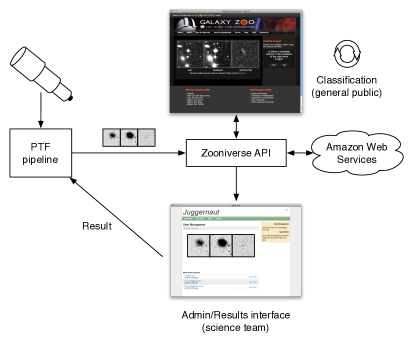
Similar in nature to the original Galaxy Zoo 2 interface, Galaxy Zoo Supernovae is a classic example of a ‘Zoo’. When a new highly-scored candidate is located in the PTF pipeline, an image triplet (Fig. 1) of the candidate is automatically uploaded, together with a small amount of metadata, to the Galaxy Zoo Supernovae API. Upon upload, the image is saved to Amazon S3 (a file hosting service) and registered with the website. Finding new SNe is time critical and our method of automatically registering new assets with the API means that classifiers are inspecting SN candidates discovered just hours earlier. The interface for Galaxy Zoo Supernovae presents these candidate detection triplets (just as with the PTF human scanners, 2.1) together with a decision tree of questions and answers designed to help classify each candidate (see Fig. 3). Fig. 2 displays the typical flow in the system. Once a candidate has been classified (see below) it is instantly available to the PTF team through a private web interface.
3.3 Decision tree
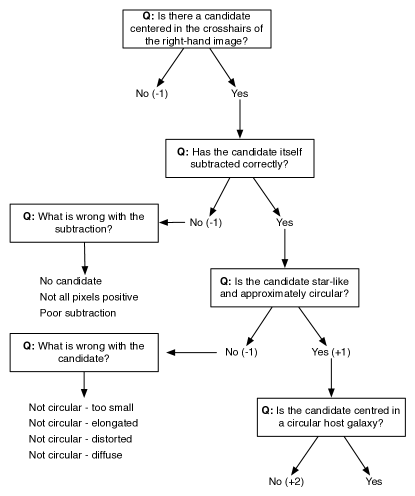
The decision tree developed to assist volunteers in classifying candidates is described in Fig. 3. This decision tree is designed to remove as many false candidates as possible, without losing real, scientifically interesting events. In this respect the decision tree is conservative in the candidates that are removed to minimise the number of false negatives. The tree proceeds as follows:
-
1.
Is there a candidate centered in the crosshairs of the right-hand image?
The PTF subtraction pipeline can occasionally undergo a failure and report (and therefore upload to the site) a ‘good’ candidate that is actually an error in the processing. This can be due to large (several pixel) mis-alignments of the two images being analysed, often localised in a particular part of the CCD where the astrometric solution fails. Other sources of failure include saturated pixels or bleed trails from bright stars, or problems with the pipeline flat-fielding. The SExtractor detection algorithm can also sometimes detect a noise peak rather than a real transient. Though the basic cuts made by PTF remove most of these errors, on occasion they are ranked highly and uploaded to Galaxy Zoo Supernovae (emphasising the need for human classifiers). Therefore, the first question in the decision tree is designed to remove such objects. The right-hand image in the triplets in Fig. 1 are the focus of this question. -
2.
Has the candidate itself subtracted correctly?
Small mis-alignments between the reference and science image can result in image subtraction problems, usually indicated by a dipole of positive and negative pixels in the subtraction image. The cores of bright (but not saturated) stars can also mis-subtract, and result in ‘bullseye’ patterns in the subtraction images. This question is designed to flag such candidates. -
3.
Is the candidate star-like and approximately circular?
This question is designed to remove unidentified cosmic rays, or diffuse/non-circular candidates which result from image subtraction problems. The volunteer is asked if the candidate looks like a round, symmetrical dot (star). Candidates that are very small (1–2 pixels, i.e., not PSF-like), elongated or otherwise distorted, or diffuse would trigger a negative response to this question. -
4.
Is the candidate centered in a circular host galaxy?
The final question is more subjective, and is designed to categorise real astrophysical transients into two broad categories. Many of the transients which PTF detects are variable stars lying within our own galaxy, which are of interest to a different set of science users than extra-galactic transients. Variable star transients will appear to lie in ‘hosts’ that are circular (as they are stars), and will also appear to be located in the centre of these hosts. By contrast, SNe will either have no host galaxy, or will lie (probably off-centre) in a large diffuse host galaxy. This question therefore broadly splits the real transients into variable stellar transients, and SNe. Most SNe that do happen to lie in the centres of their host galaxies will not be categorised as variable stars – the question also requires the ‘host galaxy’ to be circular.
A full tutorial is available to new volunteers of the website to illustrate the different questions using real PTF data.
3.4 Asset scoring and priority
Once a volunteer has examined a candidate, their response is converted into a score, , as follows.
-
•
The initial score is zero.
-
•
If a classifier answers negatively any question up to and including ‘Is the candidate star-like and approximately circular’, the candidate is given a score of -1.
-
•
If a classifier instead answers positively up to that question, then the candidate is given a score of +1.
-
•
If the classifier then also marks the candidate as not centred in a circular host, then the candidate gains an additional score of 2.
The structure of the decision and scoring of the questions means that
candidates can only end up with a score of -1, 1 or 3 from each
classification, with the most promising SN candidates scored 3. As
each new classification is received, the arithmetic mean score
() of the candidate is recalculated. Candidates
which are not astrophysically interesting tend to have
(i.e., most volunteers scored them a ‘’).
Astrophysical transients typically have , and SNe
tend to have (i.e., most volunteers scored them a
‘3’).
The asset prioritisation system is adjusted after each classification
is received, and operates to prioritise the best SN candidates (i.e.,
the order in which the candidates are shown to classifiers). When new
candidates are uploaded to the website, they are initially prioritised
based upon i) a score supplied by the PTF pipeline, and ii) the age of
the candidate (the newest uploads are shown first). The PTF ‘real
bogus’ value ( 2.1) is calculated by the PTF
pipeline for all candidates and gives an indication of the likelihood
that a candidate is a real transient. This value is only used to
determine the order in which candidates are shown and is not used in
the final ranking.
Studies of results from early (‘beta’) versions of Galaxy Zoo Supernovae have allowed us to optimise the asset prioritisation to reduce the time taken to identify candidates. We divide candidates in to four categories:
-
1.
Unseen – Candidates which have 3 or fewer classifications.
-
2.
Bulk – Candidates which have been classified between 3 and 10 times.
-
3.
Stragglers – Candidates which have been classified more than 10 times, but which do not have a ‘definitive’ (i.e., those with ).
-
4.
Done – Candidates which have been classified more than 10 times and which have or , and candidates which have been classified more than 20 times.
Candidates in the ‘unseen’ category are given absolute precedence over
all others in an aim to get an initial understanding of the quality of
the candidate; they are shown in order of upload time followed by the
real-bogus score. Once these are completed, the ‘bulk’ and ‘straggler’
candidate classes have equal priority. We select randomly between the
two classes, choosing the newest candidate with the highest score from
each group – as a candidate begins to receive ‘positive’
classifications (i.e., of 1 or 2) then it is prioritised above any
others thus allowing rapid identification of the most interesting
targets.
The choice of 10 classifications as the first point at which a
candidate can be considered classified is a compromise between the
robustness of the classification and speed. Clearly, the greater the
number of classifications required for each candidate the slower the
classification process proceeds; yet the process must be robust
against both user mistakes (i.e., clicking the wrong button) and
misunderstanding.
The aim is to both quickly classify the best, high-scoring candidates
(which will rapidly exceed the threshold after
10 classifications), and to remove the worst candidates (which will
remain below ). More ambiguous candidates can
then obtain up to 10 extra classifications before completion. The
process continues until a target has received enough classification
scores that it is considered ‘done’, at which point it is removed from
the pool of available candidates. Our simulations based on the beta
versions indicated that this scheme is 2–3 times faster at
classifying than just using a random order.
3.5 Communication of results
The science of Galaxy Zoo Supernovae relies on new candidates being classified rapidly, and those classifications then being easily accessible to the science team.
3.5.1 Science dashboard
A key part of the Galaxy Zoo Supernovae website is a science
‘dashboard’ for the PTF team. The science dashboard provides basic
statistics on the number of candidate uploads, classifications and
volunteers versus time as well as a more in-depth breakdown of the
classification history for a candidate or individual.
Custom views have been created which break down a score ranked list of
candidates for each day and week allowing observing teams to use these
rankings to help in the identification of good candidates for follow
up observations. Candidates already identified as PTF transients show
the PTF identifier on the science dashboard and a link is also provided to
allow the science team to easily mark a highly-ranked candidate from
the Zoo in the PTF database.
3.5.2 Candidate alerts
In order to improve the rate at which objects are classified, an automated alert system that monitors the number of candidates being uploaded to the website is used. Should the number of unclassified candidates reach a threshold, the website sends an automated ‘alert’ to Galaxy Zoo Supernovae subscribers. These (email) alerts are usually sent out once per day, coinciding with the end of a night’s candidates being uploaded from NERSC, and usually result in the full complement of candidates being classified within a few hours.
3.5.3 ‘My Supernovae’
Providing feedback to the Galaxy Zoo Supernovae community is a vital
part of the overall website experience to encourage volunteers to
return to the website. This is partly done using forums and blogs
where scientists can comment on individual events classified by the
zoo. In addition, each volunteer can view a history of the candidates
that they have classified on their ‘My Supernovae’ page.
The ‘My Supernovae’ (MySN) page displays the candidate triplets.
Those which have been observed are overlaid with a small symbol identifying the candidate as a SN, variable star, or asteroid. Clicking on one of the candidates also
allows the volunteer to see the average rating across all
classifications, the number of classifiers and whether the candidate
was selected for followup by the PTF team. PTF observers are
encouraged to leave comments on the science dashboard that the
classifiers can also see on their MySN page.
4 Results
Galaxy Zoo Supernovae was first trialled on two specific occasions
supporting PTF spectroscopic follow-up observations at the 4.2m
William Herschel Telescope (WHT), in August 2009 and October 2009.
The selection of the candidates observed by WHT was guided by the Zoo
results, with a particular emphasis on comparing the classifications
produced by Galaxy Zoo Supernova with those produced by PTF human
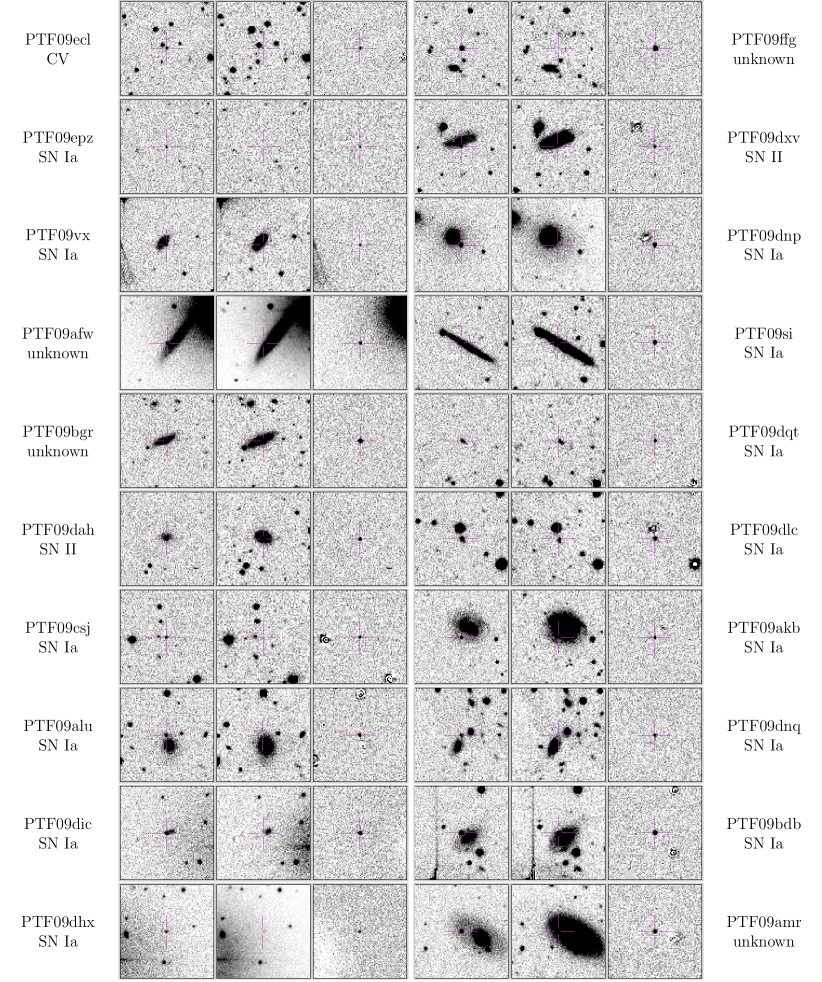
scanners working on the same data. The top 20 scored candidates from
this initial trial run of Galaxy Zoo Supernovae are shown in
Fig. 4. Sixteen of these candidates were observed by
WHT; 15 were confirmed as SNe, with 1 cataclysmic variable.
Since April 2010, Galaxy Zoo Supernovae has been running full-time on
PTF candidates, and by July 15th 2010 had classified SN
candidates at the rate of several hundred candidates per observing
night. In all but the earliest weeks of the project, all submitted
candidates were classified by the zoo. This classified sample forms
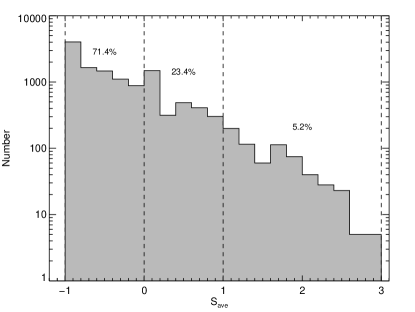
the basis of our analysis in this section. A distribution of the
scores () for all of these candidates can be found
in Fig. 5. The bulk of the candidates uploaded are
classified as likely not astrophysically real events, and correspond
to subtraction artefacts or other reduction problems. This is
indicative of the conservative cuts that are made in the PTF pipeline
to avoid losing real SN events for follow-up, and highlights the
currently essential requirement for visual inspection of the pipeline
candidates.
4.1 Comparison with professional classifiers
The performance of the public at classifying candidates can be gauged
by comparing with the classifications the PTF team assigned to the
same objects. The PTF team broadly classify objects into 4 visual
categories: not interesting (not assigned a type), asteroids, variable
stars, and transients (such as SNe). Asteroids are not screened for by
Galaxy Zoo Supernovae – only one image is uploaded for each PTF
candidate, which clearly cannot be used to distinguish moving objects.
Asteroids are typically removed from the candidate list prior to
upload by insisting on two separate detections of a candidate within
1″ of each other, though this process is not perfect,
particularly with slow moving asteroids where the apparent motion can
be only a few arcseconds a day.
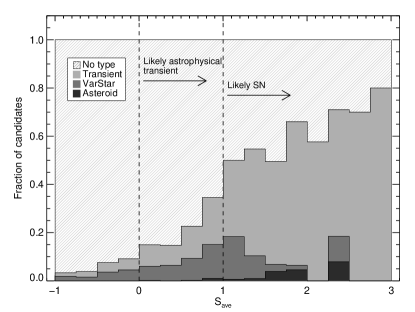
To illustrate the performance of Galaxy Zoo Supernovae, we split the
candidates by their PTF assigned categories and calculate the fraction
in each category as a function of .
Fig. 6 is a stacked box plot of the results. At low
scores practically all candidates are those which the PTF team decide
are not interesting: these will include poor subtractions,
artefacts/cosmic rays, etc.. As increases we see a
steady rise in the number of both variable star candidates and
transients. By a score of around , variable stars are no longer
selected, and instead the majority of the candidates are SN-like
transients.
A number of caveats should be borne in mind when examining this plot.
The first is that not all variable stars identified by Galaxy Zoo
Supernovae will be assigned that type by the PTF scanners. As the
primary goal of PTF is the study of explosive transients, variable
stars are frequently not recorded in the PTF catalogue (i.e., they
will be assigned “No type” in Fig. 6). The second
caveat is that each PTF candidate is potentially observed many times
over a period of several weeks over many epochs, yet should only be
uploaded to Galaxy Zoo Supernovae once. If there is some problem with
the particular epoch that is uploaded to the zoo (a poor image
subtraction, or poor seeing conditions), then a real astrophysical
event may be poorly scored by the zoo on that epoch. However, that
candidate may potentially be saved by a human scanner based on an
image from a different epoch. Thus real transient events can
occasionally be poorly scored by the zoo if the uploaded image is of
poor quality; this is the case for some of the real transients that
scored . Finally, it is important to note that the
true nature of many of the candidates remains unknown, and the
comparison drawn here is between the zoo selection and that of a
subjective (though experienced) expert opinion.
Figure 6 demonstrates that Galaxy Zoo Supernovae is
capable of prioritising good candidates, and that the highest ranked
candidates are likely to be SNe rather than variable stars. The
candidates which were classified as asteroids in the Galaxy Zoo
Supernovae sample are given a relatively high score by the zoo
volunteers – they typically mimic high-quality ‘hostless’ transient
events.
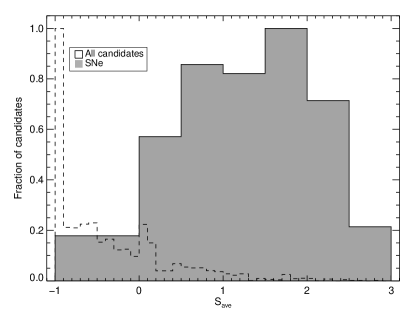
Some of the Galaxy Zoo Supernovae classified candidates were observed
spectroscopically by the PTF collaboration, as well as candidates
identified by other techniques. We examine the
distribution for these spectroscopically confirmed SNe
(Fig. 7), equivalent to 5–6 full nights of
4m-class telescope time (spread over 10 actual nights with a mix of
screening and follow-up of previously confirmed transients).
Approximately 93% of these SNe gathered by PTF over April–July 2010
were highly-scored () by the zoo (60% have
), and real SNe with a
comprise only 0.1% of all zoo objects scored with
. Though this may represent a slightly biased test
(low-scored candidates are less likely to be followed
spectroscopically), there are other techniques for screening
candidates within PTF that complement the zoo that partially mitigate
this bias. These include the PTF robot ( 2.1)
and some human scanning effort. It is encouraging that, to the degree
that we can test it, the zoo is capable of selecting the best SNe from
the PTF dataset. We also note that no highly-scored zoo candidate that
was observed spectroscopically turned out not to be a SN.
Note that the majority of the highly-scored Galaxy Zoo Supernovae
remain unobserved spectroscopically, particularly at the fainter end
of the candidate brightness. Some of these candidates are asteroids
(or more accurately, objects that only appear on a single night of
data). Others are probably real SNe for which there was insufficient
follow-up time available.
4.2 Effect of candidate brightness
Fig. 8 shows candidate scores from Galaxy Zoo
Supernovae as a function of the photometric apparent magnitude of
the candidate (with the host light subtracted) and the magnitude
error, both taken from the P48 PTF search pipeline. We plot these
relations separately for spectroscopically confirmed SNe and PTF
transients, and show the comparison with all PTF candidates as a set
of contours. This latter comparison highlights just what a small
fraction of all the PTF
candidates the real SNe and transients represent.
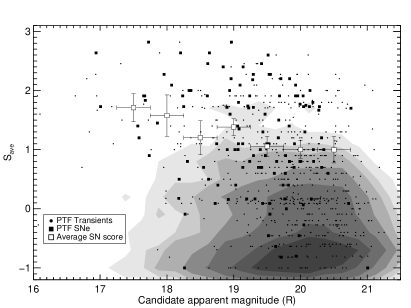
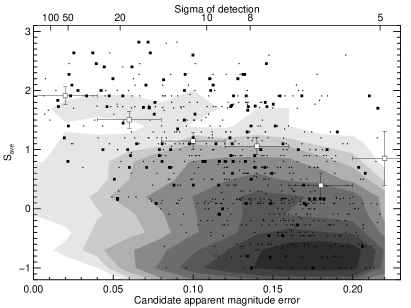
Fig. 8 shows a few interesting trends. For the
confirmed SNe, there is a mild decrease in as the
candidates become fainter (or have a larger error), at about
significance, or when considering the
magnitude error. (There is an equivalent trend for all the PTF
transients.) This is expected – at fainter magnitudes, SNe become
harder to identify visually with a noisier detection, and the
classification becomes more subjective. The SNe are also likely to be
at higher redshift, and thus perhaps appear more centrally located in
fainter host galaxies and are more likely to fail the final step in
the decision tree (Fig. 3).
Nonetheless, Galaxy Zoo Supernovae clearly identifies and scores
highly the bulk of the SNe from PTF, and at bright to intermediate
magnitudes the separation of SNe is robust. Even at fainter
magnitudes, the majority of the SNe score , and
above a detection significance of , the zoo scores all
SNe and the vast majority of PTF transients at .
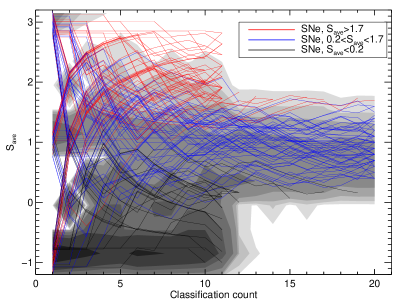
4.3 The scoring model
An analysis of the scoring model can reveal optimisations that can be
made to the number of classifications required for each candidate. As
an example, we show the ‘trajectory’ of for PTF
candidates as a function of the number of classifications in
Fig. 9. As expected, the variation in
when adding additional classifications is larger
when the total number of classifications is small compared to when
many classifications are available. It is also apparent that once
classifications have been received, very few candidates
change significantly.
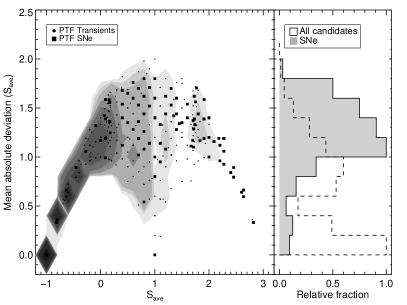
We also examine the dispersion in each of the Galaxy Zoo Supernova
scores, as calculated from the individual classifications, as a
function of the scores themselves. Fig. 10 plots the
mean absolute deviation in the score of each classified candidate as a
function of the final candidate score. As the individual scores from
which each is calculated are highly quantised (each
classification can only result in a score of -1, 1 or 3), the
resulting plot is highly structured. In particular, objects with
of -1 or 3 must have a dispersion of zero, and a
further dip in the dispersion is also seen around the third scoring
possibility, 1. While in principle the dispersion in the score might
be thought of as a good measure of the classification confidence
(measuring, in essence, the agreement between individual classifiers),
the current simple decision tree is not refined enough to allow this
statistic to be useful.
There therefore exists some room to improve the scoring model used by
Galaxy Zoo Supernovae (and hence the efficiency of the project). A
detailed analysis of the data in Fig. 9 shows that
reducing the number of classifications needed before a candidate is
considered classified ( 3.4) from to
(for intermediate scoring events) and from to (for low and
high scoring events) would reduce the total number of classifications
recorded by , while only moving a handful of candidates
(%) across the boundaries of and
.
In principle, an analysis of which volunteers consistently get the
classifications correct (when compared to a professional astronomer or
a spectroscopic classification) could be used to weight different
volunteer responses. For example, an experienced classifier with a
consistent history of correct responses could have a larger weight
than a novice volunteer – there is evidence from
Fig. 9 that even good SN candidates can receive the
lowest score (many SN trajectories start at an ).
Such a feature is not yet implemented in Galaxy Zoo Supernovae, but
could be used to arrive at a final more quickly.
4.4 Volunteer behaviour
To date, over 13,000 individuals from the Zooniverse community have
visited the Galaxy Zoo Supernovae site and 2,800 have classified one or more SN
candidates. This project relies upon the rapid classification of SN
candidates and although the community is relatively small compared to
e.g. Galaxy Zoo, a combination of email alerts and a committed core of
a few hundred individuals has made Galaxy Zoo Supernovae a success.
An analysis of the fraction of classifications contributed compared to
the average number of classifications per user shows that close to
90% of the classifications in Galaxy Zoo Supernovae are contributed
by less than 20% of the community. In the Galaxy Zoo 2 project
(Masters et al., 2010, Lintott et al., in prep.), close to 50% of the classifications were by individuals
whose total classification count was less than 10 galaxies; for Galaxy
Zoo Supernovae that fraction is 3%.
5 Future directions
This paper has introduced Galaxy Zoo Supernovae, a new web-based
citizen science project modelled after ‘Galaxy Zoo’, that uses members
of the public to identify good supernova candidates from wide-field
imaging data. Using data from the Palomar Transient Factory (PTF), we
have shown that the citizen scientists are extremely good at
identifying real SNe from amongst the thousands of candidates that PTF
generates, with only a small ‘false negative’ rate at the faintest
candidate magnitudes.
Clearly, Galaxy Zoo Supernovae is not restricted to PTF data and can
in principle be applied to any future imaging survey, such as
SkyMapper (e.g., Keller et al., 2007) or Pan-STARRS-1
(e.g., Kaiser, 2004). The candidate upload mechanism
is flexible, and the triplet format (Fig. 1)
simple, with custom results pages easily produced for individual
surveys. Perhaps the most exciting aspect for massive future transient
surveys such as the Large Synoptic Survey Telescope (LSST) will be the
use of Galaxy Zoo Supernovae classification data to improve the
training and accuracy of automated machine-learning transient
classifiers (Starr et al., 2009).
The underlying concept of Galaxy Zoo Supernovae is easily extended.
For example, there is also no need to restrict the project to single
images of new transient events. Multiple images of a potential SN from
different epochs, i.e. a candidate history, could also be uploaded to
improve the accuracy of the classifications and thus reduce the possibility of a mis-classification due to a single poor subtraction. If this included data
from before the candidate was first detected, those candidates with a
history of poor subtractions could quite trivially be eliminated.
Those asteroids and moving objects which do get uploaded could also be
removed by visually comparing the candidate position on several
epochs. Galaxy Zoo Supernovae could also be used to identify new
transients triggered by detections at other wavelengths, for example
to quickly identify optical counterparts to gamma-ray bursts, where
previous optical reference images might not exist and a timely search
is critical for follow-up.
Galaxy Zoo Supernovae could also be used for precise volumetric SN (or
any transient) rate determinations. In these calculations, the
efficiency of the search (the ratio of recovered to actual SN events)
needs to be accurately known, as a function of apparent magnitude and
other SN properties. By uploading ‘fake’ candidates (artificial SN
events inserted into the images) as well as real SNe, the reliability
of the zoo can be determined accurately and allow the discovery rate
to be converted into a real physical SN rate.
With the discovery stream of new transient types becoming ever larger,
and the dramatic increase set to continue with future surveys such as
the LSST, the burden of identifying the best new candidates increases
correspondingly. By engaging the considerable interest and enthusiasm
of the public, we have demonstrated that citizen science projects like
Galaxy Zoo Supernovae can play a major role in ongoing and future
transient surveys.
Acknowledgements
We acknowledge the valuable contributions of the Zooniverse community
without which this project would not have been possible. AS
acknowledges support from the Leverhulme Trust. MS acknowledges
support from the Royal Society. MS and AG acknowledge support from a
Weizmann–UK “Making conenctions” grant. CJL acknowledges support
from the STFC Science in Society Program and The Leverhulme Trust.
PEN acknowledges support from the US Department of Energy Scientific
Discovery through Advanced Computing program under contract
DE-FG02-06ER06-04. KS acknowledges support from a NASA Einstein
Postdoctoral Fellowship grant number PF9-00069, issued by the Chandra
X-ray Observatory Center, which is operated by the Smithsonian
Astrophysical Observatory for and on behalf of NASA under contract
NAS8-03060. JSB acknowledges support of an NSF-CDI grant “Real-time
Classification of Massive Time-series Data Streams” (Award #0941742).
The National Energy Research Scientific Computing Center, which is
supported by the Office of Science of the U.S. Department of Energy
under Contract No. DE-AC02-05CH11231, provided staff, computational
resources and data storage for this project.
The William Herschel Telescope is operated on the island of La Palma
by the Isaac Newton Group in the Spanish Observatorio del Roque de los
Muchachos of the Instituto de Astrof sica de Canarias. Observations
obtained with the Samuel Oschin Telescope at the Palomar Observatory
as part of the Palomar Transient Factory project: a scientific
collaboration between the California Institute of Technology, Columbia
University, Las Cumbres Observatory, the Lawrence Berkeley National
Laboratory, the National Energy Research Scientific Computing Center,
the University of Oxford, and the Weizmann Institute of Science.
References
- Alard (2000) Alard C., 2000, A&AS, 144, 363
- Astier et al. (2006) Astier P., Guy J., Regnault N., Pain R., Aubourg E., Balam D., Basa S., Carlberg R. G., Fabbro S., Fouchez D., Hook I. M., Howell D. A., Lafoux H., Neill J. D., Palanque-Delabrouille N., Perrett K., Pritchet C. J., Rich J., Sullivan M., Taillet R., Aldering G., Antilogus P., Arsenijevic V., Balland C., Baumont S., Bronder J., Courtois H., Ellis R. S., Filiol M., Gonçalves A. C., Goobar A., Guide D., Hardin D., Lusset V., Lidman C., McMahon R., Mouchet M., Mourao A., Perlmutter S., Ripoche P., Tao C., Walton N., 2006, A&A, 447, 31
- Bertin & Arnouts (1996) Bertin E., Arnouts S., 1996, A&AS, 117, 393
- Frieman et al. (2008) Frieman J. A., Bassett B., Becker A., Choi C., Cinabro D., DeJongh F., Depoy D. L., Dilday B., Doi M., Garnavich P. M., Hogan C. J., Holtzman J., Im M., Jha S., Kessler R., Konishi K., Lampeitl H., Marriner J., Marshall J. L., McGinnis D., Miknaitis G., Nichol R. C., Prieto J. L., Riess A. G., Richmond M. W., Romani R., Sako M., Schneider D. P., Smith M., Takanashi N., Tokita K., van der Heyden K., Yasuda N., Zheng C., Adelman-McCarthy J., Annis J., Assef R. J., Barentine J., Bender R., Blandford R. D., Boroski W. N., Bremer M., Brewington H., Collins C. A., Crotts A., Dembicky J., Eastman J., Edge A., Edmondson E., Elson E., Eyler M. E., Filippenko A. V., Foley R. J., Frank S., Goobar A., Gueth T., Gunn J. E., Harvanek M., Hopp U., Ihara Y., Ivezić Ž., Kahn S., Kaplan J., Kent S., Ketzeback W., Kleinman S. J., Kollatschny W., Kron R. G., Krzesiński J., Lamenti D., Leloudas G., Lin H., Long D. C., Lucey J., Lupton R. H., Malanushenko E., Malanushenko V., McMillan R. J., Mendez J., Morgan C. W., Morokuma T., Nitta A., Ostman L., Pan K., Rockosi C. M., Romer A. K., Ruiz-Lapuente P., Saurage G., Schlesinger K., Snedden S. A., Sollerman J., Stoughton C., Stritzinger M., Subba Rao M., Tucker D., Vaisanen P., Watson L. C., Watters S., Wheeler J. C., Yanny B., York D., 2008, AJ, 135, 338
- Hillebrandt & Niemeyer (2000) Hillebrandt W., Niemeyer J. C., 2000, ARA&A, 38, 191
- Kaiser (2004) Kaiser N., 2004, in Presented at the Society of Photo-Optical Instrumentation Engineers (SPIE) Conference, Vol. 5489, Society of Photo-Optical Instrumentation Engineers (SPIE) Conference Series, J. M. Oschmann Jr., ed., pp. 11–22
- Keller et al. (2007) Keller S. C., Schmidt B. P., Bessell M. S., Conroy P. G., Francis P., Granlund A., Kowald E., Oates A. P., Martin-Jones T., Preston T., Tisserand P., Vaccarella A., Waterson M. F., 2007, Publications of the Astronomical Society of Australia, 24, 1
- Law et al. (2009) Law N. M., Kulkarni S. R., Dekany R. G., Ofek E. O., Quimby R. M., Nugent P. E., Surace J., Grillmair C. C., Bloom J. S., Kasliwal M. M., Bildsten L., Brown T., Cenko S. B., Ciardi D., Croner E., Djorgovski S. G., van Eyken J., Filippenko A. V., Fox D. B., Gal-Yam A., Hale D., Hamam N., Helou G., Henning J., Howell D. A., Jacobsen J., Laher R., Mattingly S., McKenna D., Pickles A., Poznanski D., Rahmer G., Rau A., Rosing W., Shara M., Smith R., Starr D., Sullivan M., Velur V., Walters R., Zolkower J., 2009, PASP, 121, 1395
- Lintott et al. (2010) Lintott C., Schawinski K., Bamford S., Slosar A., Land K., Thomas D., Edmondson E., Masters K., Nichol R., Raddick J., Szalay A., Andreescu D., Murray P., Vandenberg J., 2010, ArXiv e-prints
- Lintott et al. (2008) Lintott C. J., Schawinski K., Slosar A., Land K., Bamford S., Thomas D., Raddick M. J., Nichol R. C., Szalay A., Andreescu D., Murray P., Vandenberg J., 2008, MNRAS, 389, 1179
- Masters et al. (2010) Masters K. L., Nichol R. C., Hoyle B., Lintott C., Bamford S., Edmondson E. M., Fortson L., Keel W. C., Schawinski K., Smith A., Thomas D., 2010, ArXiv e-prints
- Nugent et al. (2010) Nugent P., Cenko S. B., Miller A. M., Poznanski D., Bloom J. S., Filippenko A. V., Sullivan M., Howell D. A., Quimby R. M., Ofek E. O., Kasliwal M. M., Kulkarni S. R., Law N. M., Dekany R. G., Rahmer G., Hale D., Smith R., Zolkower J., Velur V., Walters R., Henning J., Bui K., McKenna D., Jacobsen J., 2010, The Astronomer’s Telegram, 2600, 1
- Perrett et al. (2010) Perrett K., Balam D., Sullivan M., Pritchet C., Conley A., Carlberg R., Astier P., Balland C., Basa S., Fouchez D., Guy J., Hardin D., Hook I. M., Howell D. A., Pain R., Regnault N., 2010, AJ, 140, 518
- Rau et al. (2009) Rau A., Kulkarni S. R., Law N. M., Bloom J. S., Ciardi D., Djorgovski G. S., Fox D. B., Gal-Yam A., Grillmair C. C., Kasliwal M. M., Nugent P. E., Ofek E. O., Quimby R. M., Reach W. T., Shara M., Bildsten L., Cenko S. B., Drake A. J., Filippenko A. V., Helfand D. J., Helou G., Howell D. A., Poznanski D., Sullivan M., 2009, PASP, 121, 1334
- Sako et al. (2008) Sako M., Bassett B., Becker A., Cinabro D., DeJongh F., Depoy D. L., Dilday B., Doi M., Frieman J. A., Garnavich P. M., Hogan C. J., Holtzman J., Jha S., Kessler R., Konishi K., Lampeitl H., Marriner J., Miknaitis G., Nichol R. C., Prieto J. L., Riess A. G., Richmond M. W., Romani R., Schneider D. P., Smith M., Subba Rao M., Takanashi N., Tokita K., van der Heyden K., Yasuda N., Zheng C., Barentine J., Brewington H., Choi C., Dembicky J., Harnavek M., Ihara Y., Im M., Ketzeback W., Kleinman S. J., Krzesiński J., Long D. C., Malanushenko E., Malanushenko V., McMillan R. J., Morokuma T., Nitta A., Pan K., Saurage G., Snedden S. A., 2008, AJ, 135, 348
- Smartt (2009) Smartt S. J., 2009, ARA&A, 47, 63
- Starr et al. (2009) Starr D. L., Bloom J. S., Brewer J. M., Butler N. R., Poznanski D., Rischard M., Klein C., 2009, in Astronomical Society of the Pacific Conference Series, Vol. 411, Astronomical Society of the Pacific Conference Series, D. A. Bohlender, D. Durand, & P. Dowler, ed., pp. 493–+