Two Epochs of Very Large Array Observations of Water Maser Emission in the active galaxy NGC 6240
Abstract
Studies of 22GHz H2O maser emission from the merging galaxy NGC 6240 (catalog ) with double nuclei are presented. Two epochs of Very Large Array (VLA) observations in the A-configuration in spectral-line mode were carried out at 0.1 arcsec resolution by covering the redshifted velocity range of 300 km swith respect to the systemic velocity of the galaxy. The purpose of these new observations is twofold: to detect an H2O maser that an earlier VLA observation pinpointed in the southern nucleus in the northern nucleus as well to clarify the kinematics of the double nuclei, and to understand the origin of the maser in the galaxy. In the second epoch, one velocity feature peaking at = 7491.1 km s-1, redshifted by 200 km srelative to the systemic velocity, was detected only toward the southern nucleus. The detection of an H2O maser feature at or near this velocity had never been reported in earlier observations. However, including the known velocity features at redshifted velocities, no other velocity features were observed toward either nuclei throughout these epochs. The maser remains unresolved at an angular resolution of .1, corresponding to a linear size of less than about 45 pc. The two epochs of VLA observations show that the maser intensity is variable on timescales of at least three months, while the correlation between the maser intensity and the radio continuum intensity is not certain from our data. It is plausible that the maser in NGC 6240 (catalog ) is associated with the activity of an active galactic nucleus in the southern nucleus. Alternatively, the maser can be explained by starforming activity at the site of massive starformation in the galaxy.
1 Introduction
NGC 6240 (catalog ) is a luminous infrared merging galaxy with large far-infrared (FIR) luminosity of = 3.5 1011 (Yun & Carilli, 2002). Due to this, NGC 6240 (catalog ) has been categorized as a luminous infrared galaxy (LIRG) with = 1011-12 , or almost as an ultraluminous infrared galaxy (ULIRG) with 1012 (e.g., Sanders et al., 1988). The power source of the large infrared luminosity of U/LIRGs is generally believed to be starburst activity induced by the galaxygalaxy interaction or merger and UV radiation from massive star formation is thought to be reprocessed to FIR radiation in the dusty environment (e.g., Sanders et al., 1988; Skinner et al., 1997). Infrared spectroscopy of hydrogen emission lines shows that the origin of the large FIR luminosity of NGC 6240 (catalog ) cannot account for only the starburst activity but can be more naturally understood in terms of a buried active galactic nucleus (AGN) heating surrounding dusty components. (e.g., Depoy, Becklin, & Wynn-Williams, 1986). () observations revealed that the most dominant power source of ULIRGs including NGC 6240 (catalog ) within the large apertures of is a starburst. (Genzel et al., 1998). observations of NGC 6240 (catalog ) detected a buried AGN for the first time in the mid-infrared (MIR) band, which suggests the presence of warm dust ( 700 K) surrounding the AGN (Armus et al., 2006). Modeling of the total spectral energy distribution from near-infrared (NIR) to FIR wavelengths suggests that the fraction of AGN contribution to the bolometric luminosity in NGC 6240 is approximately 2024 (Armus et al., 2006), which is consistent with studies. The galaxy hosts two nuclei that are distinctly separated by 1.5-1.8, which depends on observing wavelengths (Fried & Schulz, 1983; Colbert et al., 1994; Beswick et al., 2001; Max et al., 2005). The hard X-ray detection of the two point sources, positions of which coincide with those of the two optical and infrared nuclei, provides observational evidence for a merging supermassive black hole (SMBH) scenario (Komossa et al., 2003). Both nuclei show characteristics of AGNs based on the detection of neutral Fe K lines at 6.4 keV due to reflection from optically thick material (Boller et al., 2003; Komossa et al., 2003), and a most prominent AGN is situated at the southern nucleus, where the obscuration is higher.
NGC 6240 (catalog ) is known to show prominent Hand OH absorption against the nuclear radio continuum (Baan et al., 1985). MERLIN observations distinguished the different velocity structures at each of the double nuclei in terms of Habsorption (Beswick et al., 2001). Earlier Very Large Array (VLA) observations in the 1.4 and 1.6 GHz bands (Hagiwara, Baan, & Hofner, 2007; Baan, Hagiwara & Hofner, 2007) studied both the extended and compact Hand OH absorption: the His distributed across the extended radio continuum structure with a significant concentration toward the two nuclei, while OH is confined mostly between the nuclei, closer to the peaks of thermal molecular gas such as CO (e.g., Nakanishi et al., 2005). Moreover, Very Long Baseline Interferometer (VLBI) observations with the Very Large Baseline Array (VLBA) (Gallimore & Beswick, 2004) detected two compact radio sources near the positions of the two radio nuclei (e.g., Colbert et al., 1994). Brightness temperatures of these sources exceed 7 106 K for the northern component and 1.8 107 K for the southern component, suggesting that both are associated with AGNs.
Observations of thermal molecular lines with millimeter interferometers identified significant concentrations of dense molecular gas between the double radio/optical/X-ray nuclei (Bryant & Scoville, 1999; Tacconi et al., 1999; Nakanishi et al., 2005; Iono et al., 2007), where a significant amount of H2 emission is detected (Ohyama et al., 2000). Iono et al. (2007) updated the values of dense and warm gas mass in the central 1 kpc of the galaxy and reported the detection of a dust continuum at submillimeter wavelengths.
The tentative detection of H2O maser emission in the galaxy was first reported in 1984 by Henkel et al.. However, the emission was only confirmed in the spring of 2001 by two independent measurements (Hagiwara et al., 2002; Nakai et al., 2002). In early summer 2001, detections of several velocity features in NGC 6240 (catalog ) were reported from the measurements at Effelsberg, Greenbank, and Nobeyama (Hagiwara et al., 2002; Braatz et al., 2003; Nakanishi et al., 2008). Follow-up interferometric observations of these maser features were performed and the location of one of the maser features was pinpointed in the center of the southern nucleus of NGC 6240 (Hagiwara et al., 2003).
New interferometric observations of the H2O maser intended to observe the binary AGN in NGC 6240 and aiming at the first detection of the H2O maser from the northern nucleus are presented here. The results of these new observations will be useful as a basis for future detailed studies of the black hole masses and kinematics in this rare binary SMBH system. Cosmological parameters of = 73 km sMpc-1, Λ = 0.73, and M = 0.27 are adopted throughout this article. The luminosity distance to NGC 6240 is therefore 103 Mpc (=0.0245), and 1 arcsec corresponds to 476 pc in the linear scale.
2 OBSERVATIONS AND DATA REDUCTION
Observations of 22 GHz H2O maser emission (6 transition) toward NGC 6240 (catalog ) were conducted using the NRAO111The National Radio Astronomy Observatory is a facility of the National Science Foundation operated under cooperative agreement by Associated Universities, Inc. VLA in Aconfiguration on 2008 October 3 and 2009 January 12. Each observation lasted approximately four hours. During this period, due to a source of unknown noises associated with using the 12.5 MHz bandwidth with the VLA correlator, we chose to use the VLA 2AB correlator mode with two 6.25 MHz intermediate frequencies (IFs) at two different frequency settings. The observations were thus made employing the two IFs of 6.25 MHz bandwidth with a single polarization, divided into 64 spectral channels, yielding velocity resolutions of 98 kHz (1.32 km s-1). For this reason, the velocity resolution of our new observations is narrower than that of earlier VLA observations in Hagiwara et al. (2003) by a factor of two. Phase-referencing observations were performed by switching to a nearby phase-referencing source 1658+074, the position of which is 5.4 away from NGC 6240. Each of the two 6.25 MHz IFs was centered at one frequency setting and changed to the other frequency setting by shifting the center frequency during observations. By doing this, we obtained four IF center frequencies, centered at = 7410, 7480, 7550, and 7620 km s-1, which resulted in 300 km seffective velocity coverage. We conducted phase-referencing observations at one frequency set for three minutes and changed the observation to the other frequency set for three minutes. The observations were thus made cycling between the two frequency settings so that the maximum velocity coverage was obtained within the limited bandwidths. However, due to this time-share between two frequency settings, sensitivities are a factor of 1.4 worse than what would be achievable using the two 12.5 MHz IFs.
Amplitude and bandpass calibration was performed using observations of 3C 286. The flux-density scaling error relative to assumed standards is reported by the VLA Observational Status Summary to be less than 1% in the 22 GHz band (Ulvestad et al., 2009). However, flux scaling errors of 5% are conservatively adopted. Flux-density uncertainties thus include noise, the assumed 5 % uncertainty in the flux density scale, and other calibration errors such as fitting errors, added in quadrature. For the calibrator source, 1658+074, we obtained a flux density of 1.98 0.02 Jy.
The data were calibrated and imaged using the NRAO Astronomical Image Processing Software (AIPS). After the phase and amplitude calibrations, the 22 GHz continuum emission of NGC 6240 was subtracted from the spectral line visibilities using line-free channels prior to the imaging and CLEAN deconvolution of the maser emission. The maser in NGC 6240 (catalog ) was thus separated out from the 22 GHz continuum emission, while the continuum image was made from single IF channel (”channel 0”) visibilities.
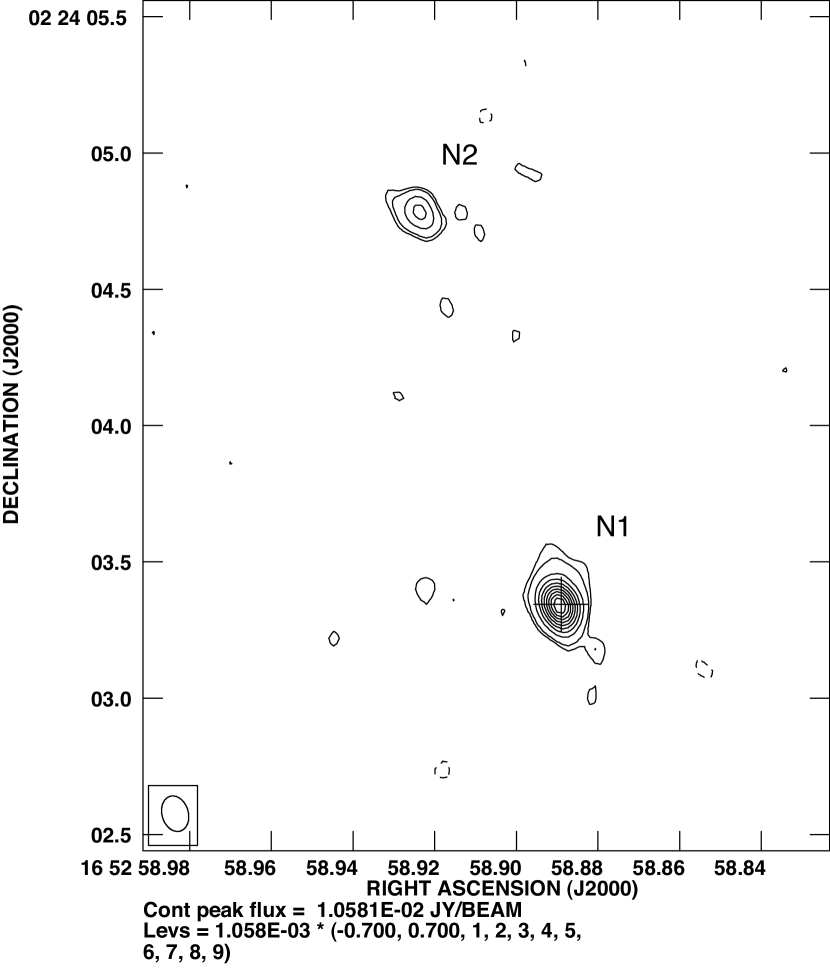
The synthesized beam sizes produced from uniformly and naturally weighted spectral-line maps were 0.104 0.092 arcsec2 (P.A.=10.4) and 0.135 0.082 arcsec2 (P.A.=8.6) respectively. The beam size of a uniformly-weighted continuum map is 0.097 0.085 arcsec2 (P.A.=10.4). A naturally-weighted continuum map is shown in Figure 1. The rms noises of spectral line maps in uniform and natural weight were 1.1 mJy beam-1and 0.8 mJy beam-1per spectral channel respectively. The rms noises of the continuum maps were 0.3 mJy beam-1(uniform weight) and 0.25 mJy beam-1(natural weight). The optical velocity definition is adopted throughout this article and the velocities are calculated with respect to the local standard of rest (LSR).
3 DATA ANALYSIS AND RESULTS
The data obtained from the two epochs of VLA observations are summarized in Table 1. A naturally weighted 22 GHz continuum map produced from the combined data of the two epochs is presented in Figure 1. The 22 GHz continuum map consists of the two radio sources, both coinciding with the radio nuclei obtained at lower frequencies with similar angular resolution (e.g., Carral et al., 1990; Colbert et al., 1994; Beswick et al., 2001). However, extended components (e.g., Colbert et al., 1994; Baan, Hagiwara & Hofner, 2007) seen at lower VLA resolution maps in the literature were resolved in our continuum map due to the lack of short spacings of the A-configuration. Hereafter, we follow the naming convention of radio components in NGC 6240 (catalog ) by Colbert et al. (1994) for the nuclei N1 (the southern nucleus) and N2 (the northern nucleus).
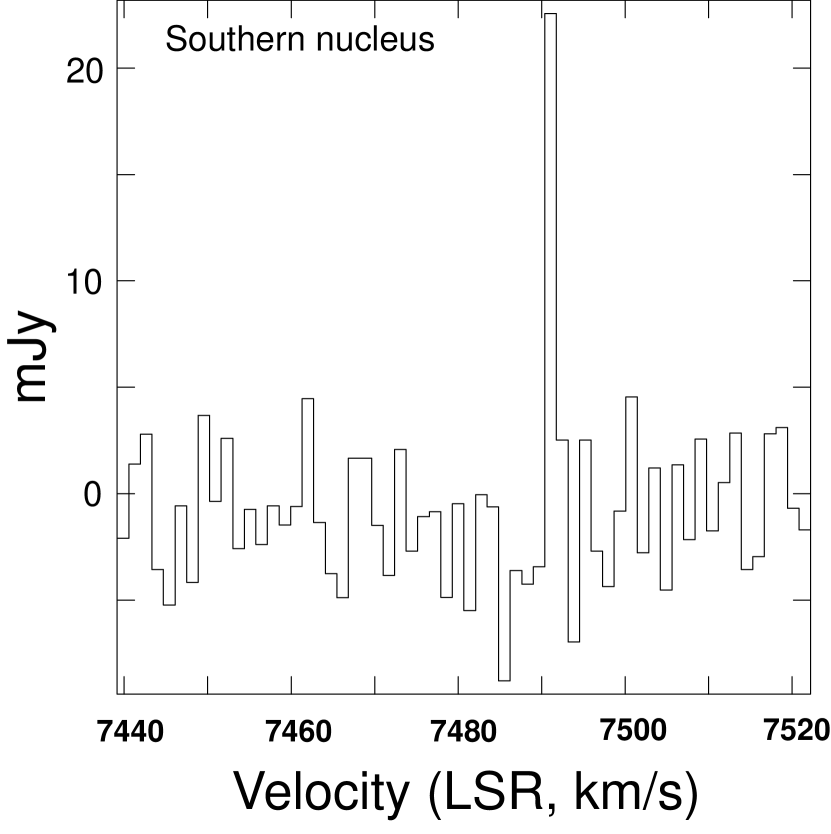
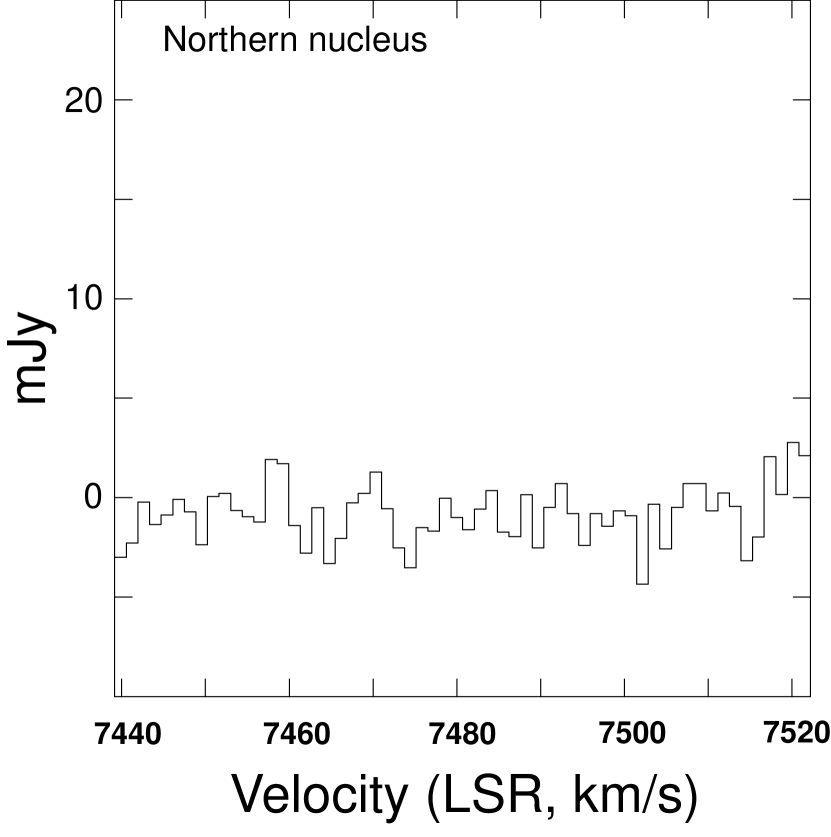
H2O masers in the galaxy were sought for each nucleus in the LSR velocity range of 73707660 km s-1, where H2O maser features were detected in earlier single-dish observations (see Table 5). In the first epoch of 2008 October 3, no H2O maser was detected with a 5 noise level of 4 mJy. The maser was detected at = 7491.1 0.2 km son 2009 January 12 in the second epoch, although the maser remains unresolved at an angular resolution of 0.1 or 47.6 pc. There is no doubt that the maser varied within about three months in the period between October 2008 and January 2009. The position of the only maser detected in this program is (J2000): 16h52m58889, (J2000): +02.34. (Position errors without consideration of systematic errors are 0.007.) Throughout the two observing epochs, in the spectra averaged over these epochs no H2O maser was seen from the northern nucleus nor from any other point with a 5 limit of 4-6 mJy within the field of view 1010 nearly centered on the southern nucleus. Figure 2 shows the detected H2O maser, the position of which is indicated in the continuum map in Figure 1. The peak flux density of the maser was 22.6 1.4 mJy and the shape of the spectrum is thin and narrow, similar to the known features seen at other velocities. The location of the maser coincides with the peak of the southern radio nucleus N1 (Figure 1).
The relative positional errors, dominated by statistical noises, between the maser and the continuum peak () are approximately given by the equation , where and represent the synthesized beam sizes of continuum and line maps, and SNRc and SNRl represent signal-to-noise ratios of the continuum and line maps (e.g., Thompson et al., 1986; Hagiwara et al., 2001), respectively. Consequently, the relative approximate positional error between the maser feature at =7491.1 km sand the 22 GHz continuum peak (N1) is 0.0028 (The inserted values were adopted from the map in Figures 1 and 2. Major axis values are used for the synthesized beams.). This value corresponds to 1.3 pc at a distance from NGC 6240 (catalog ). Comparison of the relative positional error (3 pc) of the 7611 km sfeature measured with VLA at the B-configuration (Hagiwara et al., 2003) with that of the newly detected 7491.1 km sfeature in this program shows that the positional uncertainties between the maser and the southern nucleus (N1) are more constrained by a factor of about two with our new measurement.
A summary of relevant observations of H2O maser in NGC 6240 (catalog ) is given in Table 5, which shows all the velocity features reported in the literature.
Figure 3 shows time variability of the maser and 22 GHz continuum flux density, from which the correlation between the maser flux and the 22 GHz continuum flux from each of the nuclei is not certain. This needs to be examined with further flux monitoring. Note that no distinct correlation between the maser and higher frequency radio continuum intensity is seen via single-dish monitoring from 2003 to 2007 (Nakanishi et al., 2008).
4 DISCUSSION
One goal of this project was to study the origin of the maser and kinematics of the nuclear region of NGC 6240 (catalog ). Another goal was to clarify the radio properties of the northern nucleus. As a result of the non-detection of the maser in the northern nucleus, the latter turned out to be impossible in this article.
4.1 Origin of the H2O maser in NGC 6240
4.1.1 Nuclear maser in AGN
In a series of VLA observations from 2002 to 2009 to determine the positions of masers in each of the double nuclei, the two velocity features peaking at = 7491 and 7611km swere detected, both of which were pinned down toward the center of the southern nucleus but no other maser was observed toward the northern nucleus throughout the observations. Given the fact that the other features (Table 5) reported to date are all redshifted by 200–300 km swith respect to both the systemic velocity of the galaxy (7304 km s-1) and the Hpeak velocity at N1 (7295 km s-1: the ”systemic” velocity of the southern nucleus) (Baan, Hagiwara & Hofner, 2007), it is likely that other redshifted features lying in the velocity range 7561.5–7611.0 km smostly arise from the southern nucleus.
This non-detection of the maser toward the northern nucleus is not surprising, if we consider the small probability of the two maser disks around each of the nuclei being aligned edge-on in the line of sight at the same time. (If the maser in one or both nuclei is not a disk maser, this is not the case.) It is important that the column density of N1, measured by X-ray observations, is at least a factor of several higher than that of N2 (Komossa et al., 2003) and that the maser in N1 could be more enhanced through the thicker dust layer in our line of sight, amplifying the background radio source of N1. Also, the non-detection of the maser except for the compact continuum nucleus is consistent with the presence of a background nuclear continuum source being necessary to excite H2O megamasers that are associated with AGN activity (e.g., Moran et al., 1999). On the other hand, the X-ray measurements of NGC 6240 revealed that both nuclei show the Compton-thick properties (Matt et al., 2000), meaning each of them could host an obscured AGN. In this sense, it is plausible that the northern nucleus could exhibit H2O maser emission.
One of the most remarkable results from these observations is that the position of the maser is more constrained within 1.3 pc from the southern nucleus peak, which agrees with nuclear masers in the AGNs in some spiral galaxies, or to be more precise ”disk masers”, which trace highly inclined disk structures at radii 0.11 pc from the central engines (e.g., Greenhill et al., 2009).
A few maser features in the galaxy appear to drift in line of sight velocities: the 7609 km sfeature and 7565.0 0.8 km sfeature show tentative velocity drifts by 1.3 1.4 0.7 km syear-1 (Hagiwara et al., 2003; Braatz et al., 2003). If this drift is real and a rotating disk model is assumed (Greenhill et al., 1995), taking an upper limit for the velocity acceleration of 1.4 km syear-1, a lower limit for a disk inclination 45 adopted from X-ray data (Matt et al., 2000), and the nominal rotation velocity of 300 km s-1, the disk radius around N1 is estimated to be 0.03 pc. This is sort of a lower limit value of a thin disk radius (0.1–1 pc) that VLBI imaging observations have revealed (e.g., Miyoshi et al., 1995; Greenhill et al., 2003), which is traced by discrete H2O maser features in the AGN. Other narrow maser lines (Table 5) that are broadly spread in velocity ( 7442–7565 km s-1) could be interpreted as emission from a nuclear outflow within 1 pc from the central engine as in Circinus (Greenhill et al., 2003).
It is interesting that the detected maser is all redshifted with respect to the systemic velocity by up to 300km s-1, the value of which is comparable with those of the redshifted masers that are associated with a receding side of the AGN jet in NGC 1052 (catalog ) (e.g., Claussen et al., 1998) and Mrk 348 (catalog ) (Falcke et al., 2000; Peck et al., 2003). For NGC 6240 (catalog ), time variability of the radio continuum emission, caused primarily by ejection of a jet component from the AGN, is not correlated with that of the maser. This makes it hard to explain that the maser comes from the radio ejecta from the AGN. On the other hand, the H2O megamaser in the Seyfert 2 galaxy Mrk 348 (catalog ) (Miller & Goodrich, 1990) is known to show the variation of H2O maser flux on the timescale of one day that is correlated with that of 22 GHz radio continuum flux, in which the maser amplification is considered to occur as the result of an interaction between a radio jet and molecular materials (Falcke et al., 2000; Peck et al., 2003). Follow-up VLBI observations of Mrk 348 (catalog ) indicated the H2O maser emission distributed along with a jet component in the galaxy (Peck et al., 2003). In the elliptical galaxy NGC 1052 (catalog ) which is classified as a LINER (Ho et al., 1997), Kameno et al. (2005) revealed the correlation between H2O maser flux and radio continuum flux on a timescale of days, which is possibly due to an interaction of a sub-relativistic jet and a combination of ionized and X-ray dissociated regions. Considering these facts, one might be able to predict the timing of the maser flare in NGC 6240 by monitoring the continuum flux at short time intervals. However, there has been no strong evidence for the correlation between the maser flux and the continuum flux of the double nuclei in NGC 6240.
4.1.2 H2O maser in starburst region
data of ionized emission line (Hα+[NII]) gas (Gerssen et al., 2004) show no clear hint of the rotation around the double nuclei, however, the velocity gradient of the ionized emission line gas shows a sign of rotation around a point between N1 and N2, which is similar to the central condensation of molecular gas (CO) and the presence of a rotating disk (e.g., Tacconi et al., 1999) at a point between nuclei. These results cannot account for the kinematics of the H2O maser, as the maser is seen only on N1. Based on the stellar velocity field from the NIR imaging, Tecza et al. (2000) found that the southern nucleus shows a velocity gradient, and they estimated the fitted rotation velocity of 270 90 km s-1over the nucleus, assuming the inclination and rotation axis. This value largely covers the velocity range of the detected maser up to 300 km swith respect to the systemic velocity of the southern nucleus. However, the stellar velocity field cannot be directly related to the velocity range of the maser.
The isotropic luminosity of 7 (=7491km s-1) in the maser of NGC 6240 is low for a megamaser associated with an AGN, and it is consistent with intense H2O masers in our Galaxy or starburst galaxies although it is brighter by approximately an order of magnitude than masers in Galactic starforming regions or starbursts such as W49N (e.g., Walker, Matsakis, & Garcia-Barreto, 1982) or NGC 253 (catalog ) (Ho et al., 1987). There is compelling evidence for a superwind from the emission nebula in the galaxy, which is a large scale outflow arising from massive stars in starburst activity. Such an outflow can produce shock and accelerate ambient gas in the nuclear region (Gerssen et al., 2004, and references therein), which could also give rise to the maser (Elitzur, Hollenbach, & McKee, 1989).
Heckman et al. (1990) discovered a large-scale superwind in NGC 6240 with a spreading speed of more than 1000 km swith the superwind being powered by starburst activity such as massive starformation or a number of supernovae in the nuclear region of the galaxy. In such a massive starforming region, the maser could be associated with molecular outflows, where only the receding side of the outflow exhibits maser emission to explain the redshift of the maser. Elitzur, Hollenbach, & McKee (1989) explain that dense dissociative shocks can excite masers in the postshock gas at the maximum shock velocity 300 km s-1, within which dust grains have compression in postshock gas so that H2O molecules form from hydrogen molecules and H2O abundance becomes sufficient for maser excitation. Taking this into account, the fact that the observed maser redshifted by 150–300 km sis consistent with a scenario in which the maser comes from the nuclear superwind driven by nuclear starburst. However, this scenario cannot explain why the maser has been detected only in the nucleus of the galaxy, but not in other points in the nuclear region of the galaxy.
4.2 Comparison with the H2O maser in Arp 299
The merging starburst system Arp 299 (catalog ) consists of two galaxies, IC 694 (catalog ) (designated as A) and NGC 3690 (catalog ) (designated as B or B1) (Neff et al., 2004). One or both nuclei are thought to host AGNs in terms of hard X-ray spectroscopic imaging observations (e.g., Ballo et al., 2004), the VLBI imaging of the compact radio sources (Ulvestad, 2009; Pérez-Torres et al., 2010), and the VLA detection of an H2O maser near both nuclei (Tarchi et al., 2010). The maser in IC 694 is detected 0.2 away from the nucleus, while the maser in NGC 3690 coincides with the nucleus within 0.1, the VLA synthesized beam size in A-configuration (Tarchi et al., 2010). The maser in IC 694 is likely to be an ”off-nuclear maser”, while the maser in NGC 3690 with a relatively low isotropic maser luminosity of L 20 seems to be associated with an active nucleus, arguing for an AGN origin of this low-luminosity H2O maser (Hagiwara, 2007). The maser in NGC 6240 (catalog ) broadly resembles the maser detected in Arp 299; the H2O maser in these galaxies is associated with only one of the active nuclei. The probability of H2O masers in both double nuclei in merging galaxies is thus inferred to be very small. The broader line widths of the maser in Arp 299 (Henkel et al., 2005) might suggest that the maser is associated with an AGN jet component but not exactly with the nucleus. High-sensitivity VLBI observations of the H2O masers will be able to clarify the origin of the maser in Arp 299.
5 SUMMARY
VLA observations of the H2O maser in NGC 6240 conducted at the highest angular resolution of 0.1 constrained the location of the maser from the center of the continuum nucleus, which indicates the presence of dense molecular gas or a maser disk within 1.3 pc from the nucleus. The interpretation of the origin of the H2O maser in the galaxy is not straightforward. Although three epochs of VLA observations during nearly seven years failed to detect any maser toward the northern nucleus, this implies that a disk in the northern nucleus is not highly inclined in the line of sight, while a disk in the southern nucleus could be nearly edge-on in the line of sight, if the masers in both nuclei are disk masers. It is not clear that the maser in NGC 6240 is associated with the jet in the AGN, as no prominent radio jet shown by the sub-parsec scale VLBI observations has been found in the galaxy and no correlation has been established between the maser flux and the radio continuum flux. It is also possible that the maser arises from the violent starburst activity induced by the galaxy-galaxy merging that is taking place in the galaxy. However, the latter interpretation is less appealing for the origin of the maser in NGC 6240 (catalog ) because the maser has been pinned down only on the peak of the nucleus. To clarify these possibilities, detection of maser features over a wider velocity span and follow-up VLBI-imaging observations at milliarcsecond resolution will be required.

| Epoch | Southern Nucleus(N1) | Northern Nucleus(N2) | |||
|---|---|---|---|---|---|
| FT | |||||
| (2) | (3) | (4) | (5) | ||
| (mJy beam-1) | (mJy) | (mJy beam-1) | (mJy) | ||
| 2002 Junea | 12.30.8 | 16.91.1 | 4.30.3 | 6.90.5 | |
| 2008 Oct | 9.90.6 | 11.30.7 | 5.00.4 | 5.50.4 | |
| 2009 Jan | 11.00.6 | 13.00.7 | 3.90.3 | 4.30.3 | |
Note. — Columns 2 and 4: peak flux density (mJy beam-1); Columns 3 and 5: total flux density (mJy) in the uniform-weight maps. Center positions (J2000) of the two nuclei are :16h52m58889, :+02.34 for N1, and :16h52m58929, :+02.79 for N2.
| Epoch | Telescope | Velocity Range | Maser Velocities | References |
|---|---|---|---|---|
| (yyyy.mm) | (km s, LSR) | (km s-1, LSR) | ||
| 2000.03 | Greenbank | 74007700 | 7565.00.8 | 1 |
| 2001.01 | Greenbank | 65008100 | 7565.60.5 | 1 |
| 2001.05 | Effelsberg | 68507870 | 7565.01.1, 7609.01.1† | 2 |
| 2001.06‡ | Nobeyama | 67048858 | 7566.40.5 | 3 |
| 2001.12 | Greenbank | 65008100 | 7568.60.7 | 1 |
| 2002.04 | Greenbank | 65008100 | 7567.6, 7612.10.1 | 1 |
| 2002.06 | VLA | 75257665 | 7611.02.6† | 4 |
| 2005.01 | Nobeyama | 64908610 | 7564.40.8 | 5,6∗ |
| 2007.01 | Nobeyama | 64908610 | 7561.50.8 | 6 |
| 2009.01 | VLA | 73707660 | 7491.10.2 | This paper |
References. — (1)Braatz et al. 2003; (2)Hagiwara et al. 2002; (3)Nakai et al. 2002; (4)Hagiwara et al. 2003; (5)Nakanishi et al. 2008; (6)Nakanishi et al., in preparation
References
- Armus et al. (2006) Armus, L., et al., 2006, ApJ, 640, 204
- Baan et al. (1985) Baan, W. A., Haschick, A. D., Buckley, D., & Schmelz, J. T. 1985, ApJ, 293, 394
- Baan, Hagiwara & Hofner (2007) Baan, W. A., Hagiwara, Y., & Hofner, P. 2007, ApJ, 661, 173
- Ballo et al. (2004) Ballo, L., et al., 2004, ApJ, 600, 634
- Beswick et al. (2001) Beswick, R. J., Pedlar, A., Mundell, C. G. & Gallimore, J. F. 2001, MNRAS, 325, 151
- Boller et al. (2003) Boller, Th., Keil, R., Hasinger, G., Costantini, E., Fujimoto, R., Anabuki, N., Lehmann, I., & Gallo, L. 2003, A&A, 411, 63
- Braatz et al. (2003) Braatz, J. A., Wilson, A. S., Henkel, C., Gough, R., & Sinclair, M. 2003, ApJS, 146, 249
- Bryant & Scoville (1999) Bryant, P. M., & Scoville. N. Z. 1999, AJ, 117, 2632
- Carral et al. (1990) Carral, P., Turner, J. L., & Ho, P. T. P., 1990, ApJ, 362, 434
- Claussen et al. (1998) Claussen, M. J., et al., 1998, ApJ, 500, 129
- Colbert et al. (1994) Colbert, J. M. E., Wilson, A. S. & Bland-Hawthorn, J. 1994, ApJ, 436, 89
- Depoy, Becklin, & Wynn-Williams (1986) Depoy, D. L., Becklin, E. E., & Wynn-Williams, C. G. 1986, ApJ, 307, 116
- Elitzur, Hollenbach, & McKee (1989) Elitzur, M., Hollenbach, D. J., & McKee, C. F. 1989, ApJ, 346, 983
- Falcke et al. (2000) Falcke, H., Henkel, Chr., Peck, A. B., Hagiwara, Y., Prieto, M. A., & Gallimore, J. F. 2000, A&A, 358, L17
- Fried & Schulz (1983) Fried, J. W. & Schulz, H. 1983, A&A, 118, 166
- Gallimore & Beswick (2004) Gallimore, J. F. & Beswick, R. J. 2004, AJ, 127, 239
- Genzel et al. (1998) Genzel, R., et al. 1998, ApJ, 498, 579
- Gerssen et al. (2004) Gerssen, J., et al., 2004, AJ, 127,75
- Greenhill et al. (1995) Greenhill, L. J., et al., 1995, A&A, 304, 21
- Greenhill et al. (2003) Greenhill, L. J., et al. 2003, ApJ, 590, 162
- Greenhill et al. (2009) Greenhill, L. J., et al., 2009, ApJ, 707, 787
- Hagiwara et al. (2001) Hagiwara, Y., Diamond, P. J., Nakai, N., & Kawabe, R. 2001, ApJ, 560, 119
- Hagiwara et al. (2002) Hagiwara, Y., Diamond, P. J., & Miyoshi, M. 2002, A&A, 383, 65
- Hagiwara et al. (2003) Hagiwara, Y., Diamond, P. J., & Miyoshi, M. 2003, A&A, 400, 457
- Hagiwara (2007) Hagiwara, Y. 2007, AJ, 133, 1176
- Hagiwara, Baan, & Hofner (2007) Hagiwara, Y., Baan, W. A., & Hofner, P. 2007, New Astron. Rev., 51, 58
- Heckman et al. (1990) Heckman, T., et al., 1990, ApJS, 74, 833
- Henkel et al. (1984) Henkel, C., et al., 1984, A&A, 141, L1
- Henkel et al. (2005) Henkel, C., et al., 2005, A&A, 436, 75
- Ho et al. (1987) Ho, P. T. P., et al., 1987, ApJ, 320, 663
- Ho et al. (1997) Ho, L. C., et al., 1997, ApJS, 112, 391
- Iono et al. (2007) Iono, D., et al., 2007, ApJ, 659, 283
- Kameno et al. (2005) Kameno, S., Nakai, N., Sawada-Satoh, S., Sato, N., & Haba, A. 2005, ApJ, 620, 145
- Komossa et al. (2003) Komossa, S., Burwitz, V., Hasinger, G., Predehl, P., Kaastra, J.S. & Ikebe, Y. 2003, ApJ, 582, L15
- Matt et al. (2000) Matt, G., et al., 2000, MNRAS, 318, 173
- Max et al. (2005) Max, C. E., Canalizo, G., Macintosh, B. A., Raschke, L., Whysong, D., Antonucci, R. & Schneider, G. 2005, ApJ, 621, 738
- Miller & Goodrich (1990) Miller, J. S. & Goodrich, R. W. 1990, ApJ, 355, 456
- Miyoshi et al. (1995) Miyoshi, M. Moran, J., Herrnstein, J., Greenhill, L., Nakai, N., Diamond, P., Inoue, M. 1995, Nature, 373, 127
- Moran et al. (1999) Moran, J. M., Greenhill, L. J., & Herrnstein, J. R. 1999, Journal of Astrophysics and Astronomy, 20, 165
- Nakai et al. (2002) Nakai, N., Sato, N., & Yamauchi, A. 2002, PASJ, 54, L27
- Nakanishi et al. (2005) Nakanishi, K., Okumura, S. K., Kohno, K., Kawabe, R. & Nakagawa, T. 2005, PASJ, 57, 575
- Nakanishi et al. (2008) Nakanishi, K., et al., 2008, in Astrophys. Space Sci. Proc., Mapping the Galaxy and Nearby Galaxies, ed. K.Wada & F.Combes (New York: Springer), 364
- Neff et al. (2004) Neff, S. G., Ulvestad, J. S., & Teng, S. H. 2004, ApJ, 611, 186
- Ohyama et al. (2000) Ohyama, Y., et al., 2000, PASJ, 52, 563
- Peck et al. (2003) Peck, A., et al., 2003, ApJ, 590, 149
- Pérez-Torres et al. (2010) Pérez-Torres, M. A., et al., 2010, A&A, 519, L5
- Sanders et al. (1988) Sanders, D. B., Soifer, B. T., Elias, J. T., Madore, B. F., Mathews, K., Neugebauer, G. & Scoville, N. Z. 1988, ApJ, 470, 222
- Skinner et al. (1997) Skinner, C. J., et al., 1997, Nature, 386, 472
- Tacconi et al. (1999) Tacconi, L. J., Genzel, R., Tecza, M., Gallimore, J. F., Downes, D. & Scoville, N. Z. 1999, ApJ, 524, 732
- Tarchi et al. (2010) Tarchi, A., Castangia, P., Henkel, C., Surcis, G., & Menten, K. M. 2010, arXiv:1008.4253v1
- Tecza et al. (2000) Tecza, M., Genzel, R., Tacconi, L. J., Anders, S., Tacconi-Garman, L. E. & Thatte, N. 2000, ApJ, 537, 690
- Thompson et al. (1986) Thompson, A. R., Moran, J. M., & Swenson, G. W. 1986, Interferometry and Synthesis in Radio Astronomy (New York: Wiley Interscience)
- Ulvestad et al. (2009) Ulvestad, J. S., Perley, R. A, & Chandler, C. J. 2009, The Very Large Array Observational Status Summary (NRAO), http://www.vla.nrao.edu/astro
- Ulvestad (2009) Ulvestad, J. S. 2009, AJ, 138, 1529
- Walker, Matsakis, & Garcia-Barreto (1982) Walker, R. C., Matsakis, D. N., & Garcia-Barreto, J. A. 1982, ApJ, 255, 128
- Yun & Carilli (2002) Yun, M. S., & Carilli, C. L. 2002, ApJ, 568, 88