Spatially Resolved Star Formation History Along the Disk of
M82 Using Multi-Band Photometric Data
Abstract
We present the results on the star formation history and extinction in the disk of M82 over spatial scales of 10′′ (180 pc). Multi-band photometric data covering from the far ultraviolet to the near infrared bands were fitted to a grid of synthetic spectral energy distributions. We obtained distribution functions of age and extinction for each of the 117 apertures analyzed, taking into account observational errors through Monte-Carlo simulations. These distribution functions were fitted with gaussian functions to obtain the mean ages and extinctions along with errors on them. The analyzed zones include the high surface brightness complexes defined by O’Connell & Mangano (1978). We found that these complexes share the same star formation history and extinction as the field stellar populations in the disk. There is an indication that the stellar populations are marginally older at the outer disk (450 Myr at 3 kpc) as compared to the inner disk (100 Myr at 0.5 kpc). For the nuclear regions (radius less than 500 pc), we obtained an age of less than 10 Myr. The results obtained in this work are consistent with the idea that the 0.5-3 kpc part of the disk of M82 formed around 90% of the stellar mass in a star-forming episode that started around 450 Myr ago lasting for about 350 Myr. We found that field stars are the major contributors to the flux over the spatial scales analyzed in this study, with stellar cluster contribution being 7% in the nucleus and 0.7% in the disk.
1 Introduction
The M82 galaxy (NGC 3034) is one of the most studied extra-galactic objects in the local universe. It is an edge-on spiral galaxy classified recently with a morphological type SBc (Mayya et al., 2005). The small distance from the Milky Way to M82, 3.63 Mpc (Freedman et al., 1994), has allowed to obtain images with high spatial resolution, which were employed to study its strong star-forming activity (Solinger et al., 1977; Telesco et al., 1991; Förster Schreiber et al., 2001), its compact star clusters (CSCs) distributed along the disk of the galaxy (O’Connell & Mangano, 1978; O’Connell et al., 1995; de Grijs et al., 2001; Melo et al., 2005; Smith et al., 2006, 2007; Mayya et al., 2008; Konstantopoulos et al., 2009), its biconical outflow which produces a filamentary structure of several kiloparsec-long (Lynds & Sandage, 1963; Cappi et al., 1999; Hoopes et al., 2005), and the properties of the neutral and molecular gas (Shen & Lo, 1995; Neininger et al., 1998; Matsushita et al., 2005). Particularly, the observed bridge of neutral hydrogen, which is connecting M82 with M81, has been used as a test of the interaction between these objects (Cottrell, 1977; Yun et al., 1993; Sofue, 1998; Chynoweth et al., 2008). There were attempts to determine the exact epoch of interaction, with the estimated epoch depending highly on the assumptions in the simulations. Yun et al. (1993) reproduced the observed HI plumes around M82 by a model where the last passage of the companion occurred around 300 Myr ago. Sofue (1998) estimated the epoch of interaction as around 1 Gyr ago. This was obtained assuming that the fundamental stellar disk of M82 was blown away during the interaction, and that is the reason for the observed nearly Keplerian rotation curve. Given that the disk is rich of a population of AGB stars (Davidge, 2008) — the products of post-interaction star-formation episode — the timescale seems to be longer than the 300 Myr estimated by Yun et al. (1993). We hence use an intermediate age of 500 Myr as the epoch of interaction, for the sake of discussion in this work.
O’Connell & Mangano (1978) using the best available photographic images of M82 at that time analyzed the brightest areas of M82. They identified 8 complexes, which they denoted by the letters A to H, and pointed out that most of these complexes contain knotty structures. They found that along the disk (r 1 kpc) there is no trace of complexes with on-going star formation. They also noted that the nuclear part of the galaxy (radius less than 500 pc) presents a strong, recent star formation activity, with the complex A being the most intense. Rieke et al. (1980, 1993) analyzed the multi-band properties of this zone, and determined an age of less than 30 Myr for the nuclear region. Förster Schreiber et al. (2001) carried out a spatially resolved study of stellar ages in this region, concluding that the nuclear zone had more than one burst of star formation in the last 10 Myr. These authors have noted that the patchy appearance of the nuclear zone is due to dust obscuration with more than 4 mag of visual extinction if the majority of the obscuring dust resides in a foreground screen and 43–52 mag if dust is mixed with the stars. Sub-arcsec spatial resolution images offered by the Hubble Space Telescope (HST) allowed O’Connell et al. (1995) to discover more than a hundred compact stellar clusters in the nuclear zone. Smith et al. (2006), using HST/STIS spectroscopy, found that these clusters are young and are formed as part of the nuclear starburst that have been taking place over the last 10 Myr.
The complexes outside the nuclear zone are not as extensively studied as those in the starburst zone. de Grijs et al. (2001), using the HST/WFPC2 images, found plenty of compact stellar clusters in the complex B, all older than those in the nuclear region, but younger than around 500 Myr. They found that the star formation rate in complex B was as high as the nuclear complex at the present day, thus giving it the name of fossil starburst. More recently, Smith et al. (2007) has derived a mean age of around 150 Myr for 35 clusters in the complex B. Complex F is the only other zone where studies in some detail have been carried out (Smith & Gallagher, 2001; Bastian et al., 2007). These studies gave an age of less than 100 Myr for this complex, with no evidence for recent star formation. More recently, Konstantopoulos et al. (2009) have derived spectroscopic ages of around 50 compact star clusters distributed over the disk, with the median age of the clusters being 150 Myr.
In order to explain the presence of patchy bright complexes in the nucleus and the disk, O’Connell & Mangano (1978) invoked a model where the star formation was restricted to only the bright complexes. They suggested that after the tidal encounter of M82 with the galaxy M81, some interstellar material was stripped from M82. When this material fell back into the galaxy, it produced the classical bright complexes with enhanced episodes of star formation. If this model is correct then the main population of stars in the disk surrounding the bright zones should be older than the bright zones themselves.
On the other hand, Mayya et al. (2006) using photometric, dynamical and chemical properties of the disk between 1 and 2.7 kpc radius proposed a violent star-formation episode throughout the disk of M82 that started around 0.8 Gyr ago,and lasted for a few hundred million years. This model of star formation reproduces well the relative strengths of age-sensitive spectroscopic features in the blue part of long-slit spectra along the major axis, as well as the observed value of M/, metallicity and enrichment of -elements. They also noted that the galaxy does not possess a massive old underlying stellar disk, characteristic of disk galaxies. More than 90% of the stellar mass in the disk was formed in this episode, implying that the star-formation episode is not just restricted to a few patches as was suggested by O’Connell & Mangano (1978), instead it was disk-wide. The basic tenets of this scenario were recently tested by Davidge (2008) using near infrared color-magnitude diagrams (CMDs) of the resolved populations in the disk. He detected asymptotic giant branch stars (AGBs) of age of a few hundred million years which are distributed uniformly in the disk, up to a radial distance as large as 12 kpc, suggesting that the star formation episode pervaded the entire disk. More importantly, red super giants (RSGs) were absent in the disk outside a radius of 0.5 kpc, confirming the cessation of star-formation episode Myr ago.
While the bursty nature of star-formation history in the disk of M82 is by now well established, there is still room for improvement in the timing of the commencement of the disk-wide star-formation. In the study of Mayya et al. (2006), the uncertainty in age estimation comes from the errors involved in determining the stellar mass of the disk (to calculate the quantity M/), which was obtained using a dynamical model to fit the observed rotation curve of the disk. Given that M82 has suffered a major change dynamically as a result of its interaction with the members of M81 group, and the evidence for the existence of gas above the plane, some of the intrinsic assumptions made to determine the mass, such as planar circular motions, may not be completely valid. An underestimation of the mass would push the commencement age to be as old as 1 Gyr, whereas if the dynamical masses were over-estimated, the mean ages could be younger than 0.5 Gyr. On the one hand, the analysis of the AGB stars carried out by Davidge (2008) promises to provide an accurate clock for age dating. However at present its utility is limited because of the poor knowledge of this evolutionary phase. Most recent models of Marigo et al. (2008) indicate age 200-300 Myr, with peak of the AGB population occurring at age 500 Myr. Hence alternative techniques are necessary to determine the age of the stellar disk in M82.
In recent years, the SEDs formed from photometric data covering a wide wavelength interval are increasingly used in determining the age, extinction and metallicity of stellar systems. Bianchi et al. (2005) using ultraviolet (UV) images from Galaxy Evolution Explorer (GALEX) and optical images from the Sloan Digital Sky Survey (SDSS), derived ages and reddening (among other parameters) of 160 pc scale stellar complexes in M101 and M51. Kaviraj et al. (2007) estimated age and metallicity of 42 low-reddening globular clusters in M31 using the photometry in the FUV, NUV, U, B, V, R, I bands. Bridžius et al. (2008) explored the capability of the UBVRIJHK photometric system to estimate the age, metallicity and color excess of star clusters. These studies have illustrated that the long base line in wavelength helps to disentangle the effects of reddening from the evolution. SEDs can also be used to get a measure of the metallicities in old, low-reddening systems such as globular clusters. However, the photometrically-derived metallicities do not reach the accuracies that are achievable using spectroscopic data.
In the present study, we exploit the potential of present-day SED-fitting techniques to determine the ages of the dominant stellar populations in the disk of M82, and in the process spatially map the star formation history. The available photometric data allow us to analyze the star formation history over spatial scales of pc, the size limitation basically coming from the 5′′ beam of the GALEX images and the requirement that measured fluxes in each aperture have the enough signal to noise (S/N) ratio. In earlier studies (Mayya et al., 2006; Davidge, 2008), star formation history was inferred by analyzing data over spatial scales of 1–2 kpc, so the present study represents an improvement by a factor of around 10 in spatial resolution. Typically, the complexes defined by O’Connell & Mangano (1978) have spatial extensions comparable to our resolution element, with the exception of complex B, which is several times larger than our aperture. The use of imaging data to determine ages also allows a comparison of star formation history of the bright complexes with those of the surrounding disk.
In §2, we describe the observational data used in this work. In §3, we describe the method used to infer the age of the stellar population and extinction. In §4, we describe the results obtained for the named complexes. In §5, we analyze the spatial distribution of the stellar population age to infer the star formation history in the disk and nucleus of M82. In §6, we determine the cluster formation efficiency and in §7, we discuss our results. Concluding remarks are given in §8.
2 Observed Spectral Energy Distributions
The most important part for deriving the spatially resolved star formation history from photometric data is the availability of high S/N ratio images covering the wavelength interval from the far ultraviolet (FUV) to the near infrared (NIR). The S/N ratio in the analyzed zone should be better than 20 in order to obtain reliable ages.
The UV part of the SEDs is based on the GALEX far-UV (FUV) and near-UV (NUV) images (Morrissey et al., 2007). The optical images in the u, g, r, i and z bands were retrieved from the SDSS database (Abazajian et al., 2003). For the near infrared data, we used the J, H and K images obtained with the Cananea Near-Infrared Camera (CANICA) attached to the 2.1 m telescope at Observatorio Astronómico Guillermo Haro (OAGH, Mayya et al., 2005).
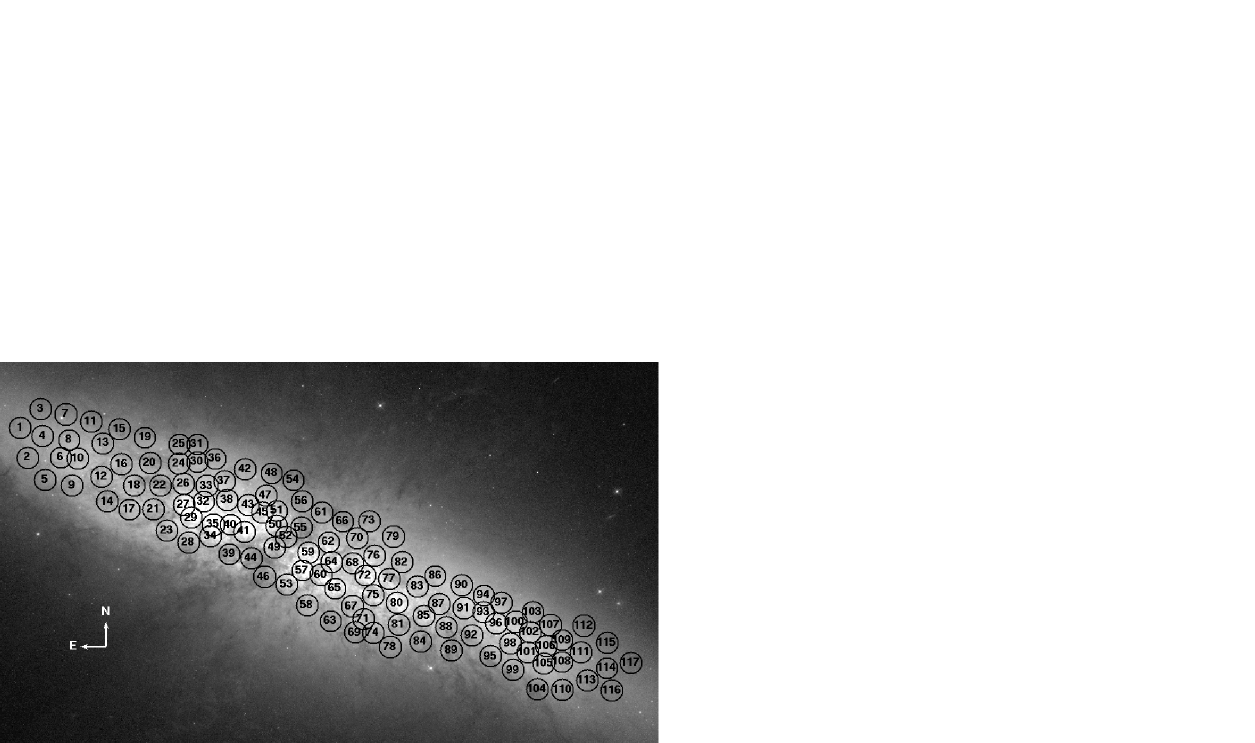
Among all these dataset, the GALEX images have the poorest spatial resolution with a point spread function of full width half maximum of 5′′. These images set the minimum spatial scale of our analysis, which corresponds to 100 pc in M82. We carried out photometry in fixed apertures of 5′′ radius. The apertures were placed so as to sample the bright complexes defined by O’Connell & Mangano (1978), as well as the diffuse part of the disk. Figure 1 displays the F555W image of M82 from HST, showing the positions of the 117 selected apertures. In Table 4.3, we show the association of our aperture numbers and O’Connell & Mangano (1978) complexes. Aperture numbers increase from east to west along the major axis of the galaxy. Apertures 50 to 80 (see Figure 1) lie within the 500 pc of the center of the M82 and belong to the nuclear starburst.

We aimed that the ages inferred from the SED-fitting technique are good to 15%. We found that the photometric accuracy of each band used for the construction of the SED should be better than 5% in order to achieve this. This corresponds to limiting surface brightnesses (for a S/N ratio of 20), averaged over an aperture of 5′′ radius, of: FUV=28.01, NUV=26.85, u=19.34, g=19.97, r=18.66, i= 18.23, z= 16.69 (all in units of AB mag arcsec-2), J=23.16 (Vega), H=19.89 (Vega) and K=19.23 (Vega). M82 is brighter than these limits up to a galactocentric radius of 3 kpc in all bands, except for 8 apertures located in dusty features, whose and magnitudes were fainter than the limiting magnitudes. We eliminated these apertures from rest of the analysis. Once the apertures were defined, photometry is carried out by summing all the sky-subtracted flux inside the apertures. The sky value for an image is obtained as the mean value of several selected areas outside the main disk of M82. Obvious sources, such as stars and background objects were avoided in the definition of sky zones. Note that we subtract sky, not the background, thus ensuring that our photometry measures the flux emitted by all the stars in the disk.
The error () in the flux () within the aperture was calculated by using,
| (1) |
where, Npix is the number of pixels inside the aperture, counts and sky are the total number of counts in selected areas in the disk, and in areas free of sources, respectively. The in the equation is the RMS error per pixel, which was estimated using the sky regions in each image, and gain is the number of electrons per data counts which is provided by the GALEX and CANICA web pages, and in the case of SDSS, it is found in the related fpAtlas file. The instrumental errors in the estimated aperture fluxes calculated using the above formula is less than 1% in all bands except in the bluest bands (, and ). In the -band the errors for majority of the apertures lie between 5–10%,while errors lie between 1–5% for majority of the apertures in the and bands. On the other hand, external errors, which are mainly determined by the errors in flux calibration between the three datasets, could be as large as 5%. Both errors were added in quadrature to estimate the total error on each datapoint.
In each image, we obtained the sky-subtracted fluxes in the selected apertures to construct 117 spectral energy distributions (SEDs). Figure 2 shows the mean of nuclear SEDs (solid line), north-east SEDs (dashed line), and south-west SEDs (dot-dashed line). The SEDs were normalized to the K-band flux, to facilitate the comparison. The dispersion of individual SEDs from the mean is shown by the vertical bars at each filter band. It can be seen that the SEDs of north-east and south-west follow a similar trend with the latter being marginally bluer. The behavior of the mean SED of the central apertures is different. It is redder and peaks at longer wavelengths as compared to the apertures in the disk. Understanding these differences in terms of different star forming history and extinctions, is one of the topics of discussion in the current paper.

3 The SED Fitting Method
The method we followed to determine the age and extinction of the stellar population has six steps:
-
1.
Construction of synthetic SEDs:
The first step in obtaining the age and extinction of the stellar population is the construction of synthetic SEDs, suitable for comparison with the observed SEDs. We used a set of 99 simple stellar population (SSP) models computed by the Padova Group (Bressan et al., 1993) 111most recently updated models kindly provided by A. Bressan.. The set of models cover evenly – in logarithmic scale – an age range from 1 Myr to 10 Gyr. These models use Salpeter’s IMF and have solar metallicity. McLeod et al. (1993) using nebular lines found that the metallicities of the nuclear regions of M82 are close to solar. There are no metallicity measurements in the disk regions due to the lack of emission lines there. Following the observed trend of metallicities staying constant or decreasing with galactocentric distance in late-type galaxies, we expect solar or sub-solar metallicities in the disk. However, we used solar metallicity models for all the regions.In order to compare synthetic SSP spectra with the observed SEDs, we construct a grid of synthetic colors by integrating each synthetic spectrum over the response curve of the filters used in the observations described in the previous section.
-
2.
Reddening the synthetic SEDs:
The synthetic SEDs were reddened using the Calzetti et al. (1994) extinction law. We also explored the results obtained if we make use of the Cardelli law (Cardelli et al., 1989). Once the relative reddening is fixed by assuming an extinction curve, the total extinction is computed by varying the color excess, E(B–V), from 0.0 to 2.0 mag, in steps of 0.1 mag. The number of synthetic reddened SEDs is around 2000. -
3.
Definition of the merit functions:
The best fits between observed and reddened synthetic SEDs in each aperture were found by using two merit functions. The first merit function compares the observed colors with the reddened SSP colors, and was defined as,(2) where the index runs for 9 different colors, using as a reference the band (FUV-r, NUV-r, u-r, g-r, r-i, r-z, r-J, r-H and r-K). The variables and are the observed and synthetic colors respectively, and are the observational errors (instrumental and external errors), the weight of each individual color is given by . Some of the color indices are more sensitive to age and reddening than others, which could, in principle, be reflected by the corresponding weights. However, after several trials, we found that the best way to get a good fit (low-) is to give the same weight for all the colors and introduce a separate merit function to break the age-reddening degeneracy.
The u-g color is chosen as a second merit function, given that the Balmer jump is the best discriminator between populations of different ages, for ages less than around 500 Myr, and that it is least sensitive to extinction. It is defined as:
(3) -
4.
Selection of best-fit models:
Due to the age-extinction degeneracy, different combinations of age and color excess give us similar SEDs and therefore similar values of and . Instead of the common practice of retaining only the minimum model, we retained 50 SSPs (out of the 2000 reddened SSPs) with the lowest . Of these 50 SSPs, we then retained only those fits that are within 10% of the minimum value of . Thus, for every aperture, we have a minimum of 1 and a maximum of 50 best-fit solutions. -
5.
Monte-Carlo simulation of the observational errors:
The error in each photometric band of an observed SED allows a set of synthetic SEDs to reproduce the observed SED with similar value of . In order to select all the synthetic SEDs that can fit the observed SED of an aperture, we generated 5000 new SEDs, where the flux in each photometric band was re-calculated by adding an error to the observed flux, where the error is randomly chosen such that their distribution is gaussian with a sigma equal to for each band. We refer this set of new SEDs as Monte-Carlo SEDs or for brevity MC-SEDs. We repeat steps 3 and 4 with each of the 5000 MC-SEDs, and obtain the set of best-fit models (maximum of 50 models) for each one, resulting in a large set (several thousands) of best-fit combinations of ages and extinctions for each aperture. -
6.
Determination of age and extinction:
The age and extinction associated with each of the thousands of best-fit SSPs were analyzed statistically using a gaussian distribution function, to determine the most likely age and extinction of a region. Gaussian functions are fitted to the distributions of and , with the center of the gaussians giving the most likely value, and sigma, an estimation of the error on the determined value. In a few cases where the distribution has more than one peak, the gaussian function is fitted to the group having the maximum number of best-fits. The method is illustrated in Figure 3 for the brightest aperture in complex B.

We found that the width of the distribution of ages and extinctions for a given region (defined by the of the best-fit gaussian) is within 15% of the derived value. The uncertainties were 30% if the observational errors in any of the bands is greater than 10%. As mentioned before, we discarded eight apertures based on that restriction. All these discarded apertures have FUV magnitudes fainter than the limiting magnitude.
We adopted the Calzetti extinction curve in our analysis. However, we have investigated the effect of using the Cardelli et al. (1989) extinction curve instead. The values for the best-fit model for each aperture using the two different extinction curves are compared in Figure 4. Both extinction curves give similar values of for the disk apertures where the visual extinction is less than 2 mag. For the nuclear apertures Calzetti law gives systematically better fits. The ages derived for the disk apertures using the two curves do not differ much as can be seen in Figure 5. However we found that the ages derived using the Cardelli curve for majority of the nuclear regions are around years, which is clearly inconsistent with the estimation of ages using other methods (e.g. Förster Schreiber et al., 2003). Hence, we use the results obtained with the Calzetti curve throughout this paper.

4 Analysis of Derived Ages and Extinctions in Named Complexes
Table 4.3 lists the results obtained using the fitting method for apertures coincident with the high surface brightness complexes defined by O’Connell & Mangano (1978). This table also shows spectroscopic ages and extinctions of star clusters located inside the corresponding apertures. Except for the complex B, the rest of the bright complexes have spatial extensions similar to or smaller than the aperture size, and hence the derived ages from aperture fluxes are the mean age of the complexes. The complex B encloses 8 apertures, with the aperture 27 being the brightest. Each of the complexes contain several compact star clusters. We used the high-resolution HST images to estimate the contribution of the clusters to the aperture fluxes, and found that the clusters contribute less than 1% to the disk apertures, whereas their contribution is less than 10% for the nuclear apertures (see §6). Hence, ages derived from the aperture fluxes do not represent those of the clusters, instead they are representative of the field stellar populations of M82. The SEDs of the best-fit models for complexes A, B (aperture 27), C and D are shown in Figure 6, for selected apertures of complex B in Figure 7, and for complexes E, F, G and H in Figure 8.

4.1 Nuclear complexes: A, C, D and E
Complexes A, C, D, and E are located in the nuclear star-forming region. This part of the galaxy shows strong emission (Ohyama et al., 2002). The presence of ionized gas points to a population of stars of a few million years (Rieke et al., 1980; Satyapal et al., 1997; Förster Schreiber et al., 2003). More recently Konstantopoulos et al. (2009) found possible Wolf-Rayet features in the spectra of clusters located in these complexes, confirming that the clusters of the nuclear complexes are young.
Complex A is the core of the nuclear star-burst and is the brightest complex. This is the most studied complex of M82. Surrounding the complex A are complexes C, D and E. Each one of these complexes are resolved into several tens of CSCs in the HST images (O’Connell et al., 1995). Our aperture 57 encloses the bright core of the complex A, for which we obtained an age of Myr () and mag.
For complexes C and E, we derived ages of around 5 and 7 Myr ( and , respectively) with values of 5 mag. These derived parameters are consistent with the previous results (Förster Schreiber et al., 2003). For complex D, which is directly to the north of complex A, we derived an age of 95 Myr (). This age is clearly larger than the age of the nuclear starburst and probably this belongs to the disk and it is seen projected on top of the nucleus of the galaxy.

4.2 Complex B
Complex B is the most studied complex outside the nuclear zone. It lies around a kiloparsec to the north-east of the nucleus. In the blue band images this complex is even brighter than the nucleus. Complex B spans over a large area of the disk of M82, and is the largest of the named complexes. Sometimes, it is subdivided into two parts, the B1 containing the bright zones to the far east and B2 containing relatively fainter zones to the west (de Grijs et al., 2001). Using long-slit spectroscopy, Mayya et al. (2006) obtained an age of 500 Myr for this complex. There are CSCs in this complex (Mayya et al., 2008). Recent spectroscopic studies have obtained ages for some of these clusters. Smith et al. (2007) found that stellar clusters located in this area cover an age interval of 80–270 Myr, peaking at 150 Myr. Konstantopoulos et al. (2009) determined that star clusters located in this complex are 80–200 Myr old.
In our analysis, complex B is covered by 8 apertures. We have listed these apertures in Table 4.3 as function of the distance to the center of the galaxy. Figure 7 displays the best-fit SEDs for selected apertures located inside this complex. Apertures 27 and 29, which lie to the extreme east contain the brightest part of this complex, for which we derived ages of 400 Myr (, and , respectively). The age derived for the aperture 50 – which lies on the extreme west of this complex – is 180 Myr (). We note that the ages of the western apertures are systematically younger reaching values of around 200 Myr at the extreme west (see Table 4.3).
4.3 Complexes F, G and H

Complexes F and H lie in the transition zone between the nucleus and the disk. Each of these complexes is associated with a very luminous and massive stellar cluster. Complex F is located on the south-west of the nucleus (aperture 72), whereas complex H is at the north-east of the nucleus (aperture 52). Complex G (aperture 80) is located in the disk on the west side. This latter complex was not included in previous spectroscopic studies of M82 probably because it is very diffuse.
Smith & Gallagher (2001) performed a spectroscopic study of the stellar cluster of complex F. They found that this cluster is around 50 Myr old. Bastian et al. (2007) found substructures within the cluster, and in the surrounding region, which was interpreted as due to differential extinction across the face of this complex, with some regions having mag. They estimated an age of 60 Myr. Konstantopoulos et al. (2009) analyzed two clusters in this area (slits 43.2 and 51(F)). They concluded that the age of cluster F is 40–80 Myr (in accordance with result obtained by Smith & Gallagher (2001) and Bastian et al. (2007)), whereas cluster 43.2 is 100–320 Myr old.
Complex H is dominated by one of the most massive star cluster of M82 (, Mayya et al. (2008)) which is also known as cluster B2-1. Using HST images, Konstantopoulos et al. (2008) found a peculiar extinction pattern associated to this cluster, complicating its age determination. In a more recent analysis Konstantopoulos et al. (2009) determined that the cluster of complex H is 180–200 Myr old.
Figure 8 displays the best-fit models for these complexes. For complex F we found a stellar population of around 180 Myr (). For the population of complex G we determined an age of Myr. For the complex H, we obtained an age of Myr (), which is younger than the star cluster B2-1.
| Complex | Our Results (Field Stars & Clusters) | Konstantopoulos et al. 2009 (Clusters) | Other authors (Clusters) | ||||||
|---|---|---|---|---|---|---|---|---|---|
| Apertures | Age (Myr) | Av | Slit | Age (Myr) | Av | ||||
| A | 57 | 2 | 5.67 | 78.1,78.2 | 30,20 | 1.20,3.45 | 6.4 Myr and E(B-V)=1.35 1 | ||
| B | 27 | 403 | 1.80 | 131 | 80 | 1.08 | 80–270 Myr (peak at 150 Myr) 3 | ||
| 29 | 396 | 1.84 | 125,126,131 | 140,210,80 | 1.17,0.85,1.08 | ||||
| 32 | 366 | 1.82 | … | … | … | ||||
| 35 | 357 | 2.21 | 113 | 110 | 1.67 | ||||
| 40 | 316 | 2.43 | … | … | … | ||||
| 41 | 197 | 2.70 | … | … | … | ||||
| 45 | 263 | 2.16 | … | … | … | ||||
| 50 | 180 | 2.39 | 97,98 | 160,160 | 0.90,0.50 | ||||
| C | 65 | 5 | 4.86 | 58 | 30 | 1.12 | |||
| D | 59 | 95 | 3.92 | 67.4 | 7 | 2.12 | |||
| E | 64 | 7 | 4.90 | 67.1,67.2 | 7,7 | 2.47,2.17 | |||
| F | 72 | 180 | 3.37 | 43.2,51(F) | 130,70 | 1.02,2.42 | 60 – 80 Myr and Av2.5 mag 2 | ||
| 50 Myr 1 | |||||||||
| G | 80 | 356 | 2.62 | ||||||
| H | 52 | 75 | 3.53 | 91(H) | 200 | 2.40 | 346 Myr and E(B-V)= 0.97 1 | ||
References. — (1) Smith et al. 2006; (2) Bastian et al. 2007; (3) Smith et al 2007.
5 Spatially Resolved Star Formation History and Extinction
In this section, we use the age and extinction of all the apertures to infer the spatially resolved star formation history in the disk of M82 in scales of pc.

Figure 9 shows the distribution of age as a function of the distance to the center of the galaxy. We distinguish those apertures belonging to complexes A to H by denoting them with filled circles. Two distinct epochs of star formation can be easily inferred from this plot: one younger than 10 Myr, exclusively located in the central 0.5 kpc radius, and the other older than 100 Myr, distributed along the whole disk of the galaxy. In Figure 10, we display the age of the apertures as a function of the distance using linear scale. A trend can be seen in this plot in such a way that the ages decrease from around 450 Myr at 3 kpc to 300 Myr at 0.5 kpc on the eastern side (positive distances), and from 400 Myr at 3 kpc to 300 Myr at 0.5 kpc on the western side. In the transition zones between the disk and the nucleus, the ages decrease rapidly from Myr to Myr. The observed trend may correspond to a smooth age gradient in the disk. However, the uncertainties in the derived ages in this work, do not permit a clear answer on this.
Another important thing to note in Figure 10 is the similarity in ages of the high surface brightness named complexes and the surrounding disk. This indicates that the stellar populations in the field, as well as in the bright complexes, were formed in the same event. Implications of these results will be discussed in §7.

Konstantopoulos et al. (2009) used multi-object spectroscopy to obtain ages and extinctions for 49 relatively bright clusters, covering up to a radial distance of 3 kpc. Their ages are displayed in Figure 9 using filled triangles. They found a mean age of 150 Myr for disk clusters, with no noticeable age gradient. Hence, these clusters seem to be systematically younger than the field populations as traced by our apertures. This difference makes the clusters slightly bluer than the surrounding disk as was noted by Mayya et al. (2008). The implications of these differences are discussed in §7.

Several studies have found an extinction gradient in the central kiloparsec of M82 with the extinction increasing towards the nucleus (Waller et al., 1992). Most of these studies are based on nebular line ratios and hence sample only the central part of M82. Our method allows mapping of the extinction in the entire disk. In Figure 11, we show the radial distribution of extinction. A gradient of extinction can be seen in the disk on both sides of the nucleus, with the increasing smoothly from 1.5 mag at 3 kpc to 2.8 mag at 0.5 kpc. For the nuclear apertures, we found extinction ranging between 3–6 mag, which agrees well with the values obtained by Waller et al. (1992) using nebular lines. On the other hand, the star clusters studied by Konstantopoulos et al. (2009) present extinction values that are systematically mag lower than our values for selected apertures (see Table 4.3).
5.1 The underlying old disk
It is important to note that we could reproduce the SEDs of all the disk apertures using a single stellar population of age Myr, without the need to add an SSP of several gigayears of an underlying old disk. These results are consistent with the disk-wide star-formation episode proposed by Mayya et al. (2006), in which more than 90% of stellar mass in the disk was formed. The derived aperture ages are consistent also with that inferred by Davidge (2008), and are marginally younger than that proposed by Mayya et al. (2006).
In this section, we check whether our multi-band SEDs are consistent with less than 10% of mass in old underlying disk stars. In order to do this, we performed new fits between the observed SEDs and new models. The new models were calculated by adding an SSP of 4 Gyr old to the best-fit SSP discussed in previous sections. We assumed that the old component shares the same reddening as the best-fit SSP. We carried out two tests: one using solar metallicity for the old component and a second test using a metal poor model (Z= 0.008) for the old component. The mass of the old population (old-pop) model is varied from a minimum of 0% in mass of the best-fit SSP in steps of 1% until the flux of the new model exceeds the observed flux plus the estimated error in the K band. We have chosen the K-band, because the old population is expected to have a maximum contribution in this band. The analysis performed for an area of complex B (aperture 27) using solar metallicity is illustrated in Figure 12. The upper plot displays the observed SED (dots), the SED of the best-fit model (solid line fitting the dots) and the SED of the old population (solid line) when it has a 9% in mass of the best-fit model. The lower plot shows the comparison between the flux of the old-pop model (with different percentage of mass) and the flux of the best-fit model (). It can be inferred that the old population with solar metallicity at the most contains 9% of the stellar mass of the best-fit population inside aperture 27. In the case of a metal-poor model, the upper limit in mass is 11%. More massive old stellar population would have increased the K-band flux to values above that observed. The upper mass limit of the old population obtained for aperture 27 is typical for the rest of the disk apertures, as is illustrated in the histogram of Figure 13. The mean upper mass limit is 9% and 11% depending on whether the old population is assumed to have solar or sub-solar metallicity, respectively. Thus, the observed multi-band SEDs of individual apertures are consistent with the result obtained by Mayya et al. (2006) where the underlying old disk, if present, is very insignificant in M82.


6 Cluster Formation Efficiency
From the analysis of the previous sections, it is clear that the observed aperture fluxes of both the disk and nuclear regions of M82 are dominated by a single generation of stars modeled as a simple stellar population. M82 contains a rich population of CSCs, with each CSC containing a single generation of stars (Mayya et al., 2008). So, it is interesting to investigate whether the CSCs and the field stellar populations formed from the same episode.
In Figure 9, we have compared the ages derived using our aperture fluxes to the ages of stellar clusters located within the apertures. The disk clusters have a mean age of 150 Myr, whereas most of the field populations surrounding these clusters have ages between 300–400 Myr. Thus, clusters seem to be systematically younger than the surrounding field populations by around 200 Myr. In the disk-wide starburst model proposed by Mayya et al. (2006), the star formation episode in the disk lasted for around 300 Myr. Thus, in spite of the systematic differences in mean ages, it is still possible that both the clusters and the field stars formed from the same episode. On the other hand, in the nuclear region, both clusters and stars in their vicinity have similar ages, both populations being part of the on-going nuclear starburst.
Another question of interest is to find out whether clusters dominate the observed fluxes at spatial scales of 180 pc. In order to answer this question, we compared the total fluxes of all clusters located physically within an aperture of radius with the integrated fluxes within that aperture.

Typically, nuclear apertures contain more than 10 compact clusters with the aperture 57 (complex A) containing as much as 76, whereas disk apertures contain less than 10 clusters and several apertures do not have any catalogued cluster inside. We calculated the fluxes of the field population using the apertures defined in Figure 1 on the F555W image obtained from HST/ACS observations (Mutchler et al., 2007). The F555W band cluster fluxes were taken from Mayya et al. (2008).
Figure 14 displays in the upper plot the comparison between the observed flux and the fluxes emitted by stellar clusters in the selected apertures. The lower plot shows the number of star clusters inside each aperture. Clusters contribute clearly more to the aperture fluxes in the nucleus as compared to the disk, 7% vs. 0.7%. These results show that field stars, not the clusters, are emitting most of the observed flux at scales of around 180 pc, even in areas where there is strong star formation. Similar results are obtained with the F435W and F814W images from HST/ACS. There are apertures located inside the 500 pc radius with ratios below 2%. These apertures seem to belong to the disk far away from the center of the galaxy but due to the high inclination of the galaxy are seen projected on to the nuclear region. The derived ages and extinctions of these regions confirm that interpretation.
The flux fraction obtained above is directly related to the fraction of stellar mass in compact clusters as compared to the mass in all field stars, provided the clusters and field stars are of the same age. For the nuclear region this assumption holds, and hence on an average, 7% of the stars in the nuclear region of M82 form in clusters. As these nuclear populations are younger than 10 Myr, the observed fraction corresponds to the cluster formation efficiency. Curiously, this estimate compares very well with the cluster formation efficiency of determined by Bastian (2008) in star-forming galaxies.
On the other hand, the disk clusters are younger than the surrounding field stars. Given that the fluxes of stellar population decrease with time due to passive evolution, the observed flux fraction of 0.7% is an upper limit to the fraction of mass in cluster stars.
Meurer et al. (1995), working with the HST UV images of nine starburst galaxies with several bright star clusters, found that 20% of the total UV luminosity is emitted by the clusters. It is most likely that the typical age of star formation in his sample galaxies is only around 10 Myr. Our values for the nucleus of M82 reaches 20% in one case with the rest having values below those obtained by Meurer et al. (1995). So it seems that CSCs contribute to the flux in young star forming regions decreasing to less than one percent when they are several hundreds of million years old.
7 Discussion and Implications
We start our discussion addressing the nature of complex B, which has drawn a lot of attention in recent years (de Grijs et al., 2001; Smith et al., 2007; Konstantopoulos et al., 2009b). Often this complex is referred to as fossil starburst (de Grijs et al., 2001). There was also the suggestion that the brightness of this complex is due to windows in the dust distribution (Konstantopoulos et al., 2008). Results obtained with our fitting method show that ages and extinctions of the bright named complexes are similar to the surrounding relatively fainter areas (see Figures 9 and 11), suggesting that the high brightness of the named complexes is due to their higher star formation rate with respect to the surrounding disk, and not because of lower extinction or younger age. Particularly, apertures belonging to complex B do not show significant lower extinction as often claimed (Konstantopoulos et al., 2008).
Ages of CSCs obtained using spectroscopy by Konstantopoulos et al. (2009) are in the range of 100-300 Myr with the mean age of 150 Myr. Thus clusters seem to be systematically younger than the surrounding disk stars. However, it is important to point out that only around 50 of the 653 known clusters (Mayya et al., 2008) were selected for spectroscopic observations and hence the derived ages may not be representative of the entire cluster population. Given that the cluster luminosity decreases with age, the brightest clusters are expected to be the youngest. Hence it is not strange that the derived ages of the clusters are systematically younger. Complex H, which lies in the transition zone between the nucleus and disk, offers an interesting case, where the compact cluster is older than the field population surrounding it.
Mayya et al. (2006) found that the entire disk participated in a star-forming episode that started following the interaction with M81 around 500 Myr ago. Ages of the dominant population found in our study are consistent with that idea. However, we find in the disk of M82 a systematic trend for the external zones to be marginally older as compared to the inner zones. Considering that our ages are luminosity weighted, this trend suggests either that the star-forming episode was not simultaneous in the entire disk but it is systematically younger in the inner regions, or that the entire disk started forming stars at the same time, but the star-forming episode stopped systematically at earlier epochs in the outer regions. Study of resolved stellar populations by Davidge (2008) supports the latter idea over a much extended disk.
We commented that the mean SEDs of central, north-east and south-west parts of the disk display differences (see Fig. 2). The age and extinction distributions along the disk of the galaxy can explain these differences. The visual absorption found on each side of the galaxy is similar, the mean of the NE is 1.6 mag and the mean of the SW is 1.8 mag. However, the population in the south-west is slightly younger: the oldest population of the SW is around 400 Myr old whereas in the NE side the oldest population is 450 Myr old (see Figs. 10 and 11). This behavior explains the bluer appearance of mean SED of the south-west part. On the other hand, we have pointed out that the mean SED of the central part is redder than the mean SEDs of the NE and SW regions. In spite of the very young ages found in the central parts of the galaxy, the high optical extinction ( around 5 mag, see Fig. 11) found in this part produces a mean SED which looks very reddened.
There is very little evidence for the existence of stars formed previous to the known star-forming episode. In the star-formation model proposed to explain the properties of the disk, Mayya et al. (2006) found a maximum contribution of around 10% of the total mass in stars older than 1 Gyr. In our study, we have analyzed this fraction in every aperture. We found that old stars do not contribute more than 11% in majority of the disk apertures. Thus, we reiterate that the disk of M82 formed almost all of its stars after the interaction with M81.
Young compact clusters contribute 7% to the nuclear aperture fluxes, with the corresponding contribution being 0.7% for the relatively older disk apertures. Given that the clusters and the surrounding regions share similar age and extinction, the above fraction is an indication of the efficiency of cluster formation and its dissolution. Hence for young nuclear clusters, the efficiency on an average is around 7%. The observed relatively lower fractions for the disk regions may indicate that on the time scale of a few hundred million years many clusters are already dissolved.
8 Summary
In this work, we analyzed the star formation history of M82 over spatial scales of pc using the broad-band SEDs covering the FUV to NIR bands. We constructed 117 SEDs, where each point of the SED is obtained by carrying out photometry in apertures of 5′′ radius over the entire face of M82 within 3 kpc radius. These SEDs were fitted with synthetic SSPs in wide range of reddening and ages. With this technique, we confirmed the following two facts that were already known: (1) the stellar populations in the nuclear zone are less than 10 Myr old and are heavily reddened (2–6 mag), (2) the stellar populations in the disk have ages between 100–450 Myr.
The use of spatially resolved SEDs has allowed us to establish, for the first time, that the interaction-driven disk star formation was not restricted to a few bright zones, but occurred everywhere in the disk over spatial scales as small as 180 pc. Each of these SEDs is consistent with the idea that more than 90% of the stellar mass of the disk is formed as part of the disk-wide star formation episode, and containing only a small fraction of stars older than 1 Gyr.
We found that the bright named complexes have similar ages and reddening as that of the surrounding low-surface brightness parts of the galaxy: complexes within the starburst region (complexes A, C, E) have ages less than 10 Myr and the complex B in the disk has age 200–400 Myr, and the complexes in the intermediate zone (F and H) having ages between 50–200 Myr. This implies that the named complexes are brighter just because of higher amount of star formation, not because they are younger or have lesser reddening. Ages of compact stellar clusters in the disk derived using spectroscopy ( Myr) are systematically smaller than the mean age of the field stellar populations ( Myr). However, the difference in the age is of the same order as the duration of the disk-wide star formation episode, and hence both populations could belong to the same episode.
In the nuclear regions, around 7% of all the stellar mass resides in the cluster stars, whereas that fraction is less than 1% in the disk. Given that the disk populations are systematically older than the nuclear populations, the difference in the fractional mass in cluster stars may be due to disruption of clusters as they evolve.
The results obtained in this study are encouraging from the point of view of extending the technique adopted in this work to other nearby galaxies. Thus star formation history over a few hundreds of parsec scale can be derived by making use of the already available multi-band archival images such as GALEX, SDSS, and 2MASS.
The authors are pleased to thank R. Terlevich, E. Terlevich, A. Bressan, O. Vega, and A. Luna for fruitful discussions and helpful suggestions. We also thank the anonymous referee for many useful comments that have lead to an improvement of the original manuscript. This work is partly supported by CONACyT (Mexico) research grants 58956-F and 49942-F.
Some of the data presented in this paper were obtained from the Multimission Archive at the Space Telescope Science Institute (MAST). STScI is operated by the Association of Universities for Research in Astronomy, Inc., under NASA contract NAS5-26555. Support for MAST for non-HST data is provided by the NASA Office of Space Science via grant NNX09AF08G and by other grants and contracts.
References
- Abazajian et al. (2003) Abazajian, K., et al. 2003, AJ, 126, 2081
- Bastian (2008) Bastian, N. 2008, MNRAS, 390, 759
- Bastian et al. (2007) Bastian, N., Konstantopoulos, I., Smith, L. J., Trancho, G., Westmoquette, M. S., & Gallagher, J. S. 2007, MNRAS, 379, 1333
- Bianchi et al. (2005) Bianchi, L., et al. 2005, ApJ, 619, L71
- Bressan et al. (1993) Bressan, A., Fagotto, F., Bertelli, G., & Chiosi, C. 1993, A&AS, 100, 647
- Bridžius et al. (2008) Bridžius, A., Narbutis, D., Stonkutė, R., Deveikis, V., & Vansevičius, V. 2008, Baltic Astronomy, 17, 337
- Calzetti et al. (1994) Calzetti, D., Kinney, A. L., & Storchi-Bergmann, T. 1994, ApJ, 429, 582
- Cappi et al. (1999) Cappi, M., et al. 1999, A&A, 350, 777
- Cardelli et al. (1989) Cardelli, J. A., Clayton, G. C., & Mathis, J. S. 1989, ApJ, 345, 245
- Chynoweth et al. (2008) Chynoweth K. M., Langston G. I., Yun M. S., Lockman F. J., Rubin K. H. R., & Scoles S. A. 2008, AJ, 135, 1983
- Cottrell (1977) Cottrell, G. A. 1977, MNRAS, 178, 577
- Davidge (2008) Davidge, T. J. 2008, AJ, 136, 2502
- de Grijs et al. (2001) de Grijs, R., O’Connell, R. W., & Gallagher, J. S., III 2001, AJ, 121, 768
- Förster Schreiber et al. (2001) Förster Schreiber, N. M., Genzel, R., Lutz, D., Kunze, D., & Sternberg, A. 2001, ApJ, 552, 544
- Förster Schreiber et al. (2003) Förster Schreiber, N. M., Genzel, R., Lutz, D., & Sternberg, A. 2003, ApJ, 599, 193
- Freedman et al. (1994) Freedman, W. L., et al. 1994, ApJ, 427, 628
- Hoopes et al. (2005) Hoopes C. G., et al. 2005, ApJ, 619, 99
- Kaviraj et al. (2007) Kaviraj, S., Rey, S.-C., Rich, R. M., Yoon, S.-J., & Yi, S. K. 2007, MNRAS, 381, L74
- Konstantopoulos et al. (2009) Konstantopoulos, I. S., Bastian, N., Smith, L. J., Westmoquette, M. S., Trancho, G., & Gallagher, J. S. 2009, ApJ, 701, 1015
- Konstantopoulos et al. (2009b) Konstantopoulos, I. S., Bastian, N., Smith, L. J., Trancho, G., Westmoquette, M. S., & Gallagher, J. S. 2009b, Ap&SS, 324, 343
- Konstantopoulos et al. (2008) Konstantopoulos, I. S., Bastian, N., Smith, L. J., Trancho, G., Westmoquette, M. S., & Gallagher, J. S., III 2008, ApJ, 674, 846
- Lynds & Sandage (1963) Lynds, C. R., & Sandage, A. R. 1963, AJ, 68, 284
- Marcum & O’Connell (1996) Marcum, P. M., & O’Connell, R. W. 1996, in ASP Conf. Ser. 98, From Stars to Galaxies: the Impact of Stellar Physics on Galaxy Evolution, ed. C. Leitherer, U. Fritze-von-Alvensleben, and J. Huchra, 419
- Marigo et al. (2008) Marigo, P., Girardi, L., Bressan, A., Groenewegen, M. A. T., Silva, L., & Granato, G. L. 2008, A&A, 482, 883
- Martin et al. (2005) Martin, D. C., et al. 2005, ApJ, 619, L1
- Matsushita et al. (2005) Matsushita, S., Kawabe, R., Kohno, K., Matsumoto, H., Tsuru, T. G., & Vila-Vilaró, B. 2005, ApJ, 618, 712
- Mayya et al. (2005) Mayya Y. D., Carrasco L., & Luna A. 2005, ApJ, 628, L33
- Mayya et al. (2006) Mayya, Y. D., Bressan, A., Carrasco, L., & Hernandez-Martinez, L. 2006, ApJ, 649, 172
- Mayya et al. (2008) Mayya, Y. D., Romano R., Rodríguez-Merino L. H., Luna A., Carrasco L., & Rosa-González D. 2008, ApJ, 679, 404
- McLeod et al. (1993) McLeod, K. K., Rieke, G. H., Rieke, M. J., & Kelly, D. M. 1993, ApJ, 412, 111
- Melo et al. (2005) Melo, V. P., Muñoz-Tuñón, C., Maíz-Apellániz, J., & Tenorio-Tagle, G. 2005, ApJ, 619, 270
- Meurer et al. (1995) Meurer G. R., Heckman T. M., Leitherer, C., Kinney, A., Robert, C., & Garnett D. R. 1995, AJ, 110, 2665
- Morrissey et al. (2007) Morrissey, P., et al. 2007, ApJS, 173, 682
- Mutchler et al. (2007) Mutchler, M., et al. 2007, PASP, 119, 1
- Neininger et al. (1998) Neininger, N., Guelin, M., Klein, U., Garcia-Burillo, S., & Wielebinski, R. 1998, A&A, 339, 737
- O’Connell & Mangano (1978) O’Connell, R. W., & Mangano, J. J. 1978, ApJ, 221, 62
- O’Connell et al. (1995) O’Connell, R. W., Gallagher, J. S., III, Hunter, D. A., & Colley, W. N. 1995, ApJ, 446, L1
- Ohyama et al. (2002) Ohyama, Y. et al. 2002, PASJ, 54, 891
- Proctor & Sansom (2002) Proctor, R. N., & Sansom, A. E. 2002, MNRAS, 333, 517
- Rieke et al. (1980) Rieke, G. H., Lebofsky, M. J., Thompson, R. I., Low, F. J., & Tokunaga, A. T. 1980, ApJ, 238, 24
- Rieke et al. (1993) Rieke, G. H., Loken, K., Rieke, M. J., & Tamblyn, P. 1993, ApJ, 412, 99
- Satyapal et al. (1997) Satyapal, S., Watson, D. M., Pipher, J. L., Forrest, W. J., Greenhouse, M. A., Smith, H. A., Fischer, J., & Woodward, C. E. 1997, ApJ, 483, 148
- Shen & Lo (1995) Shen, J., & Lo, K. Y. 1995, ApJ, 445, L99
- Smith & Gallagher (2001) Smith, L. J., & Gallagher, J. S. 2001, MNRAS, 326, 1027
- Smith et al. (2006) Smith, L. J., Westmoquette, M. S., Gallagher, J. S., O’Connell, R. W., Rosario, D. J., & de Grijs, R. 2006, MNRAS, 370, 513
- Smith et al. (2007) Smith, L. J., et al. 2007, ApJ, 667, L145
- Sofue (1998) Sofue, Y. 1998, PASJ, 50, 227
- Solinger et al. (1977) Solinger, A., Morrison, P., & Markert, T. 1977, ApJ, 211, 707
- Telesco et al. (1991) Telesco, C. M., Joy, M., Dietz, K., Decher, R., & Campins, H. 1991, ApJ, 369, 135
- Trager et al. (2000) Trager, S. C., Faber, S. M., Worthey, G., & González, J. J. 2000, AJ, 119, 1645
- Waller et al. (1992) Waller, W. H., Gurwell, M., & Tamura, M. 1992, AJ, 104, 63
- Worthey (1994) Worthey, G. 1994, ApJS, 95, 107
- Yun et al. (1993) Yun, M. S., Ho, P. T. P., & Lo, K. Y. 1993, ApJ, 411, L17
- Yun et al. (1994) Yun, M. S., Ho, P. T. P., & Lo, K. Y. 1994, Nature, 372, 530