Dynamical versus Stellar Masses of Ultracompact Dwarf Galaxies in the Fornax Cluster††thanks: Based on the archival ESO VLT data (programme 078.B-0496) available through http://archive.eso.org/ and Hubble Space Telescope archival data (programmes 8090 and 10129) available through http://hla.stsci.edu/
Abstract
The origin of ultracompact dwarf (UCD) galaxies, compact extragalactic stellar systems, is still a puzzle for present galaxy formation models. We present the comprehensive analysis of high resolution multi-object spectroscopic data for a sample of 24 Fornax cluster UCDs obtained with VLT FLAMES. It comprises previously published data for 19 objects (Mieske et al., 2008) which we re-analysed, including 13 with available HST photometric data. Using Virtual Observatory technologies we found archival HST images for two more UCDs and then determined their structural properties. For all objects we derived internal velocity dispersions, stellar population parameters, and stellar mass-to-light ratios by fitting individual simple stellar population (SSP) synthetic spectra convolved with a Gaussian against the observed spectra using the NBursts full spectral fitting technique. For 14 objects we estimated dynamical masses suggesting no dark matter (DM) in 12 of them and no more than 40 per cent DM mass fraction in the remaining two, in contrast to findings for several UCDs in the Virgo cluster. Some Fornax UCDs even have too high values of estimated using the Kroupa stellar initial mass function (IMF) resulting in negative formally computed DM mass fractions. The objects with too high ratios compared to the dynamical ones have relatively short dynamical relaxation timescales, close to the Hubble time or below. We therefore suggest that their lower dynamical ratios are caused by low-mass star depletion due to dynamical evolution. Overall, the observed UCD characteristics suggest at least two formation channels: tidal threshing of nucleated dwarf galaxies for massive UCDs ( ), and a classical scenario of red globular cluster formation for lower-mass UCDs ( ).
keywords:
galaxies: dwarf – galaxies: elliptical and lenticular, cD – galaxies: evolution – galaxies: stellar content – galaxies: kinematics and dynamics1 Introduction
Ultra-compact dwarf galaxies (Hilker et al., 1999; Drinkwater et al., 2000; Phillipps et al., 2001) initially discovered as extragalactic sources unresolved from the ground-based observations, represent a new class of compact stellar systems (CSS) observed in the nearby Universe (Mieske et al., 2004; Haşegan et al., 2005; Jones et al., 2006; Mieske et al., 2007, 2008; Misgeld et al., 2008). At least an order of magnitude smaller ( pc) than M32-like compact elliptical (cE) galaxies, but still significantly larger than globular clusters (Drinkwater et al., 2003; Jordán et al., 2005), UCDs are best studied in the two nearby clusters of galaxies: Fornax and Virgo (Haşegan et al., 2005; Jones et al., 2006; Evstigneeva et al., 2007; Hilker et al., 2007; Mieske et al., 2008). Typically, UCDs have luminosities between mag and masses about (Mieske et al., 2008).
UCDs, initially defined on a morphological basis, may indeed represent a heterogeneous class of objects (Mieske et al., 2006) of different origins. The concepts of UCD formation include: (1) very massive globular clusters having the same origin as “normal” ones (Mieske et al., 2002), however brightest UCDs ( mag) are too bright and frequent to be statistically accounted for by the Gaussian representation of the globular cluster luminosity function; (2) stellar superclusters formed in gas-rich mergers of galaxies (Fellhauer & Kroupa, 2002, 2005); (3) end-products of small-scale primordial density fluctuations in dense environments (Phillipps et al., 2001); (4) tidally stripped nucleated dEs (dEN’s, Bekki et al., 2001; Goerdt et al., 2008) or simply dEN’s with very low surface brightness outer components (cf. Drinkwater et al., 2003). None of the concepts is completely ruled out or confirmed yet.
The dynamical M/L ratios of UCDs are on average about twice as large as those of Galactic globular clusters of comparable metallicity (e.g. Dabringhausen et al., 2008; Mieske et al., 2008; Forbes et al., 2008; Taylor et al., 2010), although environmental differences exist (see below). It has been shown that about 1/4 of the M/L offset with respect to globular clusters is probably due to dynamical evolution of the latter (Kruijssen & Mieske, 2009). The remaining offset in M/L indicates that UCDs may mark the on-set of dark matter domination in small stellar systems (Gilmore et al., 2007; Goerdt et al., 2008), or indeed probe a variation of the IMF (Dabringhausen et al., 2008; Mieske & Kroupa, 2008).
Mieske et al. (2008) state a need in observations aimed at the studies of UCDs stellar populations and age determination in particular, required to explain the low dynamical ratios in Fornax UCDs compared to those in the Virgo cluster. Here we re-analyse the same observational data applying a powerful full-spectral fitting technique allowing us to obtain simultaneously internal kinematics and stellar population properties in the largest UCD sample available until now. We also improve some data reduction steps, necessary because of the more stringent requirements for stellar population analysis regarding sky subtraction. Another motivation for re-analysing these data was to double-check the velocity dispersion measurements for certain UCDs. Mieske et al. (2008) used late-type giant stars from Cen having metallicities of around dex as stellar templates. While this is close to the average UCD metallicity, UCDs span a wider range of metallicities and for metal-rich objects the template mismatch due to the metallicity difference may affect velocity dispersion measurements as suggested in Chilingarian (2006).
The paper is organised as follows: in Section 2 we describe spectroscopic data reduction and analysis, as well as complementary archival HST data used to extend the sample of UCDs with known structural parameters; the results of the full spectral fitting are presented in Section 3; comparison of kinematical and stellar population properties of UCDs with early-type galaxies and a general discussion about the origin of UCDs is given in Section 4.
2 Data: Sources, Reduction, Analysis
2.1 Spectral data
We used the data obtained in the course of the study of CSSs in the Fornax cluster (program 078.B-0496, P.I.: L. Infante). The datasets are publicly available through the ESO Data Archive111http://archive.eso.org/. The observations were collected at the ESO Very Large Telescope with the FLAMES/Giraffe spectrograph (Pasquini et al., 2002) in the multi-object “MEDUSA” mode, using the HR9 setup giving a resolving power in the wavelength range 5120–5450 Å in the service mode in 14 observing blocks (OB) between June and December 2007 with the total integration time of 54 000 sec. All particular details about observations are given in Mieske et al. (2008). We use the distance modulus of the Fornax cluster mag (Freedman et al., 2001) corresponding to the distance 19 Mpc and the spatial scale 92 pc arcsec-1.
In order to perform the stellar population analysis we had to improve the data reduction and sky subtraction with respect to the requirements for the kinematical analysis presented in Mieske et al. (2008), therefore we had to introduce several additional steps before and after standard ESO FLAMES pipeline data reduction.
The first additional pre-processing step is to apply the Laplacian cosmic ray cleaning algorithm (van Dokkum, 2001) to the original science frames and mask all the regions affected by cosmic ray hits in every individual frame.
The second step, the diffuse light subtraction, is of a great importance for the success of our study. The simultaneous calibration (SimCal) Th-Ar lamp inside the spectrograph was switched on during the observations. The average flux level in the SimCal fibres exceeded those of scientific targets by at least two orders of magnitude. Therefore, the scattered light from bright arc lines at a level of 1–2 per cent severely contaminated the neighbouring fibres. There is also a smooth diffuse light component in the spectrograph, having however, only little effects on the flat-fielding.
To account for this contamination, we created a dedicated scattered light modelling algorithm. Since FLAMES fibres are sparsely placed on a CCD plane: the median inter-fibre distance is 14.3 pixels while the fibre is around 4 pixels, therefore it is possible to use inter-fibre gaps to estimate the scattered light contribution. We use fibre traces derived from a flat field to identify inter-fibre gaps which normally should not contain any signal. Then, we assume that all signal detected in the gaps represent a superposition of scattered light and global diffuse light. In the beginning we smooth this contribution along dispersion with a boxcar of 4 pix, then we fit it across dispersion at every position along fibre traces between each pair of SimCal fibres using the 3-rd order smoothing splines. We use the spline interpolation instead of smoothing splines in a small region of the frame containing a parasite signal generated by the CCD read-out amplifier.
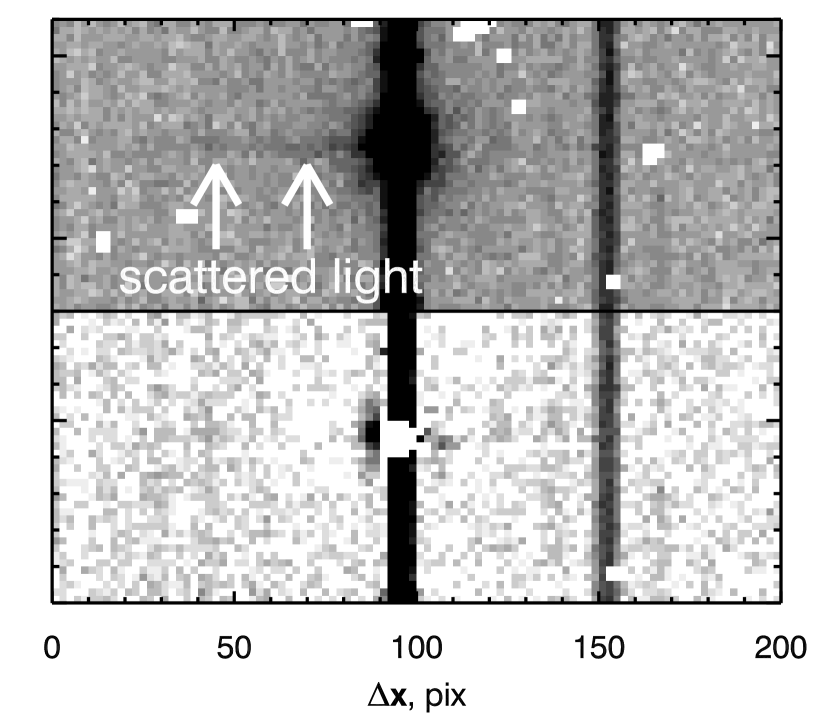
The two-dimensional scattered light model constructed in this fashion is created and subtracted from every spectral image. In Fig 1 we present a fragment of a spectral image before and after scattered light subtraction.
Then, the corrected files are used to feed the ESO FLAMES data reduction pipeline esorex to proceed through all steps up-to the linearisation of extracted spectra.
Then, we apply the third, post-processing step including the adjustment of the wavelength scale to account for heliocentric radial velocity corrections, sky subtraction, and combination of spectra for multiple exposures. All further data analysis is performed on individual one-dimensional extracted spectra of every object.
We fitted the high-resolution pegase.hr (Le Borgne et al., 2004) simple stellar population (SSP) models against the observational data using the modification of the NBursts full spectral fitting technique (Chilingarian et al., 2007b, a). The original version of NBursts cannot be used directly with our data as we did for FLAMES-LR04 observations (Chilingarian et al., 2008c, b), because the spectral resolution of FLAMES in the HR9 setup exceeds that of the pegase.hr stellar population models (). Therefore, we degraded the spectral resolution of the data in order to match that of pegase.hr and be able to provide unbiased estimates of stellar velocity dispersions.
We used the high signal-to-noise twilight spectra obtained in the HR9 setup of FLAMES available for download from the instrument web-pages. Then, we fitted the spectra in 5 segments along the wavelength range in every fibre against the Solar spectrum from the elodie.3.1 library (Prugniel et al., 2007) using the ppxf method by Cappellari & Emsellem (2004). The procedure was similar to the determination of the line-spread-function (LSF) variations described in Chilingarian et al. (2008c) used for low-resolution FLAMES spectra with the principal difference that now FLAMES-HR9 twilight spectra served as “templates” and elodie.3.1 spectrum as “data”. The derived differential spectral line spread is almost constant along the wavelength direction and does not exhibit any significant fibre-to-fibre variations. Its shape can be described as a Gauss-Hermite function with km s-1, km s-1, , . Then, the data convolved with this parametrization matched the resolution of pegase.hr models. This procedure is very similar to the degradation of the pegase.hr resolution we performed in all previous studies using the NBursts technique to take into account spectrograph’s LSF.
The contamination of UCD spectra by the light of NGC 1399 is an important source of biases for the stellar population parameter estimates. As it creates an additive background with very smooth spectral features due to the high intrinsic velocity dispersion of the galaxy ( km s-1), the metallicity measurements can become underestimated while velocity dispersion measurements become overestimated (see Appendix A3 in Chilingarian et al., 2007b, for details). These effects should become very important in the inner region of the cluster. The sky fibres were placed far away from the galaxy centre and were hardly a subject to any contamination by the NGC 1399 halo, therefore we do not expect any over-subtraction for UCDs located at large projected distances from NGC 1399.
To account for NGC 1399’s halo contamination, we used its spectrum at the position (). We adopted the NGC 1399 centre coordinates from HyperLeda222http://leda.univ-lyon1.fr/: ().
Then we used its parametrized -band light profile from Dirsch et al. (2003) and projected distances of all our UCDs to scale the NGC 1399 spectrum, which was then subtracted from UCD spectra. The NGC 1399 spectrum was smoothed using a -spline with equidistant nodes every 4 Å. This suppresses additional noise while subtracting it from UCD spectra and, on the other hand, keeps enough spectral resolution not to smear absorption lines in the galaxy spectrum. We estimate the contamination of UCD spectra by comparing the median fluxes in the scaled NGC 1399 spectrum and original UCD data. The results (estimated fractions in per cent from the total flux) are provided in Table 2. The strongest contaminated objects are -, -, and -.
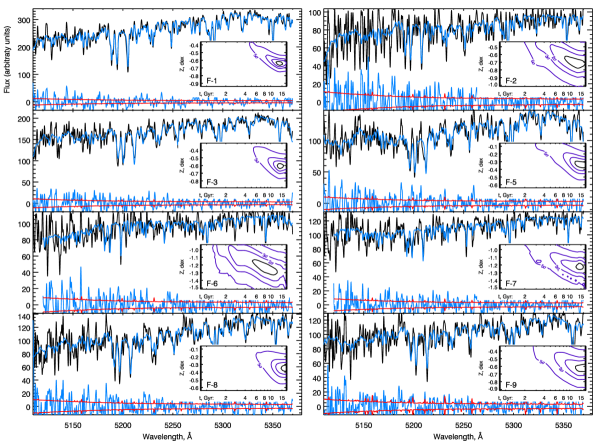
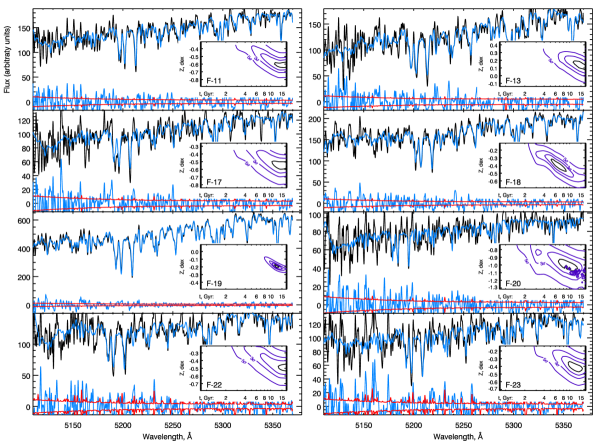
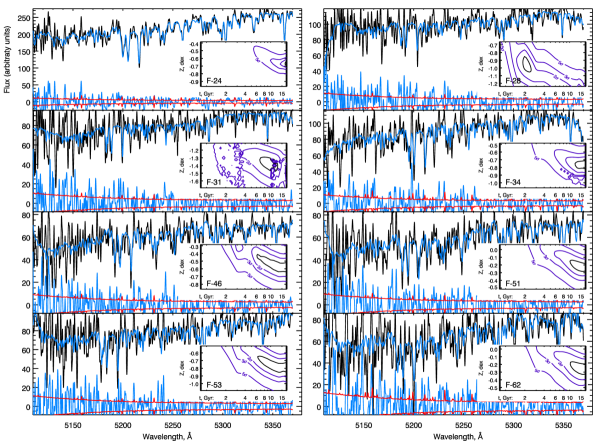
We deduced kinematical and stellar population parameters by fitting the combined FLAMES-HR9 spectra of UCDs corrected by the contamination of the NGC 1399 halo using the NBursts technique with a grid of simple stellar population (SSP) models computed using the Kroupa et al. (1993) stellar initial mass function (IMF). In addition to the best-fitting values of radial velocity, velocity dispersion, SSP-equivalent age and metallicity which are obtained in a single minimization loop, for every UCD we computed a confidence map in the age–metallicity space similar to those presented in (Chilingarian et al., 2008b). We notice, that when the NBursts technique is used in the -mapping mode, i.e. fitting a single SSP with fixed age and metallicity at every grid node, the algorithm “degenerates” into the form totally equivalent to the ppxf procedure by Cappellari & Emsellem (2004) with a single template spectrum. Then we interpret the obtained map in terms of stellar populations. In Appendix A we present the numerical experiment aimed at quantifying the spectral information contained in different absorption features present in the spectral range of our observations. We show that the full spectral fitting technique in our spectral range using high-resolution pegase.hr models successfully breaks the age–metallicity degeneracy and can be used to estimate stellar population parameters of old stellar populations from FLAMES/Giraffe HR09 data.
In principle, UCDs may contain a mix of different stellar populations so that their spectra will not be well represented by SSP models. The NBursts technique can be used to fit multi-component stellar population models, however, quite low signal-to-noise ratios of our spectra did not allow us to do it for every object. It was indeed possible for a few brightest ones, such as -19, were we attempted to fit two SSPs. In all cases, the light fractions of young (or intermediate) population were found to be zero, while old components were identical to the single SSP cases.
| id | id | R.A.() | Dec.() |
|---|---|---|---|
| - | 03:38:29.16 | -35:27:19.9 | |
| - | 03:38:56.21 | -35:24:48.9 | |
| - | FCOS 2-2106 | 03:38:25.05 | -35:29:25.2 |
| - | 03:38:19.78 | -35:23:39.5 | |
| - | FCOS 0-2032 | 03:38:30.22 | -35:21:31.3 |
| - | gc319.1 | 03:38:49.85 | -35:23:36.0 |
Our final sample includes 19 out of 23 UCDs presented in Mieske et al. (2008). Two of the four excluded objects, - and - had obvious artefacts in the sky subtraction due to their very close position to SimCal fibers, while - and - had too low signal-to-noise ratios in addition to difficulties with the sky subtraction. We are adding 6 objects to the sample of Mieske et al. (2008) for which the data were obtained, but they were dropped from the final selection, -, -, -, -, -, and -. Their coordinates are given in Table 1. Four of them, -, -, -, and -, have low metallicities (see next section). None of them but - has archived HST data available. For - it is impossible to perform surface photometry with reasonable precision, because it is located 0.3 arcmin in projection from the photometric centre of NGC 1399 and therefore it is projected on the bright part of its spheroid resulting in heavy light contamination.
The approach we use to correct UCD spectra for the NGC 1399 halo contamination may introduce biases in case of: (1) highly eccentric or distorted isophotes of NGC 1399; (2) strong metallicity and/or velocity dispersion gradients in the NGC 1399 halo. According to Dirsch et al. (2003), the structure of the NGC 1399 halo is very regular; the velocity dispersion profile of NGC 1399 flattens out at a level of about 230 km s-1 beyond 15 arcsec (Saglia et al., 2000) dropping down only beyond 500 arcsec (Schuberth et al., 2010) where its surface brightness is too low to cause any contamination to the CSS spectra. The optical colour profile is quite steep (Dirsch et al., 2003) which may be indicative of a metallicity gradient. However, the effects of age and dust may also play a role.
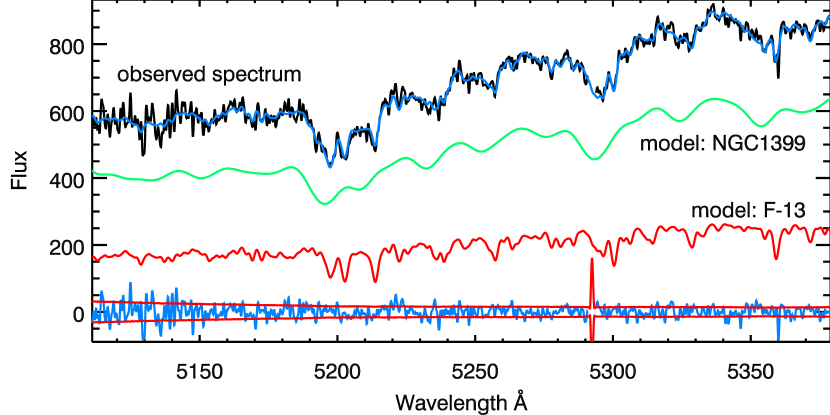
In order to test whether our halo correction results are strongly affected by radial gradients in NGC 1399, we fitted the uncorrected spectra of the three heavily contaminated UCDs mentioned above with the model including two SSPs with different line-of-sight velocity distribution corresponding to a UCD and the NGC 1399 halo. At first, we left free all kinematical and stellar population parameters of the two components. The fitting results for - are shown in Fig 2. Then we repeated the test fixing the velocity dispersion of NGC 1399 to 230 km s-1. In both experiments, the UCD kinematical and stellar population parameters, as well as the recovered UCD spectra were in excellent agreement. For - and - they also precisely matched the values obtained from the fitting of halo corrected spectra. The recovered relative mass contributions of two SSP models obtained from the two-component fitting converted into light contributions are also in a good agreement with the values estimated from the light profile of NGC 1399. However, for -, the NGC 1399 light contribution to the total spectrum recovered from the two-component fitting (73 per cent) turns to be lower than that determined from the brightness profile (83 per cent). This results in a 0.3 dex lower metallicity (-0.20.09 dex) and 6 km s-1 higher velocity dispersion (382 km s-1) for the two-component fitting.
From this test we conclude that for UCD spectra weakly and moderately (up-to 35 per cent) contaminated by the NGC 1399 halo, the correction technique based on re-scaling the NGC 1399 spectrum according to its brightness profile, is consistent with the direct two-component fitting of spectra. However, the latter approach becomes rather unstable for weakly contaminated spectra because the low overall signal-to-noise ratio of our data can not be compensated by high spectral resolution for the NGC 1399 component due to its very high intrinsic velocity dispersion.
2.2 Imaging data
Using Virtual Observatory tools, we identified 8 UCDs listed in table 3 of Mieske et al. (2008) as objects without available HST photometry. For two of them, - and -, F606W band archival HST WFPC2 band images available through the Hubble Legacy Archive (HLA)333http://hla.stsci.edu/ were found and analysed. The data discovery and access procedure comprised several steps:
-
1.
The reduced and combined FLAMES dataset was loaded into the VO-Paris Euro3D client444http://voplus.obspm.fr/chil/Euro3D/, a dedicated Virtual Observatory tool to work with multi-object and 3D spectorsopic datasets (Chilingarian et al., 2008a). The current version of the VO-Paris Euro3D client includes the native support of the FLAMES FITS data format.
-
2.
Then, the fibre coordinates were sent to cds aladin (Bonnarel et al., 2000) from the VO-Paris Euro3D client using the plastic555http://plastic.sourceforge.net/ application messaging protocol and then displayed on-top of a DSS2 image of the central part of the Fornax cluster. The 8 objects reported not to have HST imaging by Mieske et al. (2008) were selected from the list.
-
3.
Then, a footprint, i.e. a union of all fields of views of all HST imaging observations in a given area of the sky were requested from the HLA and displayed using cds aladin. Two out of eight objects were highlighted as those covered by the footprint.
-
4.
Selecting those two objects one by one in the display of cds aladin caused the entries corresponding to the WFPC2 field containing them to highlight in the HLA Simple Imaging Access query response metadata tree, i.e. a structured list of HLA datasets.
-
5.
Then, the corresponding WFPC2 images were retrieved from the HLA and analysed using the galfit software (Peng et al., 2002).
We used the TinyTim software666http://www.stsci.edu/software/tinytim/ to generate the WFPC2 PSF at the positions of - and - in the corresponding WFPC2 fields, which was then used during the light distribution fitting to convolve the input model light profiles.
Both - and - were fitted well by single-component Sersic (1968) profiles. For - we obtained the following parameters in the photometric band: mag, pc, . For -, the parameters are: mag, pc, .
3 Results and Discussion
3.1 Internal dynamics and stellar populations.
| name | Ch | Fe/H | ()d,V | ()∗V | D.M. | |||||
|---|---|---|---|---|---|---|---|---|---|---|
| kpc | % | mag | km s-1 | km s-1 | Gyr | dex | ()⊙ | ()⊙ | per cent | |
| 27.5 | 1.7 | -12.19 | 1238.3 0.5 | 22.2 0.6 | 13.8 2.1 | -0.64 0.02 | 2.8 0.5 | 3.0 0.2 | -10 30 | |
| 33.2 | 3.8 | -11.35 | 1408.5 1.4 | 19.9 1.8 | 12.9 5.4 | -0.73 0.09 | 3.0 0.8 | 2.7 0.7 | 10 50 | |
| 26.3 | 2.7 | -11.71 | 1614.2 1.0 | 33.1 1.1 | 13.9 3.3 | -0.61 0.03 | 3.1 0.1 | |||
| 21.5 | 5.7 | -11.73 | 1660.6 0.9 | 25.4 1.0 | 15 3.2 | -0.34 0.03 | 2.1 0.3 | 3.8 0.6 | -80 30 | |
| 14.5 | 12 | -11.07 | 829.0 1.3 | 14.0 2.1 | 11.1 3.2 | -1.31 0.11 | 1.4 0.5 | 1.6 0.4 | -10 60 | |
| 35.2 | 2.6 | -11.13 | 1493.6 0.9 | 12.2 1.6 | 14.8 1.2 | -1.20 0.04 | 1.7 0.6 | 2.4 0.1 | -40 40 | |
| 38.9 | 2.2 | -11.30 | 1395.0 1.2 | 30.2 1.3 | 15 2.8 | -0.35 0.03 | 4.3 0.8 | 3.8 0.5 | 10 30 | |
| 58.4 | 1.2 | -11.33 | 1723.8 1.4 | 28.4 1.6 | 15 5.1 | -0.62 0.04 | 5.7 1.0 | 3.2 0.8 | 40 40 | |
| 7.7 | 21 | -11.50 | 1686.8 0.8 | 23.7 1.0 | 15 4.8 | -0.61 0.03 | 1.6 0.3 | 3.2 0.8 | -100 40 | |
| 1.6 | 83 | -12.08 | 1740.7 1.3 | 32.1 1.5 | 14.0 3.5 | 0.14 0.09 | 5.3 0.6 | |||
| 7.9 | 26 | -11.27 | 1369.6 1.2 | 28.0 1.4 | 15 4.4 | -0.55 0.04 | 2.5 0.5 | 3.3 0.9 | -30 50 | |
| 36.6 | 1.6 | -11.69 | 2008.9 0.8 | 27.2 0.9 | 6.9 0.8 | -0.41 0.07 | 2.0 0.2 | |||
| 45.1 | 0.4 | -13.39 | 1492.0 0.3 | 24.8 0.3 | 12.1 0.6 | -0.19 0.02 | 4.0 0.4 | 3.7 0.2 | 8 15 | |
| 32.5 | 3.9 | -11.10 | 671.6 1.1 | 11.9 1.8 | 10.2 3.3 | -1.02 0.12 | 2.1 0.5 | |||
| 54.7 | 1.1 | -11.12 | 1039.5 1.3 | 29.1 1.5 | 15 4.4 | -0.49 0.04 | 2.9 0.7 | 3.4 0.7 | -20 50 | |
| 71.3 | 0.8 | -11.66 | 1460.3 1.0 | 17.5 1.2 | 11.9 2.9 | -0.41 0.10 | 3.3 0.6 | |||
| 74.7 | 0.4 | -12.27 | 1888.4 0.8 | 29.1 1.0 | 15 2.0 | -0.67 0.03 | 5.2 0.7 | 3.1 0.2 | 40 20 | |
| 13.7 | 12 | -10.88 | 1161.0 1.6 | 16.9 2.5 | 2.0 0.4 | -0.94 0.18 | 0.7 0.0 | |||
| 21.2 | 7.9 | -10.78 | 927.4 1.4 | 11.0 2.6 | 10.9 3.5 | -1.39 0.14 | 1.8 0.5 | |||
| 21.0 | 7.2 | -10.73 | 1621.2 1.1 | 15.3 1.5 | 14.9 4.4 | -0.77 0.05 | 1.4 0.4 | 2.9 0.8 | -110 50 | |
| 30.2 | 5.8 | -10.59 | 1424.9 1.5 | 20.0 2.0 | 3.0 0.9 | -0.32 0.08 | 3.3 2.0 | |||
| 13.7 | 19 | -10.56 | 1242.9 1.3 | 20.9 1.6 | 15 5.6 | -0.23 0.11 | 2.8 0.8 | 4.2 1.2 | -50 60 | |
| 17.3 | 11 | -10.55 | 660.9 1.3 | 14.5 1.8 | 13.8 5.3 | -0.80 0.06 | 1.5 0.5 | 2.9 1.7 | -90 80 | |
| 29.8 | 5.5 | -10.43 | 966.6 1.5 | 19.6 1.8 | 15 6.0 | -0.26 0.06 | 4.1 1.3 |
The results of the full spectral fitting are presented in Table 2. We provide radial velocities, internal velocity dispersions, SSP-equivalent ages and metallicities for all 24 UCDs in our sample. We obtained the mass-to-light ratios of stellar populations from pegase.2 SSP models corresponding to the same ages and metallicities. We limited the grid of the stellar population models to the maximal age of 15 Gyr. There is a number of UCDs where the best-fitting age values corrspond to this limit. Although this value slightly exceeds the presently adopted age of the Universe, one has to keep in mind that there is a well-known “zero-point” problem in the stellar population models related to our insufficient knowledge of stellar evolution (see “the white paper” by Worthey 2009 for discussion). Therefore, published ages of early-type galaxies formally estimated using stellar models often slightly exceed the Hubble time.
We do not compare our stellar M/L ratios with those obtained using different stellar population models available in literature because in order to get consistent results, one has to use the sets of models based on the same ingredients (e.g. stellar evolutionary tracks, IMFs, binary fractions) to estimate stellar population parameters from the spectra and M/L ratios from these parameters. Most ingredients are the same for the pegase.hr and pegase.2 models. Even though stellar libraries differ, the M/L ratios of the two sets match in the -band. At the same time, using different models (e.g. Bruzual & Charlot, 2003) for the M/L ratio estimates would require to use them as well for the determination of stellar population parameters with the full spectral fitting. However, fitting low resolution SSP models against our data in a narrow spectral range of the FLAMES HR09 setup would not allow us to make any sensible estimates of age and metallicity.
The uncertainties of the stellar population parameters range from 0.03 dex in Fe/H and 15 per cent in age for - (UCD 3) to 0.3 dex in metallicity and totally uncertain age for the faintest representatives of our sample such as -. Generally, there is a clear correlation between the quality of age determination and the overall metallicity of a galaxy, which can be easily explained as in more metal-rich objects absorption lines are stronger, thus better constraining the fitting procedure for a given mean signal-to-noise ratio in the continuum.
Thanks to the high spectral resolution of our data and, therefore a well sampled line-of-sight velocity distribution in most UCDs, the velocity dispersion – metallicity degeneracy (see Section 1.3.1 in Chilingarian, 2006, for details) intrinsic to the full spectral fitting in the pixel space makes very little effect on the obtained measurements of velocity dispersion. Hence, even in cases where the metallicity measurements have very large uncertainties due to low signal-to-noise ratios, the velocity dispersions still remain well determined.
Our velocity dispersion values sometimes differ significantly from those obtained by Mieske et al. (2008) (see Fig. 7), therefore their results of dynamical modelling, i.e. aperture corrections, central and global velocity dispersions, and, consequently, dynamical mass-to-light ratios have to be corrected. We repeated the dynamical modelling in exactly the same way as in Hilker et al. (2007); Mieske et al. (2008) using new velocity dispersion estimates and structural properties from Mieske et al. (2008) for 13 UCDs, and the photometric properties of - and - presented above.
3.2 Dark matter content and stellar mass function.
Using dynamical and stellar mass-to-light ratios, we estimate the dark matter content of 14 UCDs in our sample as . The corresponding fractions in per cent are presented in the last column of Table 2. For 9 our of 14 objects the derived dark matter contents are consistent with zero, while for -, -, -, and - the dynamical masses turn to be lower than the stellar ones resulting in “negative” formally computed dark matter fractions, i.e. 100 per cent corresponding to the stellar ratio being twice as high as the dynamical one. What is the reason for derived negative dark matter fractions? We either underestimate the dynamical mass and/or overestimate the stellar one.
Underestimatation of dynamical masses may originate from imperfect surface photometry (too small effective radius) or velocity dispersion measurements biased towards lower values. Although our UCDs have quite small spatial sizes, most of them are sufficiently well resolved to rule out the former possibility. The latter option is also hardly possible, because our data have sufficiently high spectral resolution to reliably measure velocity dispersions down to 5 km s-1.
Stellar masses may become overestimated if the adopted stellar mass-to-light ratio is too high. The only parameter which may strongly affect them at our regime (i.e. old ages, intermediate and low metallicities) is the shape of the stellar mass function at low masses, where stars do not contribute much to the total light, but do change significantly the mass because of strongly non-linear behaviour of the mass–luminosity relation for main sequence stars. Changing the low mass slope power law index from 2.3 to 1.3 (i.e. Salpeter to Kroupa) decreases the mass-to-light ratios of old stellar populations by 50 per cent. Does this suggest IMF variations in the UCDs of our sample?
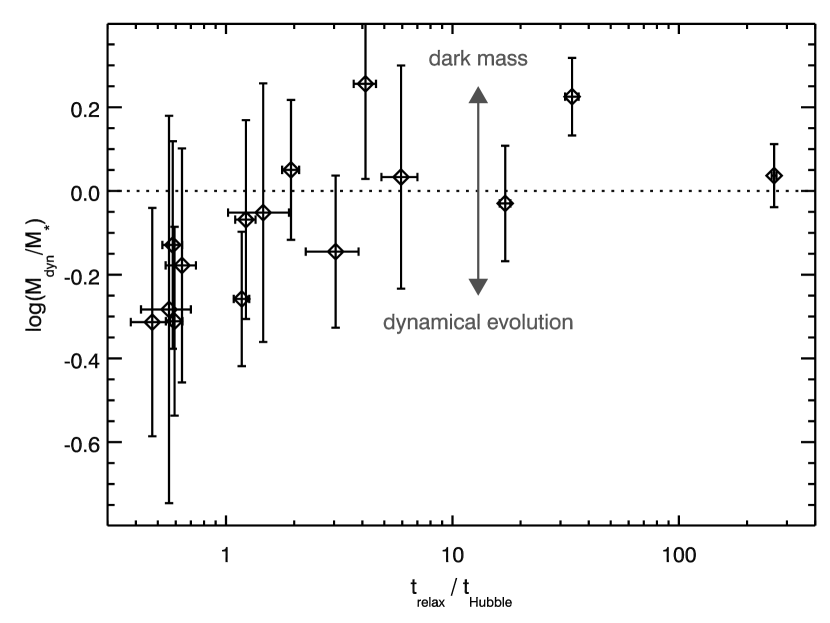
We have to keep in mind that CSSs observed today might have experienced dynamical evolution effects on their stellar mass functions, i.e. the observed mass function may differ from the IMF. It is known (Spitzer, 1987; Baumgardt & Makino, 2003; Khalisi et al., 2007; Kruijssen & Mieske, 2009) that in globular clusters the dynamical evolution causes mass segregation, i.e. massive stars are moving toward the centre while low-mass stars migrate to the cluster outskirts, where they are tidally stripped during the passages close to the centre of a host galaxy or through its disc. This creates a deficit of low mass stars in a cluster, changing the shape of its integrated stellar mass function. The characteristic timescale of this process is related to the dynamical relaxation time, which can be estimated for a CSS (Mieske et al., 2008) as Myr, where is in Solar masses and is in pc.
In Fig 6 we present the ratio between dynamical () and stellar () masses versus the relaxation time. We see the trend that objects where estimates exceed have relaxation times shorter than the Hubble time. This trend is similar to that presented in Fig 12 of Mieske et al. (2008), but in our case the dynamical mass-to-light ratios are normalised by the stellar ones. It suggests that for some of the least massive UCDs dynamical evolution is sufficiently advanced to have experienced preferential loss of low mass stars and a corresponding flattening of the low-mass stellar mass function, such that we overestimate stellar masses assuming it to have the Kroupa IMF shape.
We notice that at the same time very little, if any, dark mass beyond a canonical Kroupa IMF is required to explain the dynamical ratios of the more massive UCDs investigated here. Since the massive UCDs described in this study are dynamically un-evolved, the mass segregation and possible tidal stripping of low-mass stars should not affect them. Therefore, we can rule out very bottom heavy IMFs like in Salpeter (1955), which would correspond to 50 per cent larger stellar masses and hence imply negative dark matter fraction for all investigated sources.
There have been various claims in the recent literature regarding a possible variation or invariance of the IMF at cosmological distances. While Cappellari et al. (2006); Ferreras et al. (2008) argue against a bottom heavy Salpeter type IMF at high redshift, other gravitational lens results do favour a bottom-heavy Salpeter IMF (Treu et al., 2010; Auger et al., 2010; Grillo & Gobat, 2010). Our result for the investigated Fornax UCDs is hence in line with the former studies. A caveat is that the M/L ratios of UCDs appear to vary systematically amongst different environments (Mieske et al., 2008). The case may indeed be different for Virgo UCDs which show on average some 40 per cent higher M/L at comparable metallicity and age, and which hence appear good candidates for an IMF that deviates from the Kroupa form (Dabringhausen et al., 2008).
3.3 Comparison with literature
Three objects in our sample, -1 (UCD 2), -19 (UCD 3), and -24 (UCD 4), have published measurements of internal kinematics and stellar populations (Chilingarian et al., 2008b) obtained using exactly the same data analysis technique, i.e. the NBursts full spectral fitting FLAMES-LR04 spectra having similar although slightly wider wavelength range but twice lower spectral resolution. The velocity dispersion measurements agree remarkably well for all three objects. The metallicity measurements agree within a few hundredths dex for UCD 3 and UCD 4, however being discrepant by dex for UCD 2. For this object, the age estimations also differ: intermediate in Chilingarian et al. (2008b) and old in our present study. We notice, however, that the discrepancy of the UCD 2 age and metallicity measurements in Chilingarian et al. (2008b) and our present study follow the age–metallicity degeneracy. Given quite poor data quality and large size of stellar population confidence levels in Chilingarian et al. (2008b) we conclude that the discrepancy between the measurements can be explained by statistical effects. Age determinations for UCD 3 and UCD 4 agree between the two studies within 2 of their statistical uncertainties.
It is worth mentioning, that the metallicity estimates for all three UCDs presented in Mieske et al. (2006) are systematically lower by 0.200.25 dex compared to our present measurements.
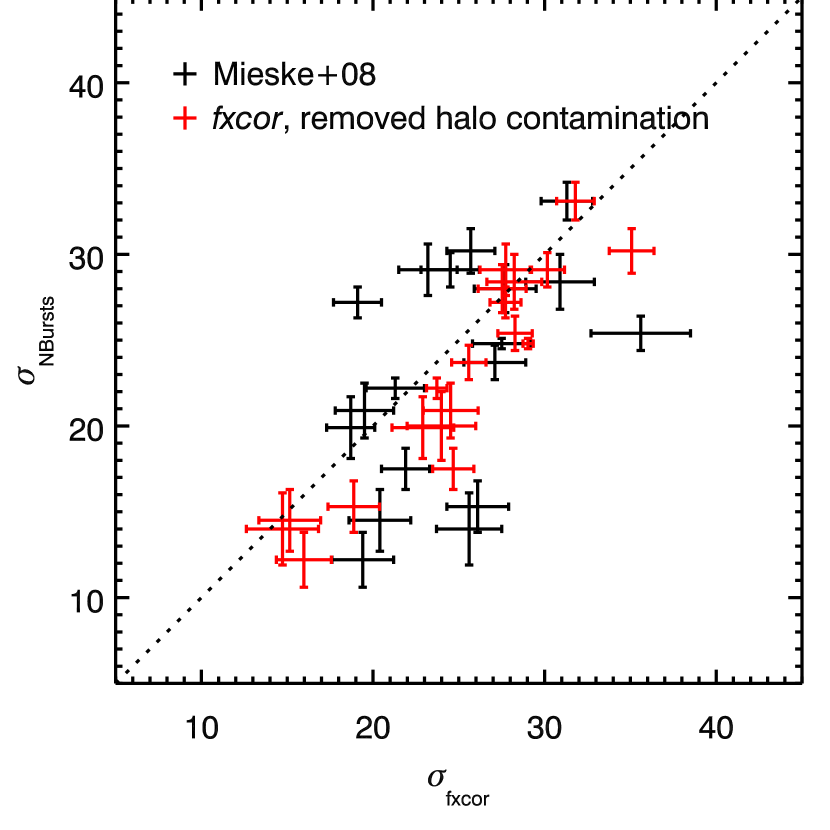
In Fig 7 (black data points) we present the comparison of published velocity dispersion measurements for 19 UCDs (Mieske et al., 2008) with those obtained in our study with the NBursts full-spectral fitting technique. Although the general trend agrees, the measurements for individual objects are often notably discrepant.
The reasons for the discrepancy are: (1) template mismatch during cross-correlation due to the metallicity difference between UCDs and Cen giant stars served as templates; (2) slightly different wavelength ranges used for the data analysis (inclusion of the Mg triplet region in our study); (3) our correction for the contamination of UCD spectra by the NGC 1399 halo which Mieske et al. (2008) did not apply.
The metallicity difference between the spectra and templates used to analyse them may lead to biased velocity dispersion measurements (see Section 1.3.1 in Chilingarian, 2006) at least if the analysis is done in the pixel space, thus affecting both NBursts full spectral fitting and fxcor cross-correlation measurements. The low metallicity of a template star resulting in shallower absorption lines may be compensated by decreasing the velocity dispersion, i.e. smearing absorption lines to a lower degree than it should be in order to match the line depth in the target spectrum being analysed. Then we would expect to see the correlation between UCD metallicities and differences of velocity dispersion measurements in Mieske et al. (2008) and our present study, which we do not detect at a statistically significant level. This can be explained because the described degeneracy between metallicity and velocity dispersion mostly affects the data for targets with velocity dispersions similar to or lower than the instrumental spectral resolution. In our case, most low- targets have low metallicities well corresponding to those of the Cen template stars. On the other hand, massive metal-rich UCDs with relatively high velocity dispersions are bright,hence their spectra have good signal-to-noise ratios reducing the degeneracy effects.
Mieske et al. (2008) had to exclude the Mg triplet region from their analysis as it seemed to bias the velocity dispersion measurements obtained using the cross-correlation technique. However, Mg is the most prominent spectral feature in the wavelength range of our spectra, thus containing a large fraction of spectral information. We performed the NBursts spectral fitting in the wavelength range Å and compared the measurements of velocity dispersion with those obtained from the fitting in the entire available wavelength range aimed at checking whether the full spectral fitting technique also suffers from similar biases. The values turned to be consistent within their uncertainties, however, being almost half as precise in case of the truncated wavelength range. Therefore, we conclude that the biases of velocity dispersion measurements obtained by cross-correlation including the Mg triplet in the wavelength range probably originate from the template mismatch when using stellar spectra as references, which is minimized in our case by selecting the best-matching SSP from the grid of stellar population models. As far as these biases affect only measurements of low velocity dispersions in objects like globular clusters made on relatively high resolution spectra and do not seem to show up in studies of relatively massive galaxies, we suppose that this mismatch between the spectra of individual stars and unresolved stellar populations originates from subtle absorption-line features and becomes important only at high spectral resolution.
Finally, we repeated the velocity dispersion measurements of Mieske et al. (2008) using the fxcor task in noao iraf, but now applied to the UCD spectra corrected for the contamination of NGC 1399. Using the same stellar templates of Cen as in Mieske et al. (2008), the discrepancy to the results obtained with the NBursts technique has dramatically decreased which is clearly seen in Fig 7 (red data points). We obtain a good agreement between the two datasets, with only a small residual systematic offset in the sense that fxcor dispersions are slightly larger than Nburst dispersions for low dispersion values. Thus, we conclude that the contamination of the spectra by the host galaxy halo is the main reason for biases of the estimated kinematical parameters, and it has to be taken into account in all studies addressing the internal dynamics of compact stellar systems.
3.4 Faber–Jackson and metallicity–luminosity relations.
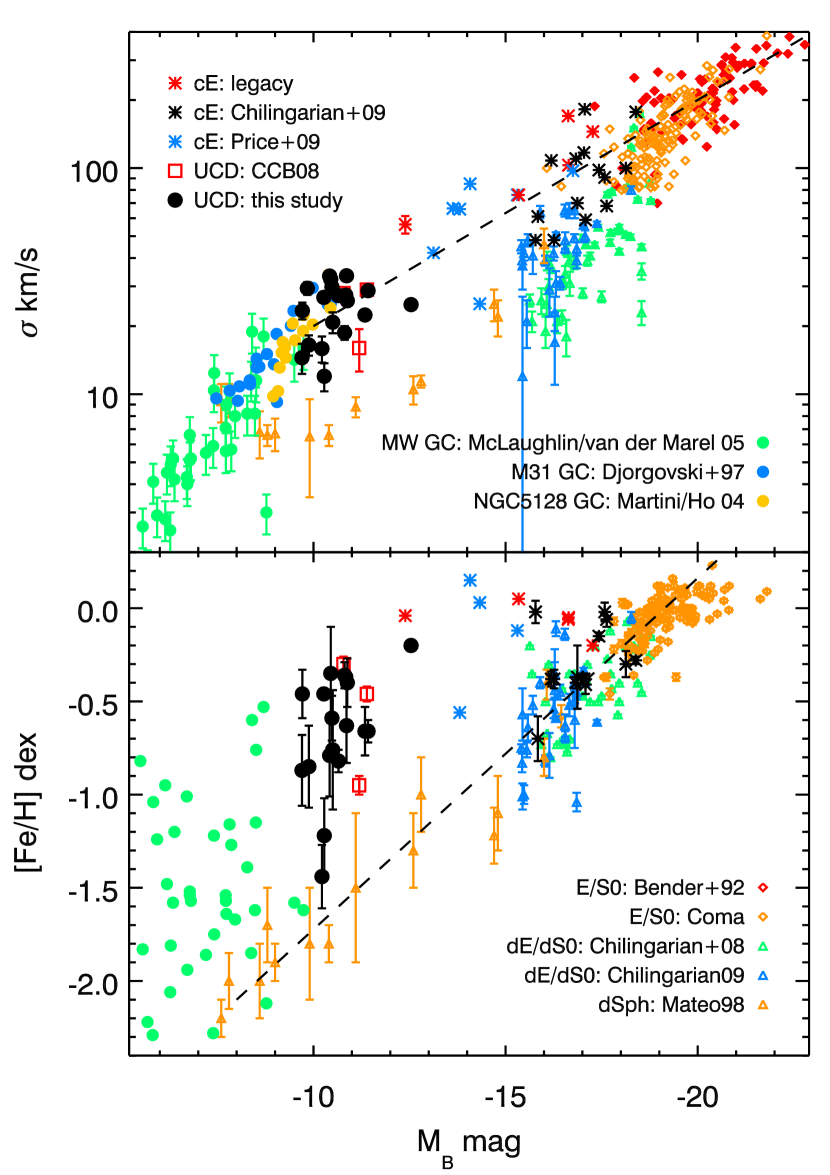
In Fig. 8 we present the relation between absolute magnitudes and measured velocity dispersions (top, Faber & Jackson, 1976) and metallicities (bottom) for early-type galaxies and CSSs. The giant galaxies are represented by 140 early-type galaxies in the Coma cluster from SDSS DR7 (Abazajian et al., 2009) obtained using the NBursts technique and velocity dispersion measurements from Bender et al. (1992). The data for dE/dS0s are from Chilingarian et al. (2008c) and Chilingarian (2009) (global “main galactic body” values). The local group dwarf spheroidals from Mateo (1998) are at the low-luminosity end of the diagrams. The data for cE galaxies including “legacy” objects are from Chilingarian et al. (2009), transitional cE/UCD galaxies are from Chilingarian & Mamon (2008) and Price et al. (2009), and three additional UCDs are from Chilingarian et al. (2008b). The globular cluster data come from McLaughlin & van der Marel (2005); Djorgovski et al. (1997); Martini & Ho (2004) for Milky Way, M 31, and NGC 5128 clusters respectively.
In the upper panel of Fig. 8, we see that all new kinematical measurements of UCDs follow the faint magnitude extrapolation of the Faber–Jackson relation () defined initially for giant early-type galaxies and shown as a dashed line in the upper panel of Fig. 8. Most cEs and transitional cE/UCD galaxies reside on it. At the same time, dEs, dS0s and the dark matter dominated dSph galaxies deviate from the Faber-Jackson relation exhibiting lower velocity dispersions for the same luminosity.
Globular clusters form a different sequence on this diagram having a steeper slope () than the Faber–Jackson relation. UCDs of our sample populate the low-luminosity extension of the Faber–Jackson sequence down to luminosities where it joins with that of globular clusters creating a smooth transition.
On the metallicity–luminosity diagram the situation is notably different: the relation denoted by a dashed line in the lower panel of Fig. 8, is formed by dSph, dE/dS0, and giant early-type galaxies, whereas the compact galaxies are generally more metal-rich and do not show such a correlation between their metallicities and luminosities filling the entire region above the relation up-to the solar metallicity. The offset metallicity with respect to the extended dwarf spheroidals is consistent with a more efficient self-enrichment, and/or them being formed from already pre-enriched material in the course of wet galaxy mergers.
3.5 Origin of UCD galaxies
We conclude this paper with a brief discussion on the origin of UCDs. One can break down the currently discussed formation channels (see Introduction) into two concepts:
-
1.
UCDs are tidally stripped remnants of more extended galaxies, hence of galaxian origin. As such they would also trace the tidal disruption of low-mass dwarf galaxies.
-
2.
UCDs are massive star clusters – or mergers thereof – whose formation is closely linked to the formation of the bulk of the globular cluster population.
Regarding the first concept, Chilingarian et al. (2009) demonstrated that a Milky Way sized disc becomes tidally stripped on a timescale of 0.5–1 Gyr by an intermediate mass cD galaxy similar to the Virgo cluster M 87. Since dwarf galaxies usually have lower stellar disc densities, the threshing should be even more efficient and quick. A single passage near the cD galaxy should be sufficient, suggesting a characteristic time of the process to be about 200 Myr. This explains why we do not observe many dEN galaxies during the process of tidal stripping, this phase is short and therefore it is statistically unlikely to observe it.
The discovery of the first transitional cE/UCD galaxy M59cO (Chilingarian & Mamon, 2008) and a population of galaxies in the Coma cluster (Price et al., 2009) completely filling the mass gap between cEs and bright UCDs, gives additional support to the common evolutionary path followed by members of these two classes. However, classical cE galaxies can hardly be formed as tidal superclusters in galaxy mergers because (1) they have very significant masses exceeding which are quite problematic to assemble; (2) all nearby cEs rotate and contain either confirmed central supermassive black holes (Davidge et al., 2008) or central bumps in the velocity dispersion distribution probably caused by them (Chilingarian & Bergond, 2010).
Thus, if we accept (massive) UCDs and cEs to share the same evolutionary scenario, they should have formed by the tidal threshing of more massive progenitors. The clearest candidates for such tidally stripped nuclei are the two respective most massive UCDs in the Fornax and Virgo cluster (e.g. Evstigneeva et al., 2007; Hilker et al., 2007), which have extended low-surface brightness envelopes. They have masses and clearly stand out among all other UCDs in terms of their sizes and luminosities, see also the location in the M plane in Fig. 8 for the most massive Fornax UCD.
In contrast, the bulk of fainter, lower mass UCDs show a smooth luminosity and size transition towards the regime of ordinary globular clusters, and their number counts are typically well accounted for by an extrapolation of the globular cluster luminosity function (e.g. Mieske et al., 2004). This is consistent with a scenario where the bulk of these UCDs (in particular the metal-rich ones) formed when the majority of the red GCs and the spheroids of their host galaxies were created (either via a monolithic collapse or multiple wet mergers).
Acknowledgments
IC acknowledges the ESO Visiting Scientist programme. This study is based on observations made with the European Southern Observatory Very Large Telescope; partially based on observations made with the NASA/ESA Hubble Space Telescope, and obtained from the Hubble Legacy Archive, which is a collaboration between the Space Telescope Science Institute (STScI/NASA), the Space Telescope European Coordinating Facility (ST-ECF/ESA) and the Canadian Astronomy Data Centre (CADC/NRC/CSA). This research has made use of SAOImage ds9, noao iraf, and cds aladin software tools and packages.
References
- Abazajian et al. (2009) Abazajian, K. N., et al. 2009, ApJS, 182, 543
- Auger et al. (2010) Auger, M. W., Treu, T., Gavazzi, R., Bolton, A. S., Koopmans, L. V. E., & Marshall, P. J. 2010, ApJ, 721, L163
- Baumgardt & Makino (2003) Baumgardt, H. & Makino, J. 2003, MNRAS, 340, 227
- Bekki et al. (2001) Bekki, K., Couch, W. J., & Drinkwater, M. J. 2001, ApJ, 552, L105
- Bender et al. (1992) Bender, R., Burstein, D., & Faber, S. M. 1992, ApJ, 399, 462
- Bergond et al. (2007) Bergond, G., et al. 2007, A&A, 464, L21
- Bonnarel et al. (2000) Bonnarel, F., et al. 2000, A&AS, 143, 33
- Bruzual & Charlot (2003) Bruzual, G. & Charlot, S. 2003, MNRAS, 344, 1000
- Cappellari et al. (2006) Cappellari, M., et al. 2006, MNRAS, 366, 1126
- Cappellari & Emsellem (2004) Cappellari, M. & Emsellem, E. 2004, PASP, 116, 138
- Chilingarian (2006) Chilingarian, I. 2006, PhD thesis, Moscow State University & Université Claude Bernard, Lyon; astro-ph/0611893
- Chilingarian et al. (2008a) Chilingarian, I., et al. 2008a, in Astronomical Spectroscopy and Virtual Observatory, ed. M. Guainazzi & P. Osuna, 125, arXiv:0711.0412
- Chilingarian et al. (2009) Chilingarian, I., Cayatte, V., Revaz, Y., Dodonov, S., Durand, D., Durret, F., Micol, A., & Slezak, E. 2009, Science, 326, 1379
- Chilingarian et al. (2007a) Chilingarian, I., Prugniel, P., Sil’chenko, O., & Koleva, M. 2007a, in IAU Symposium, Vol. 241, Stellar Populations as Building Blocks of Galaxies, ed. A. Vazdekis & R. R. Peletier (Cambridge, UK: Cambridge University Press), 175–176, arXiv:0709.3047
- Chilingarian (2009) Chilingarian, I. V. 2009, MNRAS, 394, 1229
- Chilingarian & Bergond (2010) Chilingarian, I. V. & Bergond, G. 2010, MNRAS, 405, L11
- Chilingarian et al. (2008b) Chilingarian, I. V., Cayatte, V., & Bergond, G. 2008b, MNRAS, 390, 906
- Chilingarian et al. (2008c) Chilingarian, I. V., Cayatte, V., Durret, F., Adami, C., Balkowski, C., Chemin, L., Laganá, T. F., & Prugniel, P. 2008c, A&A, 486, 85
- Chilingarian & Mamon (2008) Chilingarian, I. V. & Mamon, G. A. 2008, MNRAS, 385, L83
- Chilingarian et al. (2007b) Chilingarian, I. V., Prugniel, P., Sil’chenko, O. K., & Afanasiev, V. L. 2007b, MNRAS, 376, 1033
- Dabringhausen et al. (2008) Dabringhausen, J., Hilker, M., & Kroupa, P. 2008, MNRAS, 386, 864
- Davidge et al. (2008) Davidge, T. J., Beck, T. L., & McGregor, P. J. 2008, ApJ, 677, 238
- Dirsch et al. (2003) Dirsch, B., Richtler, T., Geisler, D., Forte, J. C., Bassino, L. P., & Gieren, W. P. 2003, AJ, 125, 1908
- Djorgovski et al. (1997) Djorgovski, S. G., Gal, R. R., McCarthy, J. K., Cohen, J. G., de Carvalho, R. R., Meylan, G., Bendinelli, O., & Parmeggiani, G. 1997, ApJ, 474, L19
- Drinkwater et al. (2003) Drinkwater, M. J., Gregg, M. D., Hilker, M., Bekki, K., Couch, W. J., Ferguson, H. C., Jones, J. B., & Phillipps, S. 2003, Nature, 423, 519
- Drinkwater et al. (2000) Drinkwater, M. J., et al. 2000, A&A, 355, 900
- Evstigneeva et al. (2007) Evstigneeva, E. A., Drinkwater, M. J., Jurek, R., Firth, P., Jones, J. B., Gregg, M. D., & Phillipps, S. 2007, MNRAS, 378, 1036
- Faber & Jackson (1976) Faber, S. M. & Jackson, R. E. 1976, ApJ, 204, 668
- Fellhauer & Kroupa (2002) Fellhauer, M. & Kroupa, P. 2002, MNRAS, 330, 642
- Fellhauer & Kroupa (2005) Fellhauer, M. & Kroupa, P. 2005, MNRAS, 359, 223
- Ferreras et al. (2008) Ferreras, I., Saha, P., & Burles, S. 2008, MNRAS, 383, 857
- Forbes et al. (2008) Forbes, D. A., Lasky, P., Graham, A. W., & Spitler, L. 2008, MNRAS, 389, 1924
- Freedman et al. (2001) Freedman, W. L., et al. 2001, ApJ, 553, 47
- Gilmore et al. (2007) Gilmore, G., Wilkinson, M., Kleyna, J., Koch, A., Evans, W., Wyse, R. F. G., & Grebel, E. K. 2007, Nuclear Physics B Proceedings Supplements, 173, 15
- Goerdt et al. (2008) Goerdt, T., Moore, B., Kazantzidis, S., Kaufmann, T., Macciò, A. V., & Stadel, J. 2008, MNRAS, 385, 2136
- Grillo & Gobat (2010) Grillo, C. & Gobat, R. 2010, MNRAS, 402, L67
- Haşegan et al. (2005) Haşegan, M., et al. 2005, ApJ, 627, 203
- Hilker et al. (2007) Hilker, M., Baumgardt, H., Infante, L., Drinkwater, M., Evstigneeva, E., & Gregg, M. 2007, A&A, 463, 119
- Hilker et al. (1999) Hilker, M., Infante, L., Vieira, G., Kissler-Patig, M., & Richtler, T. 1999, A&AS, 134, 75
- Jones et al. (2006) Jones, J. B., et al. 2006, AJ, 131, 312
- Jordán et al. (2005) Jordán, A., et al. 2005, ApJ, 634, 1002
- Khalisi et al. (2007) Khalisi, E., Amaro-Seoane, P., & Spurzem, R. 2007, MNRAS, 374, 703
- Kroupa et al. (1993) Kroupa, P., Tout, C. A., & Gilmore, G. 1993, MNRAS, 262, 545
- Kruijssen & Mieske (2009) Kruijssen, J. M. D. & Mieske, S. 2009, A&A, 500, 785
- Le Borgne et al. (2004) Le Borgne, D., Rocca-Volmerange, B., Prugniel, P., Lançon, A., Fioc, M., & Soubiran, C. 2004, A&A, 425, 881
- Martini & Ho (2004) Martini, P. & Ho, L. C. 2004, ApJ, 610, 233
- Mateo (1998) Mateo, M. L. 1998, ARA&A, 36, 435
- McLaughlin & van der Marel (2005) McLaughlin, D. E. & van der Marel, R. P. 2005, ApJS, 161, 304
- Mieske et al. (2002) Mieske, S., Hilker, M., & Infante, L. 2002, A&A, 383, 823
- Mieske et al. (2004) Mieske, S., Hilker, M., & Infante, L. 2004, A&A, 418, 445
- Mieske et al. (2006) Mieske, S., Hilker, M., Infante, L., & Jordán, A. 2006, AJ, 131, 2442
- Mieske et al. (2007) Mieske, S., Hilker, M., Jordán, A., Infante, L., & Kissler-Patig, M. 2007, A&A, 472, 111
- Mieske et al. (2008) Mieske, S., et al. 2008, A&A, 487, 921
- Mieske & Kroupa (2008) Mieske, S. & Kroupa, P. 2008, ApJ, 677, 276
- Misgeld et al. (2008) Misgeld, I., Mieske, S., & Hilker, M. 2008, A&A, 486, 697
- Pasquini et al. (2002) Pasquini, L., et al. 2002, The Messenger, 110, 1
- Peng et al. (2002) Peng, C. Y., Ho, L. C., Impey, C. D., & Rix, H.-W. 2002, AJ, 124, 266
- Phillipps et al. (2001) Phillipps, S., Drinkwater, M. J., Gregg, M. D., & Jones, J. B. 2001, ApJ, 560, 201
- Price et al. (2009) Price, J., et al. 2009, MNRAS, 397, 1816
- Prugniel et al. (2007) Prugniel, P., Soubiran, C., Koleva, M., & Le Borgne, D. 2007, ArXiv Astrophysics e-prints, astro
- Saglia et al. (2000) Saglia, R. P., Kronawitter, A., Gerhard, O., & Bender, R. 2000, AJ, 119, 153
- Salpeter (1955) Salpeter, E. E. 1955, ApJ, 121, 161
- Schuberth et al. (2010) Schuberth, Y., Richtler, T., Hilker, M., Dirsch, B., Bassino, L. P., Romanowsky, A. J., & Infante, L. 2010, A&A, 513, A52+
- Sersic (1968) Sersic, J. L. 1968, Atlas de galaxias australes (Cordoba, Argentina: Observatorio Astronomico, 1968)
- Spitzer (1987) Spitzer, L. 1987, Dynamical evolution of globular clusters, ed. Spitzer, L.
- Taylor et al. (2010) Taylor, M. A., Puzia, T. H., Harris, G. L., Harris, W. E., Kissler-Patig, M., & Hilker, M. 2010, ApJ, 712, 1191
- Treu et al. (2010) Treu, T., Auger, M. W., Koopmans, L. V. E., Gavazzi, R., Marshall, P. J., & Bolton, A. S. 2010, ApJ, 709, 1195
- van Dokkum (2001) van Dokkum, P. G. 2001, PASP, 113, 1420
- Worthey (1994) Worthey, G. 1994, ApJS, 95, 107
- Worthey (2009) Worthey, G. 2009, in Astronomy, Vol. 2010, astro2010: The Astronomy and Astrophysics Decadal Survey, 325–+
Appendix A Age and metallicity sensitive spectral information in the FLAMES/Giraffe HR09 setup
Using the technique described in Chilingarian (2009), we quantified the age and metallicity sensitive information in the absorption-line spectra at intermediate spectral resolution in the wavelength range corresponding to the HR09 setup of FLAMES/Giraffe for a single SSP fitting. We explored the relative sensitivity of different spectral features to the stellar population parameters defined in the rotated age–metallicity coordinate system (Chilingarian et al., 2008c; Chilingarian, 2009) with the axis parallel to the age–metallicity degeneracy (Worthey, 1994):
| (1) |
The contribution of every pixel at every wavelength to the total depends on many parameters. In order to estimate the fitting procedure sensitivity to a given parameter at a given wavelength , we should compute the corresponding partial derivative of the template grid removing the global continuum shape, i.e. accounting for the multiplicative continuum variations. Hence, the response to a stellar population parameter (and similarly, ) at a given point of the parameter space is expressed as:
| (2) |
where is the LOSVD, is the flux of a given SSP template spectrum characterised by its age and metallicity at a given wavelength, is the -th order multiplicative Legendre polynomial. The meaning of this equation is that the squared fitting residuals of a spectrum against the model at every pixel would correspond to its contribution to the overall when varying .
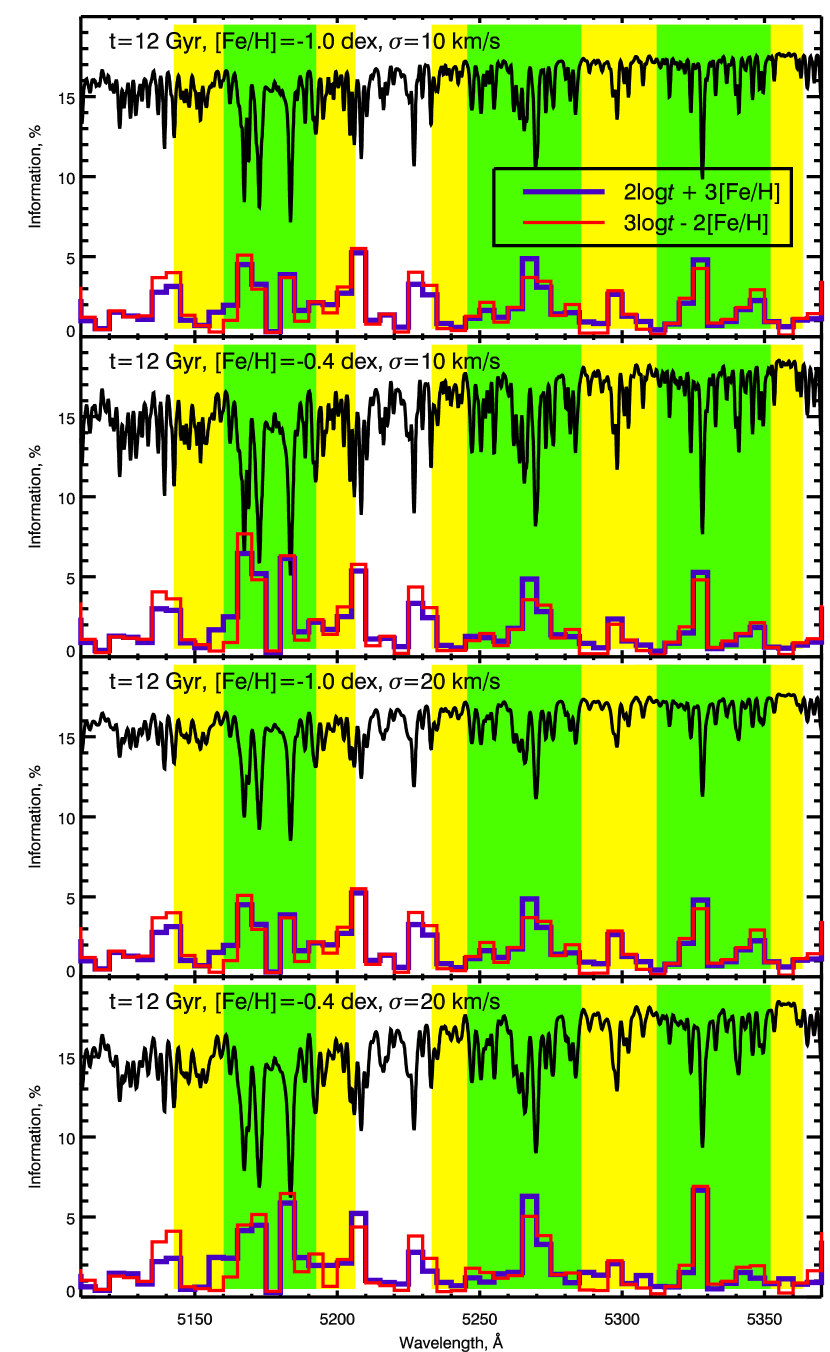
In practice, we compute these derivatives numerically using a “one-side” approach, i.e. computing the function values at a point of interest and at a nearby point slightly offset from it on a given coordinate. For our test we chose two SSP models with the age Gyr and metallicities and dex correspondingly. Then we convolved them with Gaussian kernels corresponding to the internal velocity dispersions of 10 and 20 km s-1 and, thus, obtained four model spectra or “reference SSPs”. Then for every of them we varied the and parameters corresponding to their ages and metallicities (see Eq. 1) by 0.05 dex, which corresponds to (12.8 Gyr, dex) and (13.2 Gyr, dex) for the metal-poor models and to (12.8 Gyr, dex) and (13.2 Gyr, dex) for the metal-rich ones. Later, we fitted these models against their “reference SSPs” using the ppxf procedure (Cappellari & Emsellem, 2004) with the 10th order multiplicative polynomial continuum. The fitting residuals obtained by this procedure correspond to the quantity defined in Eq. 2.
We have co-added the information on -, and -sensitivity in 5 Å bins in the wavelength range between 5100 and 5380 Å and normalised it by the total value of non-reduced thus obtaining the relative importance of every 5 Å-wide bin to the determination of the stellar population parameters. The results for our four “reference SSPs” are shown in Fig 9. One should not directly compare blue and red curves, because they represent the normalised quantities. The absolute values of as defined by Eq. 2 are 2–2.6 times higher than explaining the elongated shapes of the 1- uncertainty ellipses in the age–metallicity space.
The age and metallicity response cannot be determined directly using this approach, because these two parameters are degenerated. Then, the formally computed sensitivity will become overestimated.
We see that -sensitive information (the one allowing us to break the age–metallicity degeneracy) and -sensitive information represented by red and blue histograms in Fig. 9 respectively are distributed slightly differently along the wavelength range. In general, the blue and red histograms are much more similar to each other than in the case of lower spectral resolution as presented in fig. 2 of Chilingarian (2009). However, we see in Fig. 9 that at high spectral resolution the sensitivity across the age–metallicity degeneracy (blue histogram) is stronger correlated with equivalent widths of metal absorption lines than that along the degeneracy (red histogram) which is more bound to the Mg triplet and fainter absorptions around 5140 Å and 5230 Å but not to the strong iron multiplet defining the Fe5270 Lick index.
The main conclusion we draw from this test is that when we use the full spectral fitting at a sufficiently high spectral resolution, then even in the narrow wavelength range of the FLAMES/Giraffe HR09 setup including no “traditional” age indicators such as H, we are able to constrain stellar population age with a high level of accuracy.
The whole idea of the stellar population determination using the full spectral fitting is related to the difference of age and metallicity response functions of different pixels in a spectrum. These are related to the flux response of a stellar spectrum at a given wavelength to effective temperature, surface gravity, and metallicity, because we use the stellar spectra as principal ingredients to build stellar population models. Even if we deal with the spectral region containing mostly lines of metals, which become deeper when the stellar population metallicity is increasing or the population is becoming older, the exact behaviour of individual lines (or groups of lines) will be slightly different which is again connected to the absorption line properties in stellar spectra. For example, the behaviour of the Mg triplet equivalent width as a function of is not the same as that of the Fe5270 multiplet, while the metallicity dependence is rather similar. These differences for different sometimes very faint spectral lines and molecular bands are co-added at every pixel included in the fitting and at the end bring enough contribution to the in order to determine the age of the stellar population from the fitting procedure. However, if the intrinsic velocity dispersion of the stellar system being studied is high (or, alternatively, the spectral resolution is low), then the age and metallicity sensitive information in faint absorption line features is rapidly decreasing, hence increasing the relative importance of the most prominent spectral features as those used to define the Lick system. Therefore, while we can successfully determine stellar population properties of UCDs from our FLAMES/Giraffe HR09 data, it would be virtually impossible to do so for giant early-type galaxies, because of their high intrinsic velocity dispersions.