Determination of the forward slope in and elastic scattering up to LHC energy
Claude Bourrely Département de Physique, Faculté des Sciences de Luminy,
Université de la Méditerranée - Aix-Marseille II,
13288 Marseille, Cedex 09, France
Jacques Soffer Physics Department, Temple University
Barton Hall, 1900 N, 13th Street
Philadelphia, PA 19122-6082, USA
Tai Tsun Wu
Harvard University, Cambridge, MA 02138, USA and
Theoretical Physics Division, CERN, 1211 Geneva 23, Switzerland
Abstract
In the analysis of experimental data on (or ) elastic differential cross section it is customary to define an average forward slope in the form , where is the momentum transfer. Taking as working example the results of experiments at Tevatron and SPS, we will show with the help of the impact picture approach, that this simplifying assumption hides interesting information on the complex non-flip scattering amplitude, and that the slope is not a constant. We investigate the variation of this slope parameter, including a model-independent way to extract this information from an accurate measurement of the elastic differential cross section. An extension of our results to the LHC energy domain is presented in view of future experiments.
Key words: elastic scattering, differential cross section,
forward slope
PACS numbers:13.85.Dz,11.80Fv,25.40.Cm,25.45.De
1 Introduction
High energy elastic scattering measured at ISR, SPS, and Tevatron colliders have provided usefull informations on the behavior of the scattering amplitude, in particular, on the nature of the Pomeron. A large step in energy domain is accomplished with the LHC collider presently running, giving a unique opportunity to improve our knowledge on the asymptotic regime of the scattering amplitude. The measurement of the differential cross section in previous experiments has shown the existence of a dip and a shrinkage of the diffraction peak with increasing energy. One information deduced from this measurement concerns the forward slope. It is generally assumed that the cross section near the forward direction behaves like , where the slope is treated on the average as a constant, which increases with the energy. In fact, from theoretical models, one can compute the slope with the result that it has an interesting behavior as a function of , linked to the analytic structure of the complex scattering amplitude. This feature was already noticed in Fig. 5 of Ref. [1].
In section 2 we will show using the impact picture approach (BSW) [1]-[3] developped many years ago, which has proven to give a reliable predictions of hadron-hadron elastic scattering, that the behavior of the complex scattering amplitude has an impact on the behavior of the forward slope. We will focus on SPS and Tevatron experiments, which give at the moment the highest available energy data, whereas ISR data could have been used as well. In section 3 we discuss the possibility to extract information on the slope from a measurement of the differential cross, without making reference to any theoretical model. In section 4 we extend our analysis to the LHC energy domain where we present some predictions in view of planed experiments by ATLAS/ALFA and TOTEM collaborations.
2 The slope behavior in the forward direction
In the impact picture approach [1] we define the scattering amplitude as 111The details of the parameters and formulas are given in [1]-[3]
| (1) |
where is the momentum transfer () and is the opaqueness at impact parameter and at a given energy . We take
| (2) |
the first term is associated with the ”Pomeron” exchange, which generates the diffractive component of the scattering and the second term is the Regge background which is negligible at high energy. The Pomeron energy dependence is given by the complex crossing symmetric expression
| (3) |
where is the third Mandelstam variable. This implies that the Pomeron is a fixed Regge cut rather than a Regge pole. The choice one makes for is essential and we take the Bessel transform of
| (4) |
where stands for the proton ”nuclear form factor”, parametrized like the electromagnetic form factor, as having two poles,
| (5) |
The total cross section reads
| (6) |
and the differential cross section
| (7) |
The slope of the differential cross section is given by
| (8) |
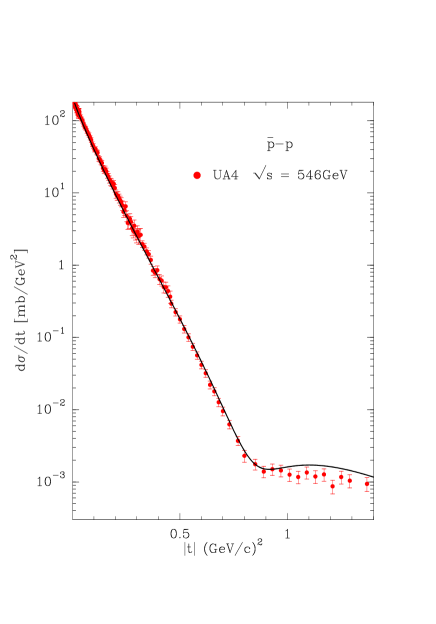
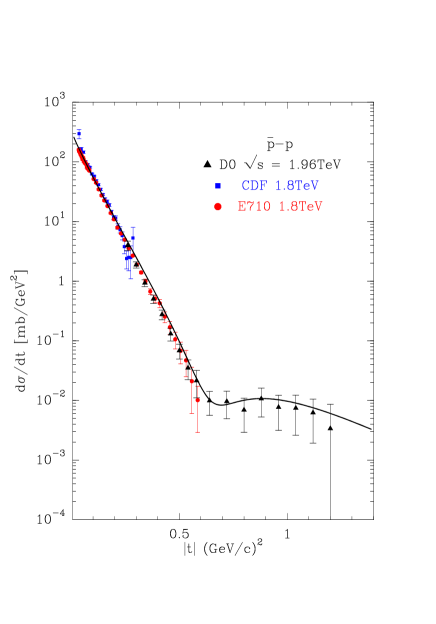
In order to have a global view of our predictions over the full measured range, the elastic differential cross sections are plotted in Fig. 1 for the UA4 experiment at [4]-[6] and for the D0, CDF, E710 experiments at [7]-[9]. A comparison of the prediction with experimental data gives respectively a /pt = 1.12 for UA4 and 1.2 for the Tevatron energies. In order to show the relation between the scattering amplitude and the slope near the forward direction, we plot in Fig. 2 the absolute value of the real and imaginary parts of the amplitude at together with the forward slope as a function of . One observes that the real part of the amplitude is negligible below or so and clearly around , its contribution fills up the dip of the cross section, as seen in Fig. 1.
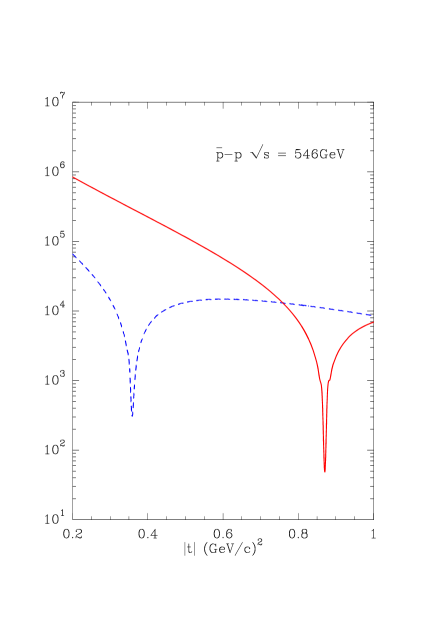
Concerning the behavior of the slope, the impact picture predicts a minimum around and this is in agreement with the slopes obtained by the UA4 experiment [5], in different intervals. The dotted curve corresponds to the variation of the slope obtained when the real part of the amplitude is set to zero and, as expected, it shoots up near the zero of the imaginary part.
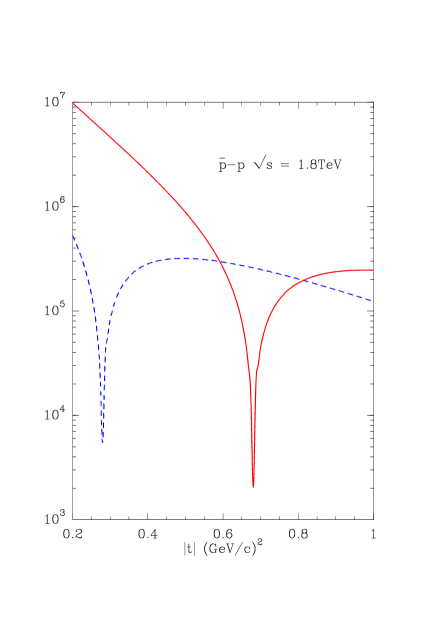
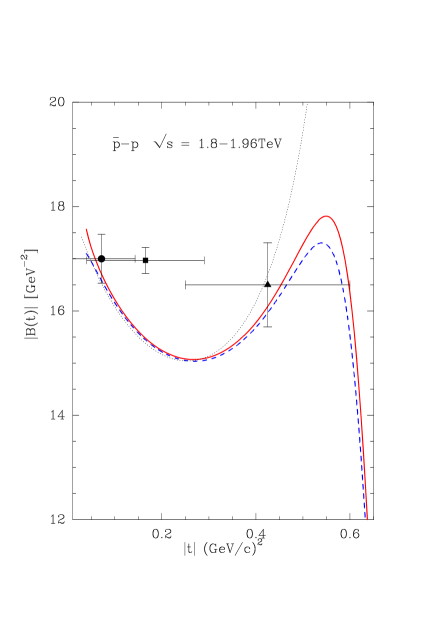
At Tevatron energies we show in Fig. 3 the absolute value of real and imaginary parts of the elastic scattering amplitude at . We observe that the zero of the real and imaginary parts have moved toward smaller values compared to the SPS energy, an effect which was predicted theoretically a long time ago and is responsible for the shrinkage of the diffraction peak. The behavior of the slope (solid curve) shows again a minimum around . A comparison with the experimental slopes measured by D [9], CDF [8] and E710 [7] agrees with our prediction, with no clear indication of a mininum, although the errors are large. At high energy the differential cross sections for and become close, the dashed curve represents the slope for the case, and here also we have plotted with a dotted curve the slope when the real part of the amplitude is set to zero.
3 Extraction of the slope from experimental measurements
In the previous section we have made an analysis by a combination of theoretical and experimental results, but we would like to examine the situation when only an experimental information is available, i.e., a model independent analysis. We will use the examples of the previous section. Let us make a preliminary remark: it is customary to determine the forward slope by a fit of the cross section containing an expression like or . It turns out that this approximation is only valid in a very narrow range of because as we have seen in the previous section, the slope cannot be treated as a constant over a domain up to the first minimum of the cross section 222A simple multiplication of the exponential by a polynomial in , or a Spline function, induces unwanted oscillations.. So we propose to define a numerical parametrization of the scattering amplitude in a limited range () taking into account the analytic properties of the amplitude as follows:
| (9) | |||||
| (10) | |||||
| (11) |
and the slope is given by
| (12) |
For UA4 making a fit of the differential cross section in the range we get for the parameters of Eq. (9-10) the values
| (13) |
| (14) |
with a /pt = 1.2, where the units are , for , , ,
, for , and /GeV, for and .
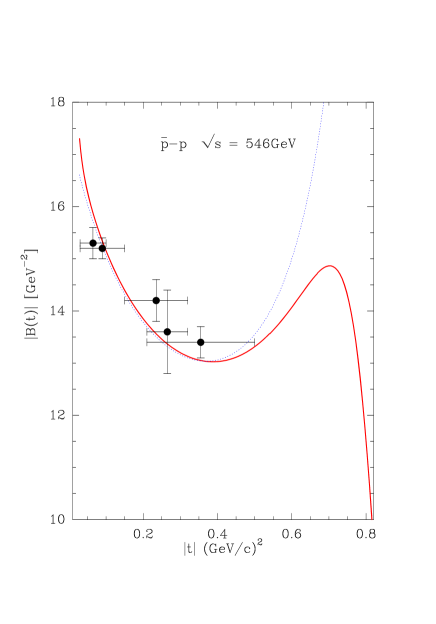
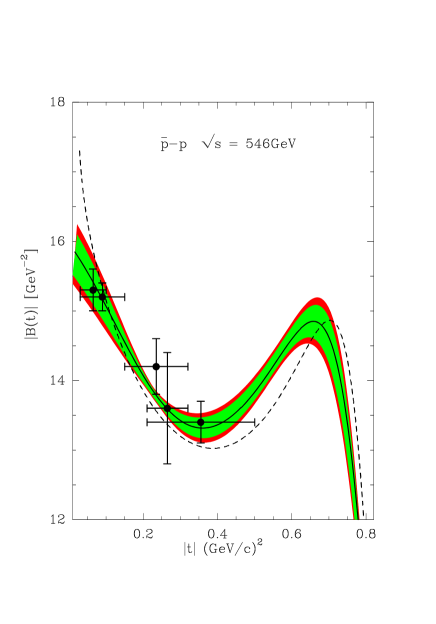
The high accuracy of the UA4
experiment allows a determination of the slope variation (solid line,
Fig. 4 left) in perfect agreement with the experimental values
obtained in [5]. We show the uncertainties which correspond to a confidence
level (CL) 68% inner bands and 95% outer bands.
We also show for comparison the BSW prediction (dashed line). The values
of the parameters in (14) are close to the zeros obtained
from the BSW approach (see Fig. 2). Since we are working
with a numerical parametrization the values of the other parameters in
(13) have no particular meaning.
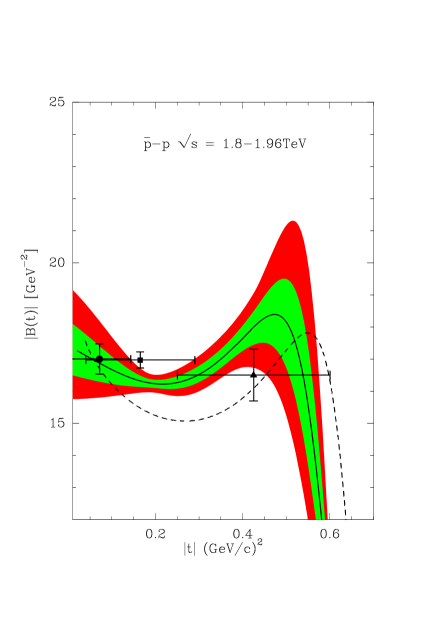
We have made the same type of analysis for Tevatron energies where we obtain from a fit of the experimental data from E710 [7], CDF [8], D [9], in the range the following values:
| (15) |
| (16) |
with a /pt = 0.75, it seems that we get a better fit compared to UA4, but this is due to larger errors. With these parameters the slope variation is shown in Fig. 4 right (solid line) with the corresponding experimental measurements, they are both compatible within the experimental errors, however some comments are in order.
| (TeV) | Real | Imaginary |
|---|---|---|
| 0.1 | 0.475 | 1.201 |
| 0.2 | 0.407 | 1.050 |
| 0.5 | 0.345 | 0.886 |
| 1.0 | 0.297 | 0.776 |
| 1.8 | 0.256 | 0.667 |
| 5.0 | 0.202 | 0.544 |
| 7.0 | 0.193 | 0.509 |
| 10.0 | 0.180 | 0.473 |
| 14.0 | 0.168 | 0.442 |
| 20.0 | 0.156 | 0.412 |
In the determination of the slope variation we have used the range , we notice that the CDF data are limited to , the D data start at and are preliminary, so both experiments do not cover the required range in . Only E710 has data points inside the domain of analysis, but as noticed in [8], this measurement seems to be less accurate. Altogether, we have obtained for the slope a variation less precise than in the UA4 case, this is also reflected by the discrepancy with the prediction made with the BSW approach. In Eqs. (9-10) we have introduced a zero in the amplitudes, in order to have a reference set we give in Table 1 the values of the zeros obtained in BSW for the real and imaginary of the nuclear amplitude for elastic as a function of .
4 The LHC energy domain
In view of experiments planed at LHC to measure the total cross section and elastic scattering by TOTEM [10] and ATLAS/ALFA [11], it is of interest to make some predictions on the slope behavior in this energy domain.
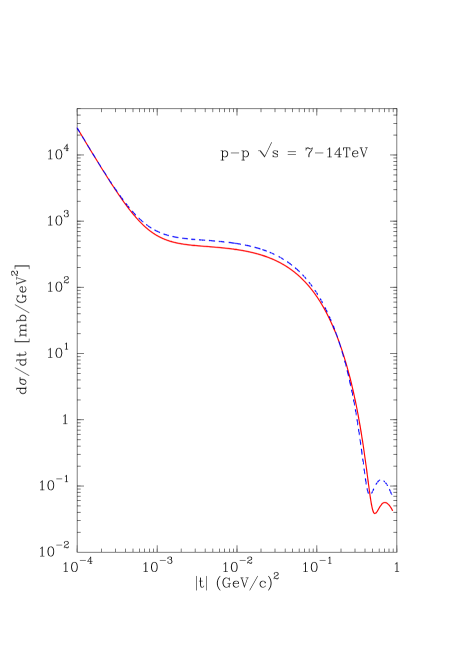
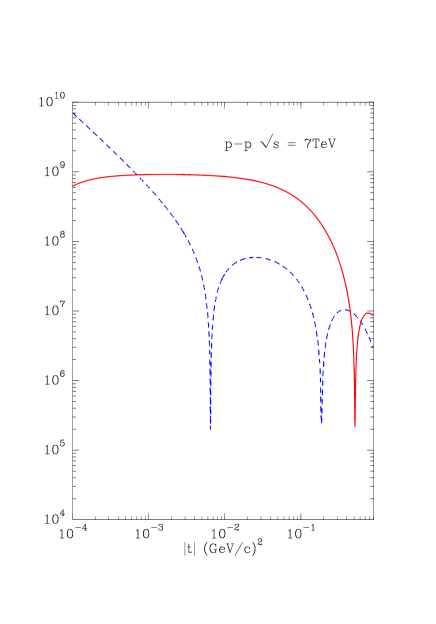
The differential cross sections for LHC energies 7-14TeV as a function of in a log-log scale are plotted in Fig. 5. We observe a continuous change of curvature above the Coulomb region up to the first minimum. Looking at the behavior of real and imaginary parts of the full amplitude at low , including the nuclear and Coulomb contributions, we notice that the real part has two zeros, one located at which comes from a destructive interference between the Coulomb and the nuclear part and a second one at due to the nuclear part alone. The nuclear imaginary part has one zero located at (see Fig. 6 left). Notice that for the reaction the interference is constructive so the first zero in the real part does not exist.
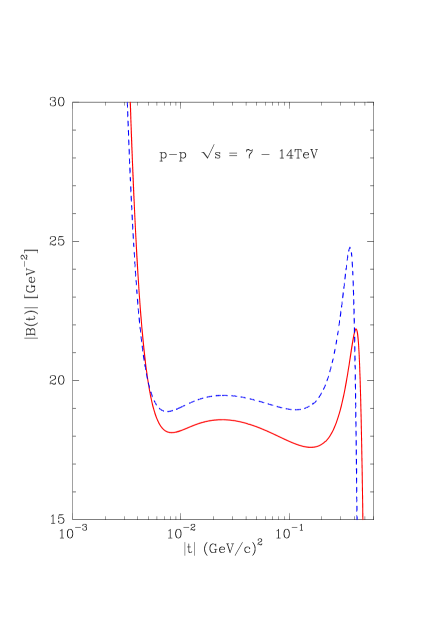
The effect of these zeros on the slope variation is illustrated in Fig. 6 right, for two energies solid curve, and 14TeV dashed curve, a minimum occurs for and . It is clear that precise mesurements will be required to put in evidence the oscillating structure of the slope. At lower energy the RHIC collider has a project to measure the differential cross at 500GeV, we expect for the slope a behavior similar to Fig. 6.
5 Concluding remarks
The measurement of the elastic differential cross section in and has revealed the existence of a dip at large starting at the ISR energies which is due to the dominance of the real part of the scattering amplitude over the imaginary part, this feature induces an important change in the slope of the cross section. For low momentum transfer it is supposed that the slope is constant and a form like is sufficient to describe the cross section behavior. However, the computation of the slope with theoretical models shows that this approximation is too crude and due to the existence of zeros in the real and imaginary parts the variation of the slope has a more complicated structure.
In an impact picture approach (BSW) we have computed the behavior of the slope in the forward region making evidence of a minimum followed by a maximum corresponding to the dip region. Although the measured slopes are compatible with our results taking into account the experimental errors, a more precise analysis of the data is needed to reveal the structure of the slope connected with the amplitude behavior. In order to compute the slope from experimental data alone, we have proposed a simple numerical parametrization of the amplitude that we have applied to the UA4 and Tevatron cross section measurements. The slope behavior so obtained reproduces the theorical one, but its determination depends strongly on the precision of the experimental data.
In view of the future experiments planed at LHC we have made predictions for two energies 7 and 14TeV. Our results show for the slope a more intricate behavior with momentum transfer, which can be put in evidence if very precise experimental data are obtained.
References
- [1] C. Bourrely, J. Soffer and T.T. Wu, Nucl. Phys. B 247, 15 (1984).
- [2] C. Bourrely, J. Soffer and T.T. Wu, Phys. Rev. D 19, 3249 (1979).
- [3] C. Bourrely, J. Soffer and T.T. Wu, Eur. Phys. J. C 28, 97 (2003).
- [4] UA4 Collaboration, R. Battiston et al., Phys Lett. B 127, 472 (1983).
- [5] UA4 Collaboration, M. Bozzo et al., Phys Lett. B 147, 385 (1984).
- [6] UA4 Collaboration, M. Bozzo et al., Phys Lett. B 155, 197 (1984).
- [7] E710 Collaboration, N.M. Amos et al., Phys Lett. B 247, 127 (1990); Phys. Rev. Lett. 68, 2433 (1992).
- [8] CDF Collaboration, F. Abe et al., Phys. Rev. D 50, 5518 (1993).
- [9] D Collaboration, D Note 6056-Conf (2010).
- [10] TOTEM Collaboration, http://totem.web.cern.ch/Totem/ .
- [11] ATLAS/ALFA Collaboration, P. Puzo, AIP Conf. Proc. 1105, 105 (2009).