Spectrophotometric variability of the magnetic CP star
56 Arietis in spectral region from 1950 to 3200 Å
Abstract
The spectrophotometric variability of the magnetic CP star 56 Arietis (56 Ari) in the ultraviolet spectral region from 1950 to 3200 Å is investigated. This study is based on the archival International Ultraviolet Explorer data obtained at different phases of the rotational cycle. The brightness of 56 Ari is not constant in the investigated wavelengths over the whole rotational period. The monochromatic light curves continuously change their shape with wavelength. This indicates that we do not observe a truly ’null wavelength region’ where the monochromatic light curve has a zero amplitude. Probably, an uneven surface distribution of silicon and iron mainly influences the flux redistribution from the far-UV to near-UV spectral regions, although additional sources of opacity may be involved. The redistribution of the flux at phase 0.25 is connected with the nonuniform distribution of silicon on the stellar surface of 56 Ari. On the other hand, the redistribution of the flux at phase 0.65 is quite complex, because there are additional blocking and redistribution of the flux by iron lines in the near-UV spectral region.
Keywords stars: chemically peculiar – stars: individual: 56 Ari – stars: variables: other.
1 Introduction
The magnetic Chemically Peculiar (mCP) star 56 Ari (SX Ari, HD 19832, HR 954) belongs to the Si-group. The star, classified as B8 Si by Renson et al. (1991), is a periodic spectrum (Deutsch 1947), photometric (Provin 1953) and magnetic (Borra & Landstreet 1980) variable, with a relatively short period of 0.728 days. The light variability can be generally expected to be explained by the inhomogeneous abundance of several chemical elements which is observed in the atmosphere of 56 Ari. Jamar (1978) had investigated the ultraviolet spectral variations of six CP Si stars, including 56 Ari, by means of observations obtained from the Sky Survey Telescope (S2/68) on the TD1 satellite. In the case of 56 Ari, the author established that the light variability in the short wavelength region is clearly in phase opposition with the remaining part of the spectrum with a ‘null wavelength region‘ at 1600 Å. But this conclusion is naturally only valid in wide band photometry because the spectra intercrosses many times at other wavelengths (see Fig 1 of Jamar 1978). The author has noted that it is impossible to say if this effect is real or only the result of a poor signal-to-noise ratio. Stepień & Czechowski (1993) have analyzed the spectrophotometric behavior of this star, using the International Ultraviolet Explorer (IUE) data. Unfortunately, the authors restricted the investigation of the long-wavelength spectra from the IUE data only in the three spectral regions at 2100, 2500 and 3000 Å. Besides, the authors have called the light curves ”monochromatic”, although they were determined by averaging the fluxes over intervals [-10, +10] Å for given .
Recently, Sokolov (2006, hereinafter Paper I) analyzed the spectrophotometric variability of 56 Ari in the far-ultraviolet (far-UV) spectral region from 1150 to 1980 Å. The author established that the brightness of 56 Ari is not constant in the investigated wavelengths over the whole rotational period, although, the double-wave light variations in the far-UV spectral region are in antiphase to the visual spectral region. Moreover, the author involved the additional sources of variable opacity in order to explain the existence of the second minimum at phase 0.65 of the monochromatic light curves. He concluded that the inhomogeneous surface distribution of iron seems to have influence on the light variations in the far-UV spectral region. Perhaps the most interesting and controversial aspect of 56 Ari is its spectrophotometric variability in the near ultraviolet (near-UV) spectral region from 1950 to 3200 Å. In this spectral region, the photometric level is strongly influenced by the multiplets of iron lines. These multiplets are presented in the spectra of CP stars (Jamar 1978, and references therein).
In this paper, the low-dispersion spectra of mCP star 56 Ari are analyzed in detail using long-wavelength data from the final IUE archive. Moreover, the variability of selected features and spectral lines in this spectral region can be established.
2 Observational data
2.1 IUE spectra
Three series of observations of 56 Ari obtained with Long Wavelength Redundant (LWR) and Long Wavelength Prime (LWP) cameras were retrieved from the final IUE archive.
-
1.
The first one contains 18 LWR spectra obtained in December 1981.
-
2.
The second one contains 8 LWP spectra obtained in February 1984.
-
3.
The third one contains 7 LWP spectra obtained in August and September 1990.
In all cases, the spectra were obtained in the low-dispersion mode through the large aperture (9.522). The spectra were extracted from IUE Newly Extracted Spectra (INES) Catalog in which the flux in absolute units (cgs) is given every 2.67 Å for LWR and LWP cameras. The INES data from IUE satellite are available from the INES Principal Center website http://sdc.laeff.inta.es/ines/.
The INES catalog contains a few spectra of 56 Ari obtained with the small aperture. Unfortunately, there are systematic differences in the LWR and LWP spectra with large and small apertures, because only point-source large aperture spectra were used for the absolute flux calibration (González-Riestra et al. 2001). In order to exclude these systematic differences, only IUE spectra obtained with a large aperture were used in our study. Moreover, the signal-to-noise ratio of the last series observations is very poor, because the exposure time is very small, and these spectra appear unsuitable for our purpose. Additionally, the spectrum LWP 02833 was excluded, because the exposure time is only 4.383 sec. Finally, we analyze 18 LWR and 7 LWP spectra, distributed quite smoothly over the rotational period. In Table 1, each spectrum is presented by its number, exposure time, Julian date of the observations and its corresponding phase obtained using equation (1).
| images | Exp. Time | Julian date | Phase |
|---|---|---|---|
| (sec.) | 2,440,000+ | ||
| LWR 12194∗ | 19.190 | 4962.2839 | 0.320 |
| LWR 12195∗ | 19.190 | 4962.3300 | 0.384 |
| LWR 12196∗ | 19.190 | 4962.3754 | 0.446 |
| LWR 12197∗ | 19.190 | 4962.4212 | 0.509 |
| LWR 12198∗ | 19.190 | 4962.4668 | 0.572 |
| LWR 12199∗ | 19.190 | 4962.5124 | 0.634 |
| LWR 12200∗ | 19.190 | 4962.5589 | 0.698 |
| LWR 12201∗ | 19.190 | 4962.6129 | 0.772 |
| LWR 12202∗ | 19.190 | 4962.6566 | 0.832 |
| LWR 12203∗ | 19.190 | 4962.7073 | 0.902 |
| LWR 12204∗ | 19.190 | 4962.7505 | 0.961 |
| LWR 12205∗ | 19.190 | 4962.7973 | 0.026 |
| LWR 12206∗ | 19.190 | 4962.8418 | 0.087 |
| LWR 12207∗ | 19.190 | 4962.8859 | 0.147 |
| LWR 12213∗ | 19.190 | 4963.6250 | 0.163 |
| LWR 12214∗ | 19.190 | 4963.6757 | 0.232 |
| LWR 12215∗ | 19.190 | 4963.7199 | 0.293 |
| LWR 12216∗ | 19.190 | 4963.7657 | 0.356 |
| LWP 02754∗ | 18.586 | 5740.4630 | 0.392 |
| LWP 02755∗ | 18.586 | 5740.5441 | 0.503 |
| LWP 02756∗ | 18.586 | 5740.6188 | 0.606 |
| LWP 02828∗ | 18.586 | 5752.4030 | 0.795 |
| LWP 02829∗ | 18.586 | 5752.5171 | 0.952 |
| LWP 02831∗ | 18.586 | 5753.3655 | 0.117 |
| LWP 02832∗ | 18.586 | 5753.4398 | 0.219 |
| LWP 02833 | 4.383 | 5753.5257 | 0.337 |
| LWP 18613 | 4.383 | 8122.5789 | 0.970 |
| LWP 18614 | 3.973 | 8122.6225 | 0.029 |
| LWP 18615 | 2.744 | 8122.7426 | 0.194 |
| LWP 18616 | 3.563 | 8122.8206 | 0.301 |
| LWP 18617 | 3.563 | 8122.8714 | 0.371 |
| LWP 18847 | 3.563 | 8156.7485 | 0.912 |
| LWP 18849 | 3.563 | 8156.9708 | 0.217 |
2.2 The period variations of 56 Ari
Some mCP stars, including 56 Ari, displayed an increase of their rotational periods (Mikulasek et al. 2008). The rotational period of 56 Ari has been studied by various investigators over 48 yr (see e.g. Adelman et al. 2001). Musielok (1988) had analyzed and photometry for the interval JD 2434322-2447176, which covers over 17 660 rotational cycles. He found an increase in the rotational period of 4 s per 100 yr from an analysis of the photometric data. Possibly, for this star the period’s increase is also accompanied by changes of its light curves (Adelman & Fried 1993; Žižňovský et al. 2000). The authors expected the observed period changes because of free body precession (Shore & Adelman 1976). Adelman et al. (2001) had studied all available photometric data for this star from 1952 to 2000. They confirmed the increase in the rotational period, but with a rate of about 2 s per 100 yr. The authors pointed out that there is evidence for a second period of about 5 yr attributed to the precession of the axis of rotation.
In Paper I the phases of the monochromatic light curves in the far-UV
were computed by using the ephemeris with constant period obtained by
Adelman & Fried (1993) and linearly changing period obtained by Adelman et al. (2001).
In most cases, the monochromatic light curves in the far-UV exhibit the maximum
of the flux at phase 0.0 with the ephemeris of Adelman & Fried (1993):
| (1) |
With this ephemeris, the monochromatic light curves of 56 Ari show, as a rule, two maxima and two minima in the far-UV spectral region (see Fig. 1 of Paper I). Based on this fact, in our investigation the phases were computed using equation (1).
3 Data analysis
As well as for short-wavelength IUE monochromatic light curves, we used the linearized least squares method. An attempt was made to describe the light curves in quantitative way by adjusting a Fourier series. This method is described by North (1987) and assumes that the shape of the curve has the form:
| (2) |
where is a flux for the given , = - and = 2/. The and are zero epoch and rotational period of the ephemeris, respectively and is the total number of harmonics. The coefficients of the fitted curves are defining the average energy distribution over the cycle of the variability. From several scans distributed over the rotational period, it is possible to compute the light curves at different wavelengths. In all wavelengths the data could be fitted by Fourier series limited to =3, that is, by the fundamental frequency and its first two harmonics. This procedure can be partially accounted by considering that within the accuracy of the measurements a cosine wave and its first two harmonics appear to be generally adequate to describe the monochromatic light curves in the far-UV (see Paper I). Additionally, the least squares fit with three-frequency cosine function was applied to the light curves obtained by Fried & Adelman (2003). The computations showed that within the accuracy of the measurements it is also true for the light variations in the visible region.
The least squares fit was applied to separate long-wavelength IUE monochromatic light curves. An error analysis showed that the errors in the coefficients and of the fitted curves are not more 0.05 and 0.07 in the units , respectively. Although, the standard deviations of the residual scatter around the fitted curves () varies from 0.03 to 0.2 in the investigated wavelengths. The maximal errors of the coefficients and as well as in are in the blue and red parts of IUE spectrum. Probably, it is connected with uncertainties of the fluxes in both ends of the spectrum as presented in INES database. Thus we limited our investigation to the wavelength region between 1950 to 3200 Å. In order to minimize the uncertainties in the coefficients of the fitted curves the fluxes were determined by averaging three nearest fluxes for a given :
| (3) |
where is equal 2.669 Å (see Sect. 2).
As far as the errors in are concerned, we computed them by taking into account the the errors in the fluxes as presented in INES , according to the standard propagation theory of errors.
3.1 Identification of the observed depressions and features in the spectrum of 56 Ari
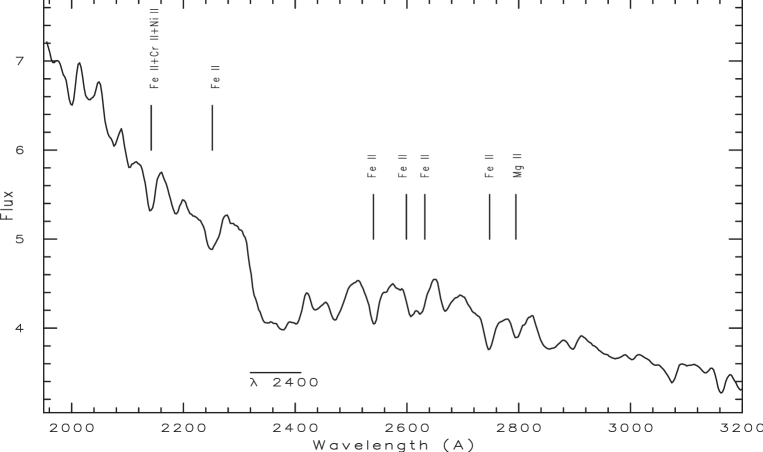
Figure 1 displays the average energy distribution () of 56 Ari over the cycle of the variability in the spectral region from 1950 to 3200 Å. First of all, we need to identify which elements are responsible for depressions centered at 2140, 2250, 2540, 2607, 2624, 2747 and 2800 Å. In order to identify which element is responsible for these depressions the synthetic single-element spectra were calculated for Si, Fe, Ni, Cr, Co, Mg and Mn with Piskunov (1992) program synth. Typically, the lines of these elements dominate at the selected spectral regions. Also, the synthetic spectra with all elements included were computed. The information about spectral lines were taken from the Vienna Atomic Line Database (VALD-2, Kupka et al. 1999). The atmospheric parameters were estimated as a average from available sources. Sokolov (1998) estimated the value of = 12460 K from the slope of the energy distribution in the Balmer continuum near the Balmer jump. Adelman & Rayle (2000) determined the values of = 12850 K, log = 4.0, and = 2 km from the fit of the energy distribution in visual spectral region with the prediction of the metal-rich models. Recently, new determinations of of 23 mCP stars were obtained by (2008) from a fit of metal enhanced model atmospheres to the observed spectral energy distribution from UV to red. In the case of 56 Ari, they determined the value of = 12250 K. On the other hand, the temperatures estimated separately at UV and visual spectral regions are equal 12250 K and 12750 K, respectively ( 2008). The temperature of 56 Ari found via photometry is equal to 12600 K (Adelman & Rayle 2000). The model computation was performed with = 12500 K, log = 4.0 and = 2 km . It should be noted that the program synth used the grids of ATLAS9 model atmospheres (http://kurucz.harvard.edu/grids.html). But, the VALD-2 allows one to select the spectral lines for models with abundances significantly different from the solar or scaled solar composition. The best agreement between IUE high resolution spectrum of 56 Ari at phase 0.027 (SWP 39680) in spectral region of the depression at 1775 Å and the synthetic spectrum with all elements is reached if the elements have solar scaled composition [M/H]=0 except for Al and Si, their abundances were reduced to log / of -7.0 and -3.5, respectively (see Paper I). Note that the chemical composition is not a very peculiar one, because the energy distribution at phase 0.0 is close to the normal energy distribution of 56 Ari. Our computations for depressions centered at 2140, 2250, 2540, 2607, 2624, 2747 and 2800 Å were performed with same peculiar chemical composition. Additionally, the synthetic spectra were broadened according to a projected rotational velocity of 96.0 km (Royer et al. 2002) with program ROTATE written for PC by Piskunov (1992).
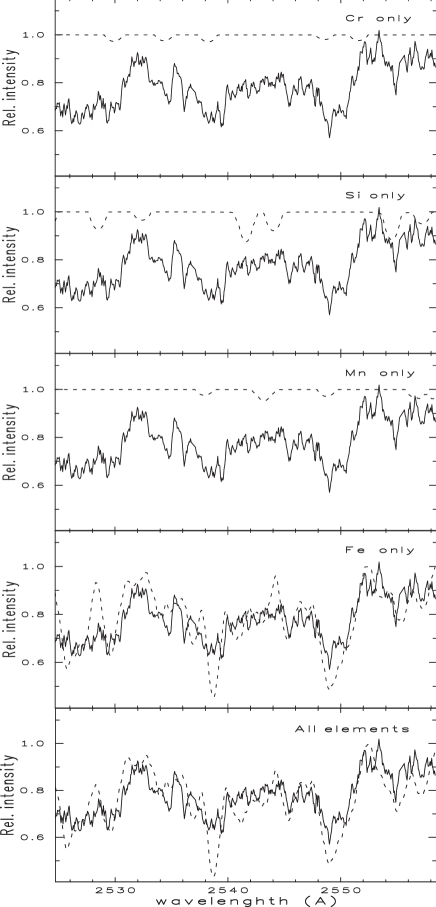
The computed synthetic spectra showed that Fe(II) appears as the main absorber at 2250, 2540, 2607, 2624 and 2747 Å. For example, the comparison of the IUE high-dispersion spectrum of 56 Ari at phase 0.072 (LWP 18848) with the synthetic spectrum including all elements as well as those including lines from only one element shows that the iron is responsible for depression centered at 2540 Å, as illustrated by Fig. 2. Some discrepancy between the synthetic spectrum and the observed spectrum can be explained by low values of a signal-to-noise ratio for the spectrum obtained in the high-dispersion mode. Although, a wrong continuum assumed can also be caused by this discrepancy. The same comparison of the IUE high-dispersion spectrum with the synthetic spectra showed that mainly Fe, Cr and Ni are responsible for depression at 2140 Å. It is well known, that Mg ii resonance lines at 2795, 2798 and 2803 Å are responsible for depression at 2800 Å. Our model calculation fully supports this result. Prominent depressions of the flux are indicated on Fig. 1 with their identification.
The large feature at 2350–2400 Å which are strongly enhanced in the spectrum of CP stars, are well seen in spectrum of 56 Ari. The lines of iron peak elements have a particularly important contribution to opacity at 2350–2400 Å. Adelman et al. (1993) had given strong arguments supporting the idea that a large number the lines of iron can explain the feature at 2350–2400 Å. Many CP stars have here a very pronounced depression compared to normal stars (Stepień & Czechowski 1993).
3.2 The monochromatic light variations in the pseudo-continuum
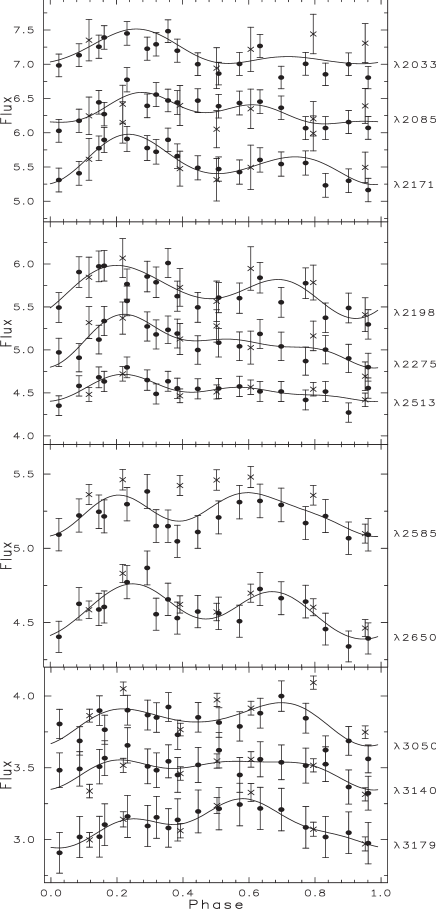
First, it is necessary to fix the continuum in the low dispersion IUE data. This is very difficult in the near-UV due to the lines crowding. Nevertheless, one can find some high flux points located at the same wavelengths in several spectra of 56 Ari. It should be noted that such choice of the continuum might be a ’pseudo-continuum’. However, there is no chance to reach the true continuum, if it occurs at high flux points. From several scans distributed over the rotational period one can produce the light curves in different wavelengths. The light curves discussed below will be called ”monochromatic”, although they were determined by averaging three nearest fluxes for a given . Several monochromatic light curves in the ’pseudo-continuum’ at different wavelengths were formed. The examples of light curves together with the fitted three-frequency cosine curves are shown in Fig. 3. It should be noted that the vertical scales differ for each part of the figure. In order to exclude overlapping of some curves the vertical shift on the constant value was used. In this way, the curves at 2275 and 3179 Å were shifted down to the values of -0.25 and -0.4 , respectively. On the other hand, the curves at 2033, 2198, 2585 and 3050 Å were shifted up to the values of +0.75, +0.25, +0.75 and +0.25 , respectively. Unfortunately, there are the systematical disagreements between LWR and LWP cameras for some spectra and for some wavelengths (e.g. at 2585 Å), although the fitted curves adequately describe the flux variations.
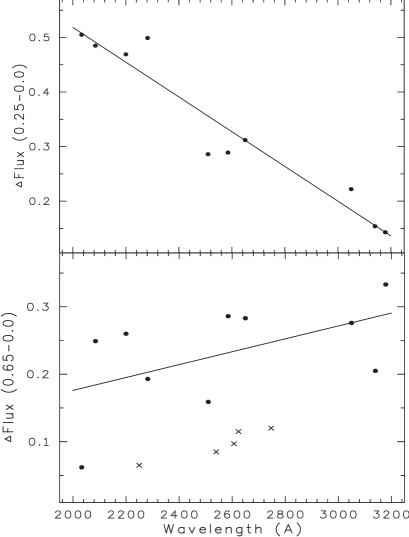
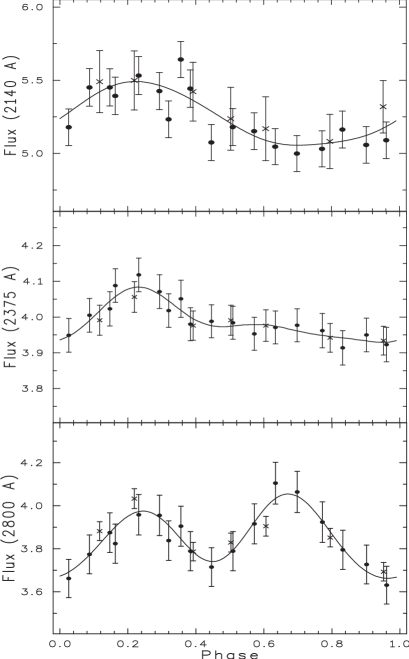
The monochromatic light curves in the ’pseudo-continuum’ of 56 Ari in the near-UV spectral region from 1950 to 3200 Å have a similar shape: the primary minimum at phase 0.0, a maximum at phase 0.25, while a secondary minimum and maximum around the phases 0.4-0.5 and 0.6-0.7, respectively. The double-wave light variations in this spectral region are in antiphase to the variations in the far-UV spectral region (see Paper I), but in phase to the variations in the visual spectral region (Adelman & Fried 1993). The amplitude of the maximum at phase 0.25 quickly decreases with increasing wavelength. The second maximum around the phases 0.6-0.7 increases with increasing wavelength, as illustrated by Fig. 4. Thus, the differences of the fluxes at phases 0.25 and 0.0 decrease from 0.5 at 2000 Å to 0.15 at 3200 Å. On the other hand, the differences of the fluxes at phases 0.65 and 0.0 increase only from 0.17 at 2000 Å to 0.3 at 3200 Å. It should be noted, that the standard deviation of the residual scatter around the fitted curves are equal 0.041 and 0.071 in the units on the top and on the bottom panels of Fig. 4, respectively. Mainly the silicon is responsible for the redistribution of the flux at phase 0.25 (see Paper I). On the other hand, in order to explain such behavior of the monochromatic light curves at phase 0.65 we need to involve other element than silicon. First of all, we should expect correlation between the light variations in the ’pseudo-continuum’ and the blocking of the flux by Fe(II) lines, because mainly iron is responsible for the second minimum of the light curves at phase 0.65 in the far-UV spectral region (see Paper I).
3.3 Variation of spectral lines
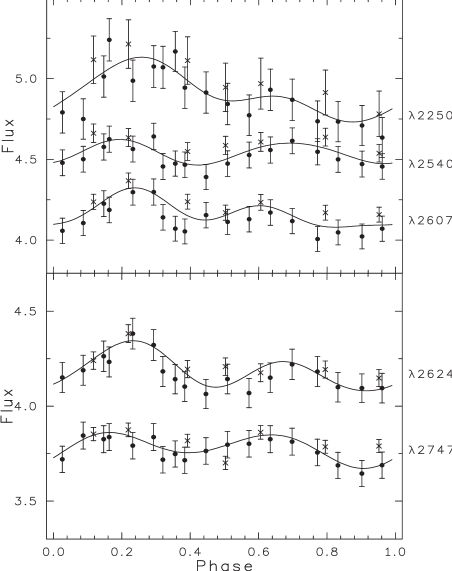
The measurement of the equivalent width of a line is one of the best way to estimate the total amount of energy subtracted from the continuum by an absorption line. Unfortunately, the equivalent width depends strongly upon the knowledge of the intensity of the continuum. According our calculations of the synthetic spectrum we selected the regions centered at 2250, 2540, 2607, 2624 and 2747 Å where Fe(II) appears as the main absorber. Moreover, we checked stability of the fluxes in the cores of these regions and found scattering of the points, especially at phases between 0.5 and 1.0.
In order to measure the absorption in the cores of Fe(II) lines the spectra were processed using the spectral reduction software spe developed by S. Sergeev at the Crimean Astrophysical Observatory (CrAO). The program allows measuring the mean intensity of the flux and theirs errors in any selected rectangular spectral region. In the all cases, these spectral regions have been chosen 10 Å wide and centered at 2250, 2540, 2607, 2624 and 2747 Å. Figure 5 exhibits the variations of the mean intensity and the error of the flux in the cores of Fe(II) lines versus the rotational phase. The solid lines are the least squares fits by three-frequency cosine functions. In order to avoid overlapping, the light curve at 2540 Å was shifted by the value of +0.5 . It should be noted that the vertical scales differ for each part of the figure. As can be seen in the graphs of Fig. 5, all light curves in the cores of Fe(II) lines show the primary minimum at phase 0.0, a maximum at phase 0.25, with a secondary minimum and maximum around the phases 0.5 and 0.65, respectively. The maximal amplitudes of the flux at phases 0.25 and 0.65 show the same behavior as the monochromatic light curves in the ’pseudo-continuum’ of 56 Ari. Although, the differences of the fluxes at phases 0.65 and 0.0 in the cores of Fe(II) lines are less than in the near ’pseudo-continuum’ of 56 Ari (see Fig. 4). Probably, the additional blocking of the flux by many Fe(II) lines occur in these spectral regions.
4 Discussion
For the first time, Peterson (1970) showed that the enhanced ultraviolet opacities produces an opposite variation of the flux distribution in the visual and the UV spectral regions. Later Panek (1982) noted that flux redistribution by no single element can explain the light variations of 56 Ari in the far-UV spectral region. Stepień & Czechowski (1993) have investigated the influence of silicon, helium and iron on the monochromatic light variations in the spectrum of 56 Ari. The authors noted that more quantitative comparison of the light variations with the variations of Si(II) 4128 Å shows some inconsistency. They also concluded that the variations of helium seem to have very little influence on the light variations, and the assumed strictness in phase variation of iron, as observations suggest, is probably an over-interpretation of the existing data.
Most probably that the redistribution of the flux from the far-UV to near-UV spectral regions at phase 0.25 is connected with nonuniform distribution of silicon on stellar surface of 56 Ari (see Paper I). On the other hand, the redistribution of the flux at phase 0.65 is quite complex, because there are the additional blocking and redistribution of the flux by iron lines in the near-UV spectral region. Thus, for example, the differences of the fluxes at phases 0.65 and 0.0 in the cores of Fe(II) lines are less than in the near ’pseudo-continuum’ of 56 Ari (see Fig. 4). Moreover, the second maximum at phase 0.65 disappears in the large feature at 2350-2400 Å where a large number of iron lines could explain this feature (Adelman et al. 1993). Such behavior of the flux in the cores of Fe(II) lines and in the large feature at 2350-2400 Å mainly supports that iron is responsible for the redistribution of the flux at phase 0.65. On the other hand, the second maximum is replaced by a minimum in the core of the depression at 2140 Å, as illustrated by Fig. 6. Probably, the additional blocking of the flux by chromium or/and nickel is responsible for such behavior of the flux at 2140 Å. It should be noted that according to the VALD-2 database in the UV spectral region the number of the iron lines is significantly larger than the lines of the other elements.
Probably, an uneven surface distribution of silicon and iron mainly influence on the flux redistribution in the spectrum of 56 Ari, although an additional sources of opacity can be involved. It is not new that silicon and iron influence on the flux redistribution in the spectra of CP stars. Khan & Shulyak (2007) have studied the effects of individual abundance patterns on the model atmospheres of CP stars. They concluded that the group of elements which produce large changes in the model atmosphere structure and energy distribution consists of Si, Fe, Cr. Recently, Krtička et al. (2009) have simulated the light variability of the star HR 7224 using the observed surface distribution of silicon and iron. They have shown that the silicon bound-free transitions and iron bound-bound transitions provide the main contribution to the flux redistribution, although an additional source of opacity is needed.
It is very interesting to compare our result with the chemical elements distribution on the surface of 56 Ari obtained in the optical spectral region. Unfortunately, the only silicon distribution on the surface of 56 Ari was obtained in the optical spectral region by Ryabchikova (2003). A comparison between the silicon distribution on the surface obtained from optical spectral region and the results obtained at this paper shows some inconsistency. The Doppler imaging technique gives a few silicon spots on the surface of 56 Ari (see Fig. 1 of Ryabchikova 2003) while our result is that the silicon, mainly, concentrate at phase 0.25 (Paper I). Note that the accurate continuum normalization is crucial for the analysis of the spectral lines in the spectra of CP stars. Moreover, the impossibility of fitting the wing and the core of some strong spectral lines with the same abundance can be observed at the visual spectral region for CP stars (Ryabchikova 2003). On the other hand, the light variability can not be easily deduced from the surface distribution without some calculation.
The vertically dependent abundance stratification in chemically peculiar stars are suggested by many authors (e.g., Ryabchikova 2008, and references therein). This effect may influence our results, because the effective depth at which continuum forms at 2000 Å can differs from the effective depth at which continuum forms at 3200 Å. The vertical abundance stratification itself can also influence the emergent continuum flux. For silicon-rich stars with an effective temperature of about 10000-15000 K, hydrogen becomes the major source of continuum opacity in the near-UV spectral region, because silicon continuum opacity is significant in the spectral region with 1600 Å (Lanz et al. 1996). As a result, the maximum amplitude at phase 0.25 is decreasing with increase wavelength (see Fig. 4). Probably, the maximum concentration of silicon is in the inner layers of the atmosphere of 56 Ari. On the other hand, behavior of the maximum amplitude at phase 0.65 is quite complex, because there are many iron lines in the near-UV spectral region. The lines of iron additionally is blocking the flux at phase 0.65 and, as a result, we see significant scattering of the points on the bottom panel of Fig. 4. Although, the maximum amplitude at phase 0.65 is increasing with decrease in wavelength. Probably, the maximum concentration of iron is in the outer layers of the atmosphere of 56 Ari. It should be noted that the maximum amplitudes at phases 0.25 and 0.65 is showing the same behavior in the optical spectral region. For example, the maximum amplitude of the flux at phase 0.65 is in the Balmer continuum and the maximum amplitude of the flux at phase 0.25 is in the Paschen continuum for and filters of Strömgren photometric system, respectively (Adelman & Fried 1993).
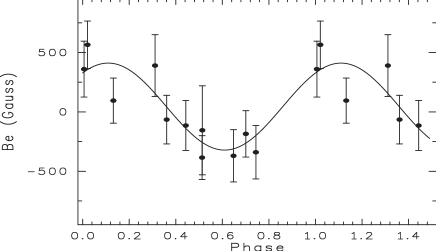
There is another possibility to explain the flux redistribution from the UV spectral region to the visual spectral region. Kochukhov et al. (2005), Khan & Shulyak (2006a) and Khan & Shulyak (2006b) investigated the influence of the polarized radiative transfer and magnetic line blanketing on the energy distribution, atmospheric structure and photometric colors. They have shown that the most conspicuous signature of the magnetically modified line blanketing is a flux deficiency in the UV spectral region and the respective flux excess in the visual spectral region. In literature there are the series of the magnetic field measurements obtained by Borra & Landstreet (1980) for the star 56 Ari. In order to check a possible influence of the magnetic field on the flux deficiency in the UV spectral region we computed the phase diagram of the magnetic field variations using the equation (1), as illustrated by Fig. 7. One can see that the flux maximum at far-UV (Paper I) and the flux minimum at near-UV (Fig. 3) occurs about a tenth of a cycle before positive magnetic extremum. Also, it is impossible to explain the change shape of the light curves in Balmer and Paschen continua ( and filters of Strömgren photometric system, respectively) by the magnetic field variation of 56 Ari. The same result was obtained by Bohlender et al. (1993) at least for four stars for which extremums of the photometric or spectroscopic variations do not coincide with magnetic extremums. Khan & Shulyak (2006b) have not found any significant changes in model atmosphere structure, photometric indices, the energy distribution and profiles of hydrogen Balmer lines that depend on the magnetic field inclination angle. Note that in the case of 56 Ari the magnetic field is too weak to be the cause for any considerable light variations (Khan & Shulyak 2006a). Additionally, the discovery of mercury spots on the surface of Andromedae demonstrate that magnetic field is not the only responsible for creating and supporting surface structures in CP stars (Adelman et al. 2002).
5 Conclusions
The archival IUE spectrophotometric observations of 56 Ari had permited to analyze the light variations in the near-UV spectral region from 1950 Å to 3200 Å and to compare them with the variations in the cores of the spectral features and lines. Although the double-wave light variations in this spectral region are in anti-phase to those in the far-UV region, the spectrum of 56 Ari is variable in the wavelength interval from 1950 Å to 3200 Å over the whole rotational period. The monochromatic light curves continuously are changing their shape with wavelength. The exception is the core of the depression at 2140 Å where the second maximum at phase 0.65 is replaced by a minimum and also the large feature at 2350-2400 Å where the second maximum disappears. This indicates that we do not observe a truly ’null wavelength region’ where the monochromatic light curve has a zero amplitude. In the Paper I we concluded that the variations of silicon and iron seem to have influence on the light variations in the far-UV spectral region. The present investigation mainly supports our previous result, although an additional sources of opacity can be involved.
Acknowledgements
I would like to thank the referee whose criticism and offers which have helped me the better presentation of the paper. This research has made by using of Newly Extracted Spectra (INES) data from the satellite.
References
- Adelman & Fried (1993) Adelman, S.J., & Fried, R.: Astron. J. 105, 1103 (1993)
- Adelman et al. (1993) Adelman, S.J., Cowley, C.R., Leckrone, D.S., Roby, S.W., & Wahlgren, G.M.: Astrophys. J. 419, 276 (1993)
- Adelman & Rayle (2000) Adelman, S.J., & Rayle, K.E.: Astron. Astrophys. 355, 308 (2000)
- Adelman et al. (2001) Adelman, S.J., Malanushenko, V., Ryabchikova, T.A., & Savanov, I.: Astron. Astrophys. 375, 982 (2001)
- Adelman et al. (2002) Adelman, S.J., Gulliver, A.F., Kochukhov, O.P., & Ryabchi- kova, T.A.: Astrophys. J. 575, 449 (2002)
- Bohlender et al. (1993) Bohlender, D.A., Landstreet, J.D., & Thompson, I.B.: Astron. Astrophys. 269, 355 (1993)
- Borra & Landstreet (1980) Borra, E.F., & Landstreet, J.D.: Astrophys. J. Suppl. Ser. 42, 421 (1980)
- Deutsch (1947) Deutsch, A.J.: Astrophys. J. 105, 283 (1947)
- Fried & Adelman (2003) Fried, R.E., & Adelman, S.J.: J. Astron. Data 9, 2 (2003)
- González-Riestra et al. (2001) González-Riestra, R., Cassatella, A., & Wamsteker, W.: Astron. Astrophys. 373, 730 (2001)
- Jamar (1978) Jamar, C.: Astron. Astrophys. 70, 379 (1978)
- Khan & Shulyak (2006a) Khan, S.A., & Shulyak, D.V.: Astron. Astrophys. 448, 1153 (2006a)
- Khan & Shulyak (2006b) Khan, S.A., & Shulyak, D.V.: Astron. Astrophys. 454, 933 (2006b)
- Khan & Shulyak (2007) Khan, S.A., & Shulyak, D.V.: Astron. Astrophys. 469, 1083 (2007)
- Kochukhov et al. (2005) Kochukhov, O., Khan, S., & Shulyak, D.: Astron. Astrophys. 433, 671 (2005)
- Krtička et al. (2009) Krtička, J., et al.: Astron. Astrophys. 499, 567 (2009)
- Kupka et al. (1999) Kupka, F., Piskunov, N., Ryabchikova, T.A., Stempels, H.C., & Weiss, W.W.: Astron. Astrophys. Suppl. Ser.138, 119 (1999)
- Lanz et al. (1996) Lanz, T., Artru, M.-C., Le Dourneuf, M., & Hubeny, I.: Astron. Astrophys. 309, 218 (1996)
- (19) Lipski, L., & Stepień, K.: Mon. Not. R. Astron. Soc. 385, 481 (2008)
- Musielok (1988) Musielok, B.: Inf. Bull. Variable stars 3257, 1 (1988)
- Mikulasek et al. (2008) Mikulasek, Z., et al.: In: XVI. Ulusal astronomi kongresi, V. Ulusal ogrenci astronomi kongresi. Canakkale Onsekiz Mart Universitesi Yamlari, Canakkale, Turecko, pp. 908-920 (2008). ISBN 975-8100-33-5
- North (1987) North, P.: Astron. Astrophys. Suppl. Ser. 69, 371 (1987)
- Panek (1982) Panek, R.J.: Bull. Am. Astron. Soc., 14, 876 (1982)
- Peterson (1970) Peterson, D.M.: Astrophys. J. 161, 685 (1970)
- Piskunov (1992) Piskunov, N.E.: In: Glagolevskij, Yu.V., Romanyuk, I.I. (eds.) Proceesing of International Meeting, ”Stellar Magnetism”, p. 92. Nauka, St. Petersburg (1992)
- Provin (1953) Provin S.S.: Astrophys. J. 118, 281 (1953)
- Renson et al. (1991) Renson, P., Gerbaldi, M., & Catalano, F.A.: Astron. Astrophys. Suppl. Ser. 89, 429 (1991)
- Royer et al. (2002) Royer, F., Grenier, S., Baylac, M.-O., Gómez, A.E., & Zorec, J.: Astron. Astrophys. 393, 897 (2002)
- Ryabchikova (2003) Ryabchikova, T.: In: Balona, L.A., Henrichs, H.F., Medupe, R. (eds.) International Conference on magnetic fields in O, B and A stars. ASP Conference Series, vol. 305, p. 283. ASP, San Francisco (2003)
- Ryabchikova (2008) Ryabchikova, T.: Cont. Ast. Obs. Skalnaté Pleso 38, 257 (2008)
- Shore & Adelman (1976) Shore, S.N., & Adelman, S.J.: Astrophys. J. 209, 816 (1976)
- Sokolov (1998) Sokolov, N.A.: Astron. Astrophys. Suppl. Ser. 130, 215 (1998)
- Sokolov (2006) Sokolov, N.A.: Mon. Not. R. Astron. Soc. 373, 666 (2006) (Paper I)
- Stepień & Czechowski (1993) Stepień, K., & Czechowski, W.: Astron. Astrophys. 268, 187 (1993)
- Žižňovský et al. (2000) Žižnovský, J., Schwartz, P., & Zverko, J.: Inf. Bull. Variable Stars 4835, 1 (2002)