Solvation Effects in Phase Transitions in Soft Matter
Abstract
Phase transitions in polar binary mixtures
can be drastically altered
even by a small amount of salt.
This is because
the preferential solvation
strongly depends on the ambient composition.
Together with a summary
of our research in this problem,
we present some detailed results
on the role of
antagonistic salt composed of hydrophilic and hydrophobic ions.
These ions tend to segregate at liquid-liquid interfaces
and selectively couple to water-rich and oil-rich composition
fluctuations, leading to mesophase formation.
In our two-dimensional simulation,
the corasening of the domain structures
can be stopped or slowed down,
depending on the interaction parameter (or the
temperature) and the salt density.
We realize stripe patterns at the critical
composition and droplet patterns at
off-critical compositions.
In the latter case,
charged droplets emerge
with considerable size dispersity
in a percolated region.
We also give the structure factors among
the ions, accounting for the Coulomb interaction and
the solvation interaction mediated by
the composition fluctuations.
(Some figures in this article are in colour only in the electronic version)
1 Introduction
In many soft materials, phase transitions and structure formations occur in the presence of charged objects including small ions, charged colloids, and polyelectrolytes in polar fluids (mostly in water) [1, 2, 3]. Much attention has been paid to the consequences of the long-range Coulomb interaction, but not enough attention has yet been paid to the solvation interaction among charged objects and polar molecules [4, 5, 6, 7]. In the theoretical literature in physics, the solvation interaction has been mostly neglected in analytic theories and numerical simulations. In real aqueous systems, a number of molecular interactions are operative at short distances under the influence of the long-range electric potential [4]. In particular, the hydrogen bonding is of primary importance in the phase behavior in aqueous systems, as studied in neutral polymer solutions [8]. However, small ions like Na+ form a solvation shell composed of several water molecules and are hydrophilic, around which the energy of the ion-dipole interaction typically exceeds the energy of the surrounding hydrogen bonds. On the contrary, some neutral or ionized particles dislike to be in contact with water molecules and become hydrophobic. Hydrophilic and hydrophobic particles deform the surrounding hydrogen bonding in different manners [4]. Thus the solvation is highly complex in aqueous mixtures. In this paper, we will show that the preferential (or selective) solvation of ions in a mixture solvent can drastically influence the phase transition behavior.
Nabutovskii et al.[9] found a possibility of mesophases in electrolytes in the presence of a coupling between the composition and the charge density in the free energy. In our theory of electrolyte [10, 11], such a coupling originates from the solvation in polar fluids and its magnitude is exceedingly high in many real systems. Recently, including the solvation effect in mixture solvents, several theoretical groups have examined the ion effects in electrolytes [10, 11, 12, 13, 14, 15, 16, 17, 18, 19], polyelctrolytes[20, 21], and ionic surfactants [22] using phenomenological models. A review on the static properties in this line was presented in Ref.. In the dynamics, a number of problems still remain not well studied [16, 19]. On the other hand, a large number of microscopic simulations have been performed, for example, to calculate the ion distributions near water-air interfaces [24] and solid surfaces [25, 26].
In this paper, we are particularly interested in statics and dynamics of phase transitions in aqueous mixtures with antagonistic salt, which is composed of hydrophilic and hydrophobic ions. While the surface tension of liquid-liquid interfaces is known to be slightly increased by hydrophilic ion pairs [27, 28], it can be dramatically decreased by antagonistic salt as observed [29, 30]. Hydrophilic and hydrophobic ions segregate at liquid-liquid interfaces on the scale of the Debye screening length , resulting in a large electric double layer [11, 12, 16]. They also interact differently with water-rich and oil-rich composition fluctuations. Mesophases (charge density waves) then appear near the solvent criticality for sufficiently large solvation asymmetry between the cations and the anions.
We mention recent experiments where antagonistic salt was used. (i) Luo et al observed a unique interfacial ion distribution by x-ray reflectivity experiment [30]. (ii) Sadakae et al. [31] added a small amount of sodium tetraphenylborate NaBPh4 to a near-critical mixture of D2O and tri-methylpyridine (3MP). This salt dissociates into hydrophilic Na+ and hydrophobic BPh. The latter anion consists of four phenyl rings bonded to an ionized boron. They found a peak at an intermediate wave number (Å) in the intensity of small-angle neutron scattering. The peak height was much enhanced with formation of periodic structures. Moreover, they observed multi-lamellar (onion) structures at small volume fractions of 3MP (in D2O-rich solvent) far from the critical point [32], where BPh and solvating 3MP form charged lamellae. These findings demonstrate very strong hydrophobicity of BPh, which was effective close to the solvent criticality [31] and far from it [32]. (iii) Another intersting phenomenon is spontaneous emulsification (formation of small water droplets) at a water-nitrobenzene(NB) interface [33, 34]. It was observed when a large water droplet was pushed into a cell containing NB and antagonistic salt (tetraalkylammonium chloride). This instability was caused by ion transport through the interface.
The organization of this paper is as follows. In Section 2, we will present a summary of the solvation effects, particulaly focusing on the preferential solvation. In Section 3, the Ginzburg-Landau model and dynamic equations for such systems will be given. As a new result, the surface tension of binary mixtures containing an antagonistic salt will be shown to decrease to zero with increasing its density. In Section 4, we will numerically examine the mesophase formation with an antagonistic salt in two dimensions (2D).
2 Solvation effects
This section is an introduction of the preferential solvation. It provides a starting point of our theory in Section 3.
2.1 Solvation shell and Born theory
In polar liquids, a number of poalr molecules are attached to a hydrophilic ion such as Na+, Li+, or Ca2+ to form a solvation shell due to the ion-dipole interaction [4, 35] (see figure 1). On the other hand, hydrophobic particles interact with water molecules repulsively, so they tend to form aggregates in water and are more soluble in oil than in water. We may consider mixture solvents composed of polar and less polar components, where hydrophilic (hydrophobic) ions are surrounded by molecules of the more (less) polar component [5, 7] (see the right panel of figure 1). That is, solvation occurs preferentially or selectively in mixture solvents. There can be a variety of mixture solvents and, in this paper, we call the two components simply as water and oil. Note that solvation is also called hydration for water (or heavy water) and for aqueous mixtures containing water.
In this paper, we introduce a solvation chemical potential for each hydrophilic or hydrophobic charged particle, where represents the particle species and is the water composition. It is a thermodynamic quantity obtained after the statistical average over the thermal fluctuations. With formation of a well-defined solvation shell, the typical magnitude of much exceeds the thermal energy . In his original theory, Born took into account the polarization of polar molecules around a spherical ion using a continuum theory of electrostatics [36]. It is the space integral of the electrostatic energy , where in terms of the potential . Here depends on the distance from the ion center with being the charge. The classic Born formula thus obtained is written as
| (2.1) |
which is applicable for hydrophilic small ions. Here the linear dielectric constant is used, though the electric field in the vicinity of a small ion is strong beyond the linear response level (leading to dielectric saturation). The space integral is in the region , where the lower cut-off is called the Born radius of order for small metallic ions [4, 37]. In terms of the Bjerrum length , the Born form itself considerably exceeds the thermal energy for . Here is for room-temperature water and is longer for less polar solvents. The Born formula is in accord with the fact that the solvation is stronger for smaller ions. It also indicates that the solvation is much intensified for multivalent ions such as Ca2+ or Al3+. For mixture solvents, the dielectric constant depends on the composition of the more polar component A [38], changing from of the less polar component B to of the more polar component A. Since the Born expression is inversely proportional to , it indicates strong preferential solvation. However, the Born formula is known to be very crude neglecting the formation of the shell structure, the density and composition changes (electrostriction), and the nonlinear dielectric effect. Moreover, the solvation should be strongly coupled with the surrounding hydrogen bonds in aqueous mixtures.
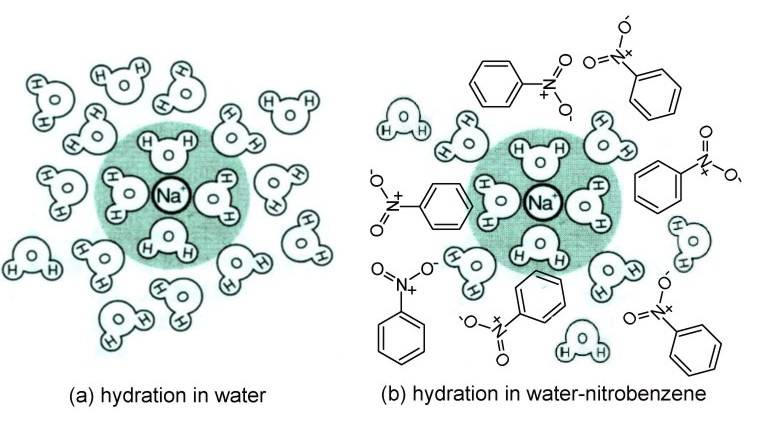
We give a simple argument on the condition of the formation of a well-defined solvation shell composed of several polar molecules. Let the solvent molecular size be longer than the ion radius (where for water). For single component polar liquids, we compare the electrostatic energy in the region and the thermal energy to find the criterion,
| (2.2) |
For mixture solvents, a phenomenological theory yields the criterion [10],
| (2.3) |
for the formation of a well-defined preferential shell. Here the molecular volumes of the two componenta are assumed to be of the same order and we define
| (2.4) |
where the derivative is at fixed and . In these relations, we have estimated the binding energy of a polar molecule to an ion to be or . Since is a microscopic energy, these estimations should be very crude (as well as the Born formula). In this theory, the strong solvation regime is realized for or for . If the influence on the hydrogen bonding network is neglected, the radius of a solvation shell grows as or as from the decay of the electrostatic energy density . Here it is worth noting that the shell radius plays the role of the hydrodynamic radius in the diffusion constant with being the shear viscosity. As a result, ions with smaller molecular radii () have larger hydrodynamic radii, which is explained from the relation [39]. For example, Li+ ions are smaller than Na+ ions, but the diffusion constant of Li+ is smaller than that of Na+ in water.
In electrochemistry, much attention has been paid to the ion distribution and the electric potential difference across a liquid-liquid interface [39, 40]. Remarkably, water molecules solvating a hydrophilic ion in the water-rich region remain attached to the ion even when the ion crosses an interface and moves into the oil-rich region. Osakai et al [41] measured the amount of water molecules extracted together with hydrophilic ions in a nitrobenzene(NB)-rich phase with a small water composition (M). In NB-water at room temperatures, the number of coextracted water molecules in a NB-rich phase was estimated to be 4 for Na+, 6 for Li+, and 15 for Ca2+. Furthermore, using proton NMR spectroscopy, Osakai et al. [42] studied successive formation of complex structures of anions (such as Cl- and Br-) and water molecules by gradually increasing the water composition in NB.
These experiments demonstrte that the solvation shell composed of water molecules is stable even when the ambient water composition is much decreased. This is a remarkable result suggesting a number of important consequences. For example, with a small amount of hydrophilic ions in oil, let us gradually increase the water composition from zero. If the binding energy of a water molecule to such an ion is much larger than , we may argue that a hydration shell is formed for [21]
| (2.5) |
where the crossover composition is very small for strongly hydrophilic ions. The solvation chemical potential of hydrophilic ions in water-oil should decrease considerably in the narrow dilute range . Its variation should be milder in the range (2.5). The solbility of such ions should also increase abruptly in the same narrow range of with addition of water to oil. Therefore, solubility measurements of hydrophilic ions are informative at small water compositions.
2.2 Gibbs transfer free energy and solvation chemical potentials
We consider a liquid-liquid interface between a polar phase and a less polar phase with bulk compositions and , across which there arises a difference in due to its composition dependence:
| (2.6) |
where () are the bulk values of the solvent chemical potential of species in the two phases. In electrochemistry [40, 41], the difference of the solvation free energies between two phases have been called the standard Gibbs transfer energy. (Since is usually measured in units of kJ per mole, dividing it by the Avogadro number gives per ion). It is well-known that if there are differences among (, an electric double layer emerges at the interface, giving rise to an electric potential jump across the interface in equilibrium (called the Galvani potential difference). Similar potential differences also appear at liquid-solid interfaces (electrodes) [39]. It is also worth noting that there can be an electric potential difference between two liquids due to orientation of molecular dipoles even without added ions, for which see Ref. for water-hexane.
To examine the above effect, let us suppose only two species of ions () with charges and ( and ). At sufficiently low ion densities, the ion chemical potentials are expressed as [39, 40]
| (2.7) |
for . The is the thermal de Broglie length (but is an irrelevant constant in the following). From the charge neutrality in the bulk regions, the bulk ion densities , , , and satisfy
| (2.8) |
The continuity of across the interface yields
| (2.9) |
for . Then the Galvani potential difference is expressed as [40, 11]
| (2.10) |
The ion densities in the bulk two phases are related by
| (2.11) |
Let us take the axis perpendicular to a liquid-liquid interface. While the interface thickness is given by the correlation length , the potential changes on the scale of the Debye-Hckel screening length, in phase and in phase . As a result, changes from to on the spatial scale of , which becomes very long as the ion densities determined by equation (2.11) become very small in one of the two phases [11]. Remarkably, in equation (2.10) is independent of the ion densities. It is typically of order mV) for . It vanishes for symmetric ion pairs with . As equation (2.11) indicates, the ion densities in the two phases are very different in most cases. For example, if in the monovalent case, the common ratio becomes . If is macroscopic (as in air in contact with salted water), may not be observable.
In the literature, data of on water-nitrobenzene at room temperatures are available [40, 41], where water and NB are strongly segregated but a considerable amount water is present in the NB-rich phase (M). For aqueous mixtures with being the water-rich phase, is negative for hydrophilic ions and positive for hydrophobic ions. For water-nitrobenzene [40], we have -13.6 for Na+, -15.3 for Li+, -26.9 for Ca2+, -11.3 for Br-, and -7.46 for I- as examples of hydrophilic ions, while we have for hydrophobic BPh. In these experiments, a hydration shell should have been formed around each hydrophilic ion even in the water-poor phase . Equation (2.5) then suggests . Though more data are needed, those of for NB-water indicates the composition-dependence of quantitatively, which is very strong even after the formation of solvation shells.
3 Ginzburg-Landau Theory
We will first give a short summary of our previous results in the Ginzburg-Landau scheme in the presence of the preferential solvation in Subsections 3.1-3.3. New results will then follow on the structure factors among ions, the surface tension behavior with antagonistic salt, and the phase diagram. We treat two species of monovalent ions. However, for three species of ions, we obtain more complex ionic distributions near liquid-liquid interfaces [30, 12] and solid surfaces [26].
3.1 Electrostatic and solvation interactions
We consider a polar binary mixture (water-oil) containing a small amount of monovalent salt ( and ). The ions are sufficiently dilute and their volume fraction is negligible. Hereafter the Boltzmann constant will be set equal to unity. Neglecting the image interaction, we assume the free energy density [10, 11],
| (3.1) |
The first term is the chemical part. In our simulation we use the Bragg-Williams form,
| (3.2) |
where is the solvent molecular volume common to the two components and depends on (at constant pressure). Here at the solvent critical temperature without ions and for small . The second term is the gradient part with being a constant. The third term is the electrostatic free energy, where is the electric field and the potential is produced by the charge density via the Poisson equation,
| (3.3) |
The dielectric constant can depend on the composition [38]. In our previous work the linear composition dependence
| (3.4) |
has been assumed, where and are constants. The last term in the right hand side of equation (3.1) consists of the entropic part and the solvation part of the ions, with being the thermal de Broglie length. The solvation terms follow if depend on linearly as
| (3.5) |
where the constant term gives rise to a contribution linear in in and is irrelevant, while the second term ) yields the solvation coupling in . In this approximation, the parameter represents the strength of the preferential solvation of ion species . The difference of the solvation chemical potential in two-phase coexistence in equation (2.6) is given by
| (3.6) |
where is the composition difference. Thus for hydrophilic ions and for hydrophobic ions. The discussion in the subsection 2.2 indicates for Na+ ions and for BPh in water-nitrobenzene at 300K.
The linear form equation (3.5) is adopted for the mathematical simplicity and should not be taken too seriously. Moreover, around equation (2.5), we predict a steep drop of in the range for hydrophilic ions with formation of a hydration shell. Thus equation (3.5) is applicable for . In addition, in our previous papers [11, 12], the image interaction was also included in the free energy, but it is neglected in this paper for simplicity.
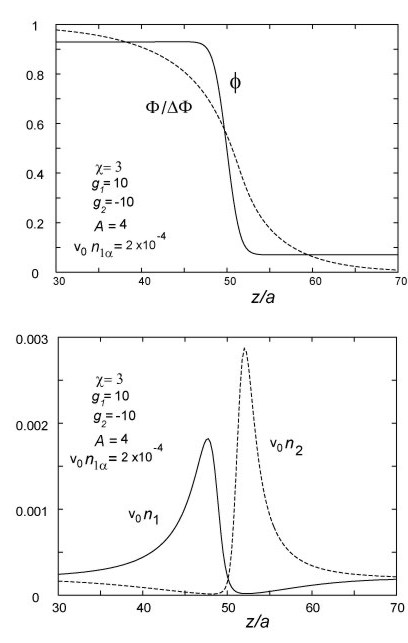
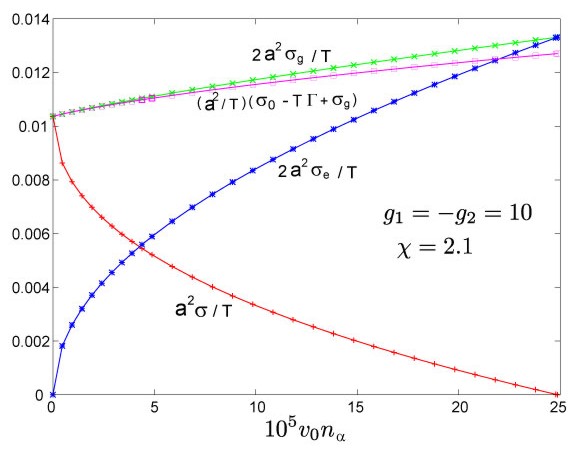
For a monovalent antagonistic salt, figure 2 gives equilibrium interface profiles with at (see Ref. for more details), where we can see a marked electric double layer. The bulk cation densities in the two sides, and , coincide from equation (2.8) and is set equal to . The interface thickness is of order , while changes on the scale of . The surface tension change due to salt is (where without salt) and the surface adsorption of ions is (see equation (3.33)). If , the electric double layer is increasingly enhanced with further increasing and/or , eventually leading to vanishing of the surface tension (see figure 3). We can understand these features by solving the nonlinear Poisson-Boltzmann equation [12]. See also a similar recent calculation of the interface profiles [19]. The ionic interfacial distribution was measured for a ternary, antagonistic salt in water-NB in the experiment by Luo et al.[30] and was theoretically explained in our previous paper [12].
3.2 Dynamic equations
We present the dynamic equations for , , , and the velocity field [16, 44]. The fluid is incompressible and isothermal, so we assume and treat the mass density and the temperature as constants. Then and obey
| (3.7) | |||
| (3.8) |
The kinetic coefficient and the ion diffusion constants and are constants. The symbol in the second line of equation (3.8) denotes for the cations and for the anions (). The momentum equation is expressed as
| (3.9) |
where ensures , is the shear viscosity, and () is the reversible stress tensor of the form,
| (3.10) |
with . It follows the relation which is needed for the self-consistency of our model dynamic equations [16, 44]
In numerically integrating the dynamic equations, we may use the following two approximations [16]. First, in the Stokes approximation, we set the right hand side of equation (3.9) equal to zero. Then is expressed in terms of the Oseen tensor inversely proportional to the viscosity [44]. Second, in the quasi-static approximation, we assume that the characteristic ion diffusion time is much faster than the the relaxation time of the composition. This is justified near the solvent critical point and in describing slow domain growth. In such cases, the ion distributions are expressed in terms of and in the modified Poisson-Boltzmann relation [11],
| (3.11) |
This form was also used in analysis of experimental data [30] and in that of molecular dynamics simulation [25]. The coefficients are determined from the conservation of the ion numbers,
| (3.12) |
where denotes the space average with being the cell volume. The average density is a given constant. It will be measured in units of or the normalized density will be used with appearing in equation (3.2).
3.3 Structure factors and effective ion-ion interaction in one-phase states
We suppose small deviations and of the composition and the ion densities in one-phase states. Their equilibrium distributions are treated to be Gaussian in the mean field theory. Then, from the free energy (equation (3.1)), we may readily calculate the following structure factors,
| (3.13) |
where , , and are the Fourier components of the composition , the ion densities , and the charge density with wave vector and denotes the thermal average. It follows the relation,
| (3.14) |
The -dependence of the dielectric constant is negligible for small fluctuations. We introduce the Bjerrum length and the Debye wave number by
| (3.15) |
After elimination the ion fluctuations, the second order contribution of the free energy is written as . The inverse of is written as [10, 11]
| (3.16) |
where is related to the second derivative of and use of equation (3.2) yields
| (3.17) |
The parameter represents asymmetry of the solvation of the two ion species and is defined by
| (3.18) |
Remarkably, is independent of the salt density. Note that the structure factor for weakly ionized polyelectrolytes has the same form [2, 3], where the solvation has been neglected, however. Recently, we have presented a generalized form of the structure factor for polyelectrolytes including the solvation interaction and the ionization fluctuations [20].
We explain implications of the structure factor (equation (3.16)). (i) The second term gives rise to a shift of the spinodal curve. For example, if the cations and anions are hydrophilic and , the shift term is of order and its magnitude can be appreciable even for . It is well-known that the coexistence curve and the spinodal curve of aqueous mixtures are much shifted even by a small amount of hydrophilic ions such as Na+ and Br- [45]. (ii) On the other hand, can be increased for antagonistic salt [10, 11, 31]. From the last term in equation (3.16) a Lifshitz point appears at . (In figure 2, ). That is, while is maximum at for , it exhibits a peak at an intermediate wave number for . The peak height is given by , where
| (3.19) |
For , mesophase formation should take place (see figure 4). For , two-phase states with a planar interface can be stable or metastable even for . (iii) If , the criticality and the macroscopic phase separation can remain in the mean field theory. That is, for , we obtain the Ornstein-Zernike form,
| (3.20) |
The coefficient in front of is reduced by the factor , which leads to enhancement of in the range . When , the correlation length should be redefined by
| (3.21) |
Second, retaining the ion densities, we eliminate the composition fluctuations in by setting
| (3.22) |
where the terms nonlinear in are neglected. We then obtain effective interactions among the ions mediated by the composition fluctuations. The resultant free energy of ions is written as
| (3.23) |
where the terms linear in are not written explicitly. Here the deviations need not be very small and the logarithmic terms are not expanded with respect to them. The effective interaction potentials are expressed as [11]
| (3.24) |
where and are the ion charges (being in the monovalent case) and is the correlation length without ions (different from in equation (3.21)).
The solvation-induced interaction is effective in the range and can be increasingly important on approaching the solvent criticality (for ). (i) It is attractive among the ions of the same species and dominates over the Coulomb repulsion for
| (3.25) |
Under this condition there should be a tendency of ion aggregation of the same species. (ii)In the antagonistic case (), the cations and anions can repel one another in the range for
| (3.26) |
which triggers charge density waves near the solvent criticality.
The ion structure factors in equation (3.13) can be calculated from in equation (3.23). The inverse of the matrix is written as
| (3.27) |
where is the Fourier transformation of in equation (3.24). In the monovalent case, some calculations give desired results,
| (3.28) |
where and
| (3.29) |
is the structure factor for the cations (or for the anions) in the absence of solvation. The solvation parts in equation (3.28) are all proportional to , where is given by equation (3.16), so they diverge on approaching the spinodal discussed below equation (3.18). The Coulomb interaction suppresses large-scale charge-density fluctuations, so tends to zero as .
3.4 Surface tension
Addition of an antagonistic salt can dramatically reduce the surface tension of liquid-liquid interfaces even at small content [12]. This trend was in fact observed [29, 30]. Here the behavior of will be examined in some detail as a continuation of Ref., but the image interaction will be neglected.
We suppose a planar liquid-liquid interface at taking the axis in its perpendicular direction. We impose the boundary condition in phase and in phase far from the interface and minimize the grand potential . The grand potential density reads
| (3.30) |
where is the free energy density in equation (3.1) and the chemical potentials and are homogeneous constants. The relation is then derived and is integrated to give
| (3.31) |
where and . Since and tend to zero far from the interface, tends to a common value as . The surface tension is written as
| (3.32) |
In our previous work [11, 12], we expanded with respect to the salt density as
| (3.33) |
where is the surface tension without solute and is the surface adsorption of ions. In terms of the total ion density , it is defined by
| (3.34) |
where ( or ) and , so the integrand tends to zero as . The expansion (equation (3.33)) is valid up to linear order in the salt density. For dilute neutral solute, it becomes the well-known Gibbs formula [46]. The electrostatic contribution to the surface tension has been neglected in the Gibbs formula, but it can be crucial for antagonistic salt [12] and for ionic surfactant [22].
We have numerically examined these relations. To this end, we introduce the areal densities of the electrostatic energy and the gradient free energy as
| (3.35) |
Then equations (3.32) and (3.33) yield and
| (3.36) |
In figure 3, we show the surface quantities , , , and the combination as functions of the bulk ion density , where , , and . Here for . The surface tension vanishes at , where . The approximate relation (equation (3.36)) excellently holds here, where its deviation is at most of order .
3.5 Phase diagram with antagonistic salt
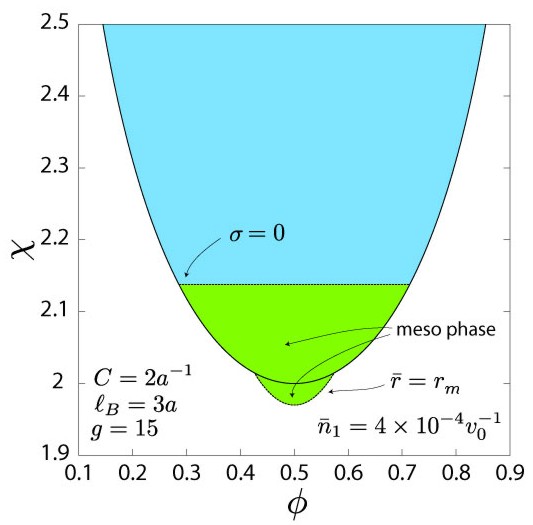
With addition of antagonistic salt, the consolute criticality of binary mixtures disappears due to emergence of mesophases. However, we have not yet fully understood the phase behavior even in the mean field theory. So far, we have found (i) instability of one-phase states for in the range , as discussed around equation (3.19), and (ii) vanishing of the surface tension with increasing the salt density as in figure 3 or on approaching the solvent criticality. Thus, in figure 4, mesophases should be formed in the area with and in the - plane. Here at .
4 Simulations in Two Dimensions with Antagonistic Salt
We already presented 2D simulation results of phase separation of a binary mixture with a monovalent, antagonistic salt at the critical composition [16]. Here we present further results in two dimensions at and 0.4. The composition patterns are analogous to those well-known for block copolymers, surfactant systems, and magnetic fluids [44, 47, 48]. In our ionic case, however, we shall encounter some unique features in the droplet patterns. We stress that three dimensional simulations are needed to really understand the phase ordering in this system. For example, we should reproduce the observed onion structure [32].
4.1 Background of simulation
We vary the interaction parameter and set the average ion density equal to 0.002 or 0.003. The other parameters are the same as in our previous work [16]. Namely, we set , , , and . Then we obtain from equation (3.18). These values of and are realistic in view of the data of the Gibbs transfer free energy, as discussed below equation (2.11). On a square lattice, we integrated the dynamic equation (3.7) using the Bragg-Williams free energy density in equation (3.1), the Stokes approximation for the velocity field , and the modified Poisson-Boltzmann expressions (equation (3.12)) for the ion densities and . At , we started with the initial condition with small random numbers superimposed. Subsequently, phase ordering took place for the parameter values given below. The space mesh size is and the time step of integration is , where is related to the kinetic coefficient in equation (3.7). and the viscosity in equation (3.9) as
| (4.1) |
Time-evolution of the composition is meassured in units of . In late stages it is much slower than .
4.2 Slow coarsening and patterns
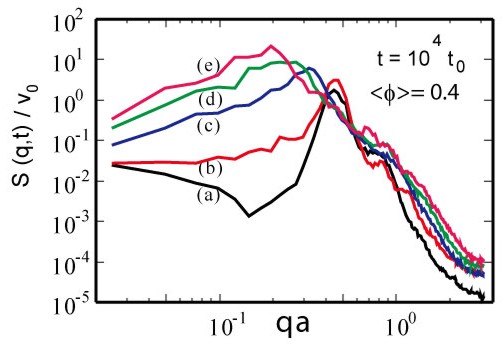
In figure 5, we plot the (angle-averaged) structure factor of the composition vs for at . It exhibits a sharp peak at . In our previous work [16], a similar plot of was given for . For each simulation run, we calculate the characteristic wave number by
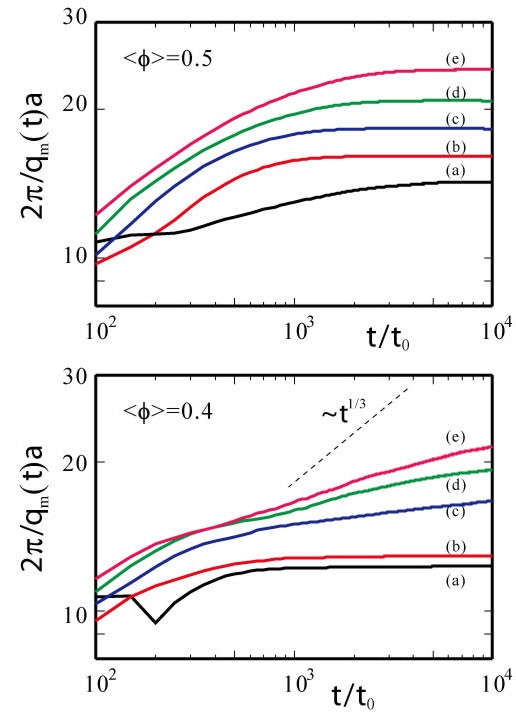
| (4.2) |
where is the Fourier component of . In figure 6, we plot the characteristic domain size vs . For all at and for 2.0 and 2.1 at , the coarsening is nearly stopped at long times. For at , it is much slowed down at long times and, if we write , the exponent increases from zero up to about at . Note that the typical domain size grows as for conserved order parameter without the hydrodynamic interaction and is faster with the hydrodynamic interaction[44, 49].
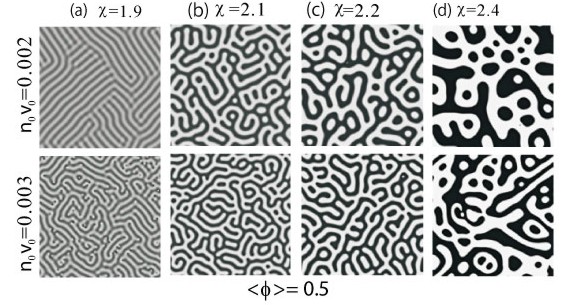
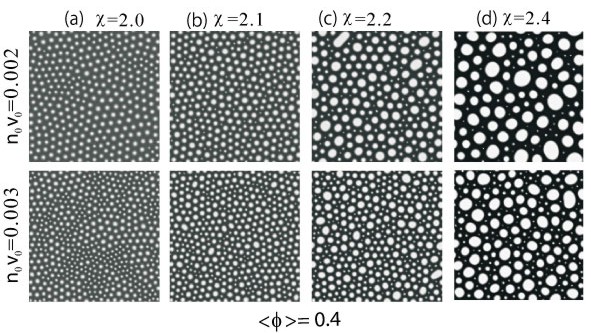
We next show composition patterns at . From figure 6, they are frozen or very slowly evolving. In figure 7, they are stripe-like and bicontinuous for . In figure 8, they are droplet-like for . The gradation of each snapshot represents the local value of . For (or 0.4), the variance is about 0.16 (or 0.13) at and increases to 0.33 (or 0.31) at . Note that no phase separation occurs for without ions. We recognize that the patterns are very sensitive to the values of and . A marked feature is that the largest domain size increases with increasing and decreases with increasing . More details are as follows. (i) At in figure 7, the patterns are lamellar-like for , while they resemble those in systems with competing interactions [47, 48]. (ii) In the droplet patterns at , water-rich droplets in a percolated oil-rich region have considerable size dispersity. This is possible only when even small droplets have long life times. (Without ions, small droplets quickly disappear due to the surface tension effect.) Large and small droplets segregate exhibiting polycrystal-like medium-range order for , while larger droplets are growing and smaller ones are diminishing very slowly in random configurations for .
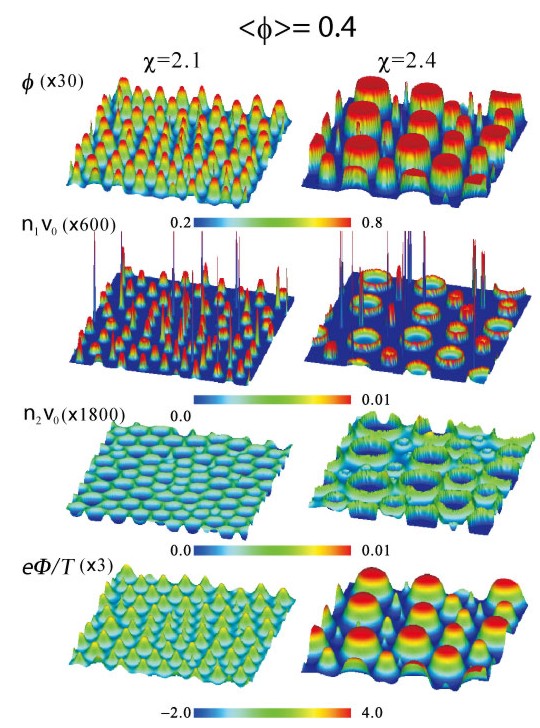
In figure 9, at , we display the composition , the ion densities and , and the potential at for the two cases and 2.4. Similar snapshots at can be found in our previous paper [16]. The typical droplet radii are a few times larger for than for , but small droplets (with diameter) still remain in the two cases giving rise to sharp peaks in the cation distribution. Due to the strong selective solvation, the cations are within the droplets and the anions are outside them. For , the typical droplet size is small and the cation density is highest at the droplet centers. For , the cations and the anions are mostly localized in the electric double layers at the interfaces. In these cases, the water-rich droplets are positively charged and are repelling one another. However, we have not yet examined how this repulsion can influence the coarsening process.
4.3 Effective surface tension
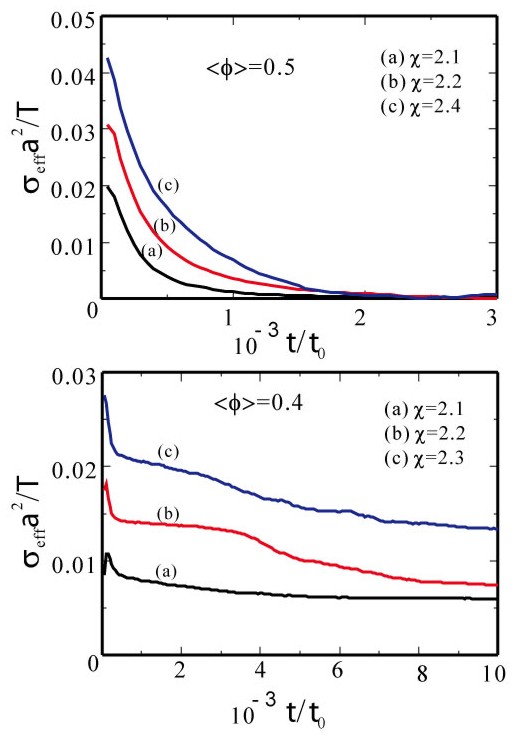
In figure 10, we show the time-development of the effective surface tension defined by
| (4.3) |
where is the total interface length calculated separately. This quantity becomes the usual surface tension for a planar interface in equilibrium from equation (3.32). (In our previous work [16], the space averages of the gradient free energy density and the electrostatic energy density were separately plotted for in figure 10 there.) We recognize that tends to zero for bicontinuous domain morphology but remains positive for droplet morphology. It is rather surprising that the coarsening in the droplet case is much slowed down even for positive . To explain these results theoretically, we need more systematic analysis of the problem.
5 Summary and remarks
In this work, we have demonstrated the crucial role of the preferential solvation of ions in phase transitions of polar binary mixtures. Together with a short summary of our previous work, we have presented some new results. (i) In equation (3.28), we have calculated the structure factors among the ion density fluctuations. (ii) In figure 3, we have examined how the surface tension tends to zero with increasing the density of antagonistic salt. (iii) In figure 4, we have shown a phase diagram of a binary mixtures containing antagonistic salt, where mesophases are realized near the solvent criticality. Note that the original criticality without ions disappears when antagonistic salt with is added. (vi) In figures 5-10, we have numerically examined the phase ordering of a binary mixture containing antagonistic salt for four values of in the bicontinuous case at and in the droplet case at . The coarsening is markedly slowed down with decreasing to 2 and/or with increasing the ion density . The size dispersity of water-rich droplets is significant, because even small droplets have very long life times. In figure 9, we have found that water-rich droplets are positively charged with the anions in the percolated oil-rich region. In figure 10, the effective surface tension vs is plotted for and 0.4. It tends to zero for but remains positive for .
In figures 7 and 8, the domain configurations exhibit some mesoscopic order (lamellar-like or polycrystal-like) for close to 2, while they remain disordered for larger in our simulation time. In this paper, we cannot conclude whether or not the domain growth has ultimately stopped or not. If the thermal noise is present, the system might be slowly approaching lamellar or crystalline states at very long times.
In our theory, the molecular volumes of the two components are commonly . However, the molecular volumes of D2O and 3MP (the inverse densities of the pure components) are 28 and 168 Å3, respectively, for example. Moreover, the coefficient of the gradient free energy is an arbitrary constant. Therefore, our theory remains very qualitative. It is not clear how can be determined in aqueous mixtures where the hydrogen bonding is of primary importance. For pure water, the observed surface tension outside the critical region fairly agrees with the calculated surface tension from the van der Waals model with the gradient free energy density [52, 53], where is the density and is the van der Waals radius.
There can be a number of dynamical effects in the presence of antagonistic salt, including multi-exponential decays of the dynamic light scattering intensity [16] and singular rheological behavior with appearance of mesophases [44]. We propose experiments of the surface instability taking place for negative surface tension. That is, a water-oil interface becomes unstable with addition of antagonistic salt above a critical amount (as suggested by figure 3) or on approaching the solvent criticality with a fixed density of antagonistic salt. In the introduction, we have already mentioned the experiments of spontaneous emulsification at a water-oil interface with antagonistic salt [33, 34].
Though this paper has mostly treated antagonistic salt, intriguing solvation effects can well be predicted for aqueous mixtures containing usual hydrophilic ion pairs. For example, many groups have detected long-lived heterogeneities by dynamic light scattering in one-phase states of various aqueous mixtures containing hydrophilic salt [50]. Recently, we have shown that preferential solvation can stabilize water-rich domains enriched with ions even for when water is the minority component [51]. We also mention the problem of preferential wetting of mixture solvents on ionizable surfaces, which can be either planar, spherical, or cylindrical. Around an ionizable rod, we already predicted a first-order wetting transition with discontinuous jumps in the preferential adsorption and the degree of ionization [21]. In such situations, we should take into account the solvation interaction among the charges (consisting of the ionized units on the surface and the counterions) and the polar molecules.
Finally, it is worth noting that ion-induced nucleation has long been investigated in the literature [54, 55]. It is well-known that water droplets can easily be produced around hydrophilic ions in metastable gas mixtures containing water vapor. Here ions play the role of nucleation seeds on which hydration-induced condensation occurs. A Ginzburg-Landau approach to this problem in the line of Ref. was also presented [53].
Acknowledgments
This work was supported by KAKENHI (Grant-in-Aid for Scientific Research)
on Priority Area Soft Matter Physics from
the Ministry of Education, Culture,
Sports, Science and Technology of Japan.
Thanks are also due to K. Sadakane and H. Seto for
informative discussions.
References
References
- [1] Levin Y 2002 Rep. Prog. Phys. 65 1577
- [2] Holm C, Joanny J F, Kremer K, Netz R R, Reineker P, Seidel C, Vilgis T A and Winkler R G 2004 Adv. Polym. Sci. 166 67
- [3] Dobrynin A V and Rubinstein M 2005 Prog. Polym. Sci. 30 1049
- [4] Israelachvili J N 1991 Intermolecular and Surface Forces (London: Academic Press)
- [5] Marcus Y 1985 Ion Solvation (New York: Wiley)
- [6] Ohtaki H and Radnai T 1993 Chem. Rev. 93 1157
- [7] Gutmann V 1978 The Donor-Acceptor Approach to Molecular Interactions (New York: Plenum )
- [8] Matsuyama A and Tanaka F 1990 Phys. Rev. Lett 65 341; Bekiranov S, Bruinsma R and Pincus P 1997 Phys. Rev. E 55 577
- [9] Nabutovskii V M, Nemov N A and Peisakhovich Yu G 1980 Phys. Lett. 79A 98; Sov. Phys. JETP 52 111 Zh. Eksp. Teor. Fiz. 79 2196; 1985 Mol. Phys. 54 979
- [10] Onuki A and Kitamura H 2004 J. Chem. Phys. 121 3143
- [11] Onuki A 2006 Phys. Rev. E 73 021506
- [12] Onuki A 2008 J. Chem. Phys. 128 224704
- [13] Marcus G, Samin S and Tsori Y 2008 J. Chem. Phys. 129 061101
- [14] Bier M, Zwanikken J and van Roij R 2008 Phys. Rev. Lett. 101 046104; Zwanikken J, de Graaf J, Bier M and van Roij R 2008 J. Phys.: Condens. Matter 20 494238
- [15] Ben-Yaakov D, Andelman D, Harries D and Podgornik P 2009 J. Phys. Chem. B 10 6001
- [16] Araki T and Onuki A 2009 J. Phys.: Condens. Matter 21 424116
- [17] Kung W, Solis F J and Olvera de la Cruz M 2009 J. Chem. Phys. 130 044502
- [18] Ciach A and Maciolek A 2010 Phys. Rev. E 81 041127
- [19] Rotenberg B, Pagonabarragac I and Frenkel D 2010 Faraday Discuss. 144 223
- [20] Onuki A and Okamoto R 2009 J. Phys. Chem. B 113 3988
- [21] Okamoto R and Onuki A 2009 J. Chem. Phys. 131 094905
- [22] Onuki A 2008 Europhys. Lett. 82 58002
- [23] Onuki A 2009 Polymer, Liquids and Colloids in Electric Fields: Interfacial Instabilities, Orientation and Phase-Transitions ed Y Tsori (Singapore: World Scientific)
- [24] Jungwirth P and Trobias D J 2006, Chem. Rev. 106, 1259
- [25] Horinek D and Netz R R (2007) Phys. Rev. Lett. 99 041127
- [26] Ottosson N, Heyda J, Wernersson E, Pokapanich W, Svensson S, Winter B, hrwall G, Jungwirth P, and Bjrneholm O (2010) Phys. Chem. Chem. Phys. 12 10693
- [27] Onsager L and Samaras N N T 1934 J. Chem. Phys. 2 528
- [28] Levin Y and Flores-Mena J E 2001 Europhys. Lett. 56 187
- [29] Reid J D, Melroy O R and Buck R P 1983 J. Electroanal. Chem. Interfacial Electrochem. 147 71
- [30] Luo G, Malkova S, Yoon J, Schultz D G, Lin B, Meron M, Benjamin I, Vanysek P and Schlossman M L 2006 Science 311 216
- [31] Sadakane K, Seto H, Endo H, and Shibayama M 2007 J. Phys. Soc. Jpn. 76 113602
- [32] Sadakane K, Onuki A, Nishida K, Koizumi S and Seto H 2009 Phys. Rev. Lett. 103 167803
- [33] Aoki K, Li M, Chen J and Nishiumi T 2009 Electrochem. Commun. 11 239
- [34] Wojciechowski K and Kucharek M 2009 J. Phys. Chem. B 113 13457
- [35] Shin D. N. Shin, J. W. Wijnen, J. B. F. N. Engberts, and A. Wakisaka, J. Phys. Chem. B 106, 6014 (2002).
- [36] Born M 1920 Z. Phys. 1 45
- [37] Marcus Y 1988 Chem. Rev. 88 1475
- [38] Debye P and Kleboth K 1965 J. Chem. Phys. 42 3155
- [39] Hamnett A, Hamann C H and Vielstich W 1988 Electrochemistry (Weinheim: Wiley-VCH)
- [40] Hung L Q 1980 J. Electroanal. Chem. 115 159; Hung L Q 1983 J. Electroanal. Chem. 149 1
- [41] Osakai T and Ebina K 1998 J. Phys. Chem. B 102 5691
- [42] Osakai T, Hoshino M, Izumi M, Kawakami M and Akasaka K 2000 J. Phys. Chem. B 104 12021
- [43] Patel S A and Brooks III C L (2006) J. Chem. Phys. 124 204706
- [44] Onuki A 2002 Phase Transition Dynamics (Cambridge: Cambridge University Press)
- [45] Eckfeldt E L and Lucasse W W 1943 J. Phys. Chem. 47 164 ; Hales B J, Bertrand G L and Hepler L G 1966 J. Phys. Chem. 70 3970; Balevicius V and Fuess H 1999 Phys. Chem. Chem. Phys. 1 1507; Misawa M, Yoshida K, Maruyama K, Munemura H and Hosokawa Y 1999 J. Phys. Chem. Solids 60 1301
- [46] Gibbs J W 1957 Collected Works, Vol. 1 (New Haven, CT: Yale University Press), pp. 219-331
- [47] Seul M and Andelman D 1995 Science 267 476
- [48] Ohta T 2009 Kinetics of Phase Transitions: Ordering Phenomena and Phase Separation ed S Puri, CRC (Press, Taylor and Francis)
- [49] Furukawa H (2000) Phys. Rev. E 61 1423
- [50] Euliss G W and Sorensen C M 1984 J. Chem. Phys. 80 4767; Kostko A F, Anisimov M A, and Sengers J V 2004 Phys. Rev. E 70 026118; Wagner M, Stanga O, and Schrer W 2004 Phys. Chem. Chem. Phys. 6 580; Yang C, Li W and Wu C 2004 J. Phys. Chem. B 108 11866; Sedlak M 2006 J. Phys. Chem. B 110 4329, 4339, 13976
- [51] Okamoto R and Onuki A 2010 arXiv: 1010.1807
- [52] Kiselev S B and Ely J F 2003 J. Chem. Phys. 119 8645.
- [53] Kitamura H and Onuki A 2005 J. Chem. Phys. 123 124513
- [54] Thomson J J 1906 Conduction of Electricity through Gases (Cambridge: Cambridge University Press) Sec.92.
- [55] Kusaka I, Wang Z G and Seinfeld J H 1995 J. Chem. Phys. 102 913; 1995 J. Chem. Phys. 103 8993