A variationally computed line list for hot NH3
Abstract
We present ‘BYTe’, a comprehensive ‘hot’ line list for the ro-vibrational transitions of ammonia, 14NH3, in its ground electronic state. This line list has been computed variationally using the program suite TROVE, a new spectroscopically-determined potential energy surface and an ab initio dipole moment surface. BYTe, is designed to be used at all temperatures up to 1 500 K. It comprises 1 137 650 964 transitions in the frequency range from 0 to 12 000 cm-1, constructed from 1 366 519 energy levels below 18 000 cm-1 having values . Comparisons with laboratory data confirm the accuracy of the line list which is suitable for modelling a variety of astrophysical problems including the atmospheres of extrasolar planets and brown dwarfs.
keywords:
ammonia, line list, molecular spectra1 Introduction
Ammonia is the main nitrogen-containing molecule observable in a variety of astrophysical environments. For example, whilst the spectra of M and L-type brown dwarfs are dominated by H2O, and CH4 becomes increasingly important at lower temperatures, NH3 is a significant source of opacity in the atmospheres of late T-type dwarfs, particularly in the 10.5 m region (Burrows et al., 1997; Sharp & Burrows, 2007). Modelling suggests that absorption by ammonia will be even more important in the yet-to-be discovered Y-dwarfs (Burrows et al., 2003) and it is possible that NH3 absorption bands may be the principal distinguishing feature of this new class of ultra-cool dwarf.
The molecule is known to be present in the atmosphere of solar system gas giant planets (Lara et al., 1998). For example, emission spectra of hot ammonia were observed in the atmosphere of Jupiter after the impact of Comet Shoemaker-Levy 9 (Orton et al., 1995) and in the aftermath of the July 2009 impact on Jupiter (Orton et al., 2010; Fletcher et al., 2010).
NH3 is present in cometary comae, typically in number densities of that of gaseous H2O (Kawakita& Watanabe, 2002; Bonev et al., 2009). Although the cometary environment is cold, solar pumping (Dello Russo et al., 2004; Kawakita & Mumma, 2010) and other excitation mechanisms (Barber et al., 2009) are able to excite high lying ro-vibrational molecular states that in conditions of thermal equilibrium would only be significantly populated at temperatures in the region of 2 000 K or higher. In the densities that exist in the coma, these states are able to decay radiatively before being collisionally de-excited, and spectral lines originating from these highly excited states give important clues to the physical processes at work in cometary comae. The Einstein A coefficient listed in BYTe will enable the measured intensities of cometary NH3 spectral lines to be used in modelling the conditions in the coma.
Ammonia masers are also observed. These also involve transitions between high lying states (Madden et al., 1986). Modelling maser action requires significant spectroscopic data, and this too can be provided by our line list, which we call BYTe.
An exciting new area of astronomy is the characterisation of extrasolar planets. Water and methane have already been shown to be present in exoplanet atmospheres (for example in HD 189733b (Tinetti et al., 2007; Swain et al., 2008)), but to-date NH3 has not. The reactions by which N2 and H2 are converted into ammonia in the atmospheres of expoplanets and brown dwarfs are complex and outside the scope of this paper. However, the equilibrium between N2 and NH3 favours NH3 at lower temperatures as (to a lesser extent) do higher pressures. These temperature and pressure dependencies suggest that the outer atmospheres of extrasolar giant planets at large orbital distances will contain significant quantities of ammonia (Sudarsky et al., 2003), and it is likely that NH3 will soon be confirmed to be present in these objects.
Before BYTe, there was no NH3 line list that was sufficiently complete and accurate for use in modelling the atmospheres of exoplanets, brown dwarfs or other astronomical objects at elevated temperatures. Many astronomers have used the experimental NH3 line list of Irwin et al. (1999), which covers the 4 000-11 000 cm-1 spectral region, even though this line list is only designed to be used at temperatures below 300 K. The HITRAN database (Rothman et al., 2009) has been also extensively used. This contains approximately 30 000 lines of 14NH3, but it too is only suitable for use at ambient temperature, or below, and even then is lacking data in significant regions of the spectrum; we recently demonstrated this using our computed, comprehensive line list for cold NH3 (Yurchenko et al., 2009). This line list comprises 3.25 million transitions between 184 400 levels. It has an upper energy cut-off of 12 000 cm-1 and a maximum rotational quantum number = 20. However, despite having many more lines than any other NH3 list, like those other lists, it was designed for use at temperatures up to 300 K, which renders it unsuitable for most astronomical applications. This problem is overcome by BYTe.
2 The BYTe line list
BYTe is a catalogue of transitions represented by frequencies, Einstein coefficients, energy levels, and quantum numbers, which together fully characterise the electric dipole transitions of the ammonium molecule in the frequency range from 0 to 12 000 cm-1. The list was computed variationally using the program suite TROVE (Yurchenko et al., 2007). It comprises 1 137 650 964 transitions between 1 366 519 energy levels, all below 18 000 cm-1, and for all s up to . All transitions are within the ground electronic state of the 14NH3, since the excited electronic states are above the dissociation limit of the molecule. Less than 30 000 NH3 lines are known experimentally: BYTe contains about 40 000 times as many. It is the most comprehensive and accurate line list of NH3 and is designed to be applicable at temperatures up to 1 500 K.
The ro-vibrational energies and wave functions were computed using a new ‘spectroscopic’ potential energy surface (PES) of NH3 (Yurchenko et al., 2011). This PES was recently generated through a least-squares fit to the 14NH3 experimental energy levels mostly taken from the HITRAN database (Rothman et al., 2009). In order to evaluate the Einstein coefficients an ab initio (ATVZ) dipole moment surface of NH3 from Yurchenko et al. (2005) is used. The reported ‘hot’ NH3 line list is the result of more than three years work by our team. The method of calculation was similar to, but more computer-intensive than in our earlier = 300 K NH3 line list (Yurchenko et al., 2009).
3 Computational details
The variational rotation-vibration program suite TROVE (Yurchenko et al., 2007) was employed for all nuclear motion calculations required to produce the BYTe line list. This procedure was the same as that used in our cold line list (Yurchenko et al., 2009), and the reader is referred to this earlier paper for a more detailed account of TROVE. The main difference in generating BYTe was that a larger basis set was used than in the case of the cold NH3 paper.
TROVE normally requires a polyad number to control the basis set. In the case of ammonia, we define:
| (1) |
where are the quantum numbers associated with the basis functions , see Yurchenko et al. (2009). Thus, we include in the basis set only those functions for which . was set at 14. This optimum value produced converged eigenvalues with the minimum computational demands.
The Hamiltonian matrices were constructed from the (=0)-contracted basis set (Yurchenko et al., 2009). In order to improve the agreement of our line frequencies with experiment, the empirical basis set correction (EBSC) was utilized (Yurchenko et al., 2009). Using the EBSC approach, the vibrational energies in the ro-vibrational calculations were replaced by the corresponding experimental band centers, where these are available.
Apart from extending the basis set, we also enlarged (i) the energy range from cm-1 to cm-1, (ii) the frequency range from – cm-1 to – cm-1, and (iii) the range of the rotational excitations considered from to , respectively. These changes were necessary for the new line list to be sufficiently complete and accurate to enable spectral calculations at temperatures up to K, which is far more demanding than at K, which was the temperature criterion adopted in Yurchenko et al. (2009).
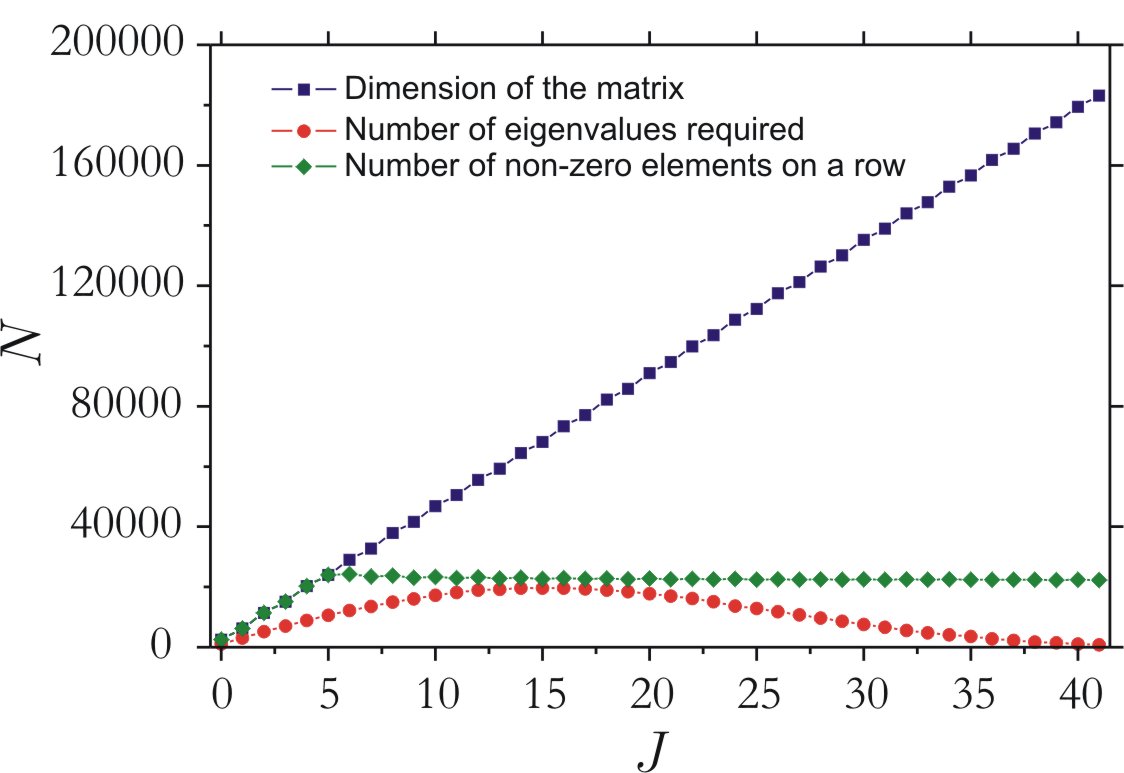
The extensions to these key parameters has a huge impact on the computational costs. In the case of BYTe, the largest Hamiltonian matrix to be diagonalized was for ( symmetry block) with dimension 162 763. In contrast, the largest Hamiltonian in Yurchenko et al. (2009) was 86 000 at . However, the most elaborate calculations, were in the = 20–27 range. These were characterised not only by large matrix dimensions (80 000 – 110 000), but also by a large number of roots of the corresponding eigenvalue problems. This is illustrated on Fig. 1, where we show the number of eigenvalues below the 18 000 cm-1 threshold and the dimensions of the -symmetry matrices for . Using the computer facilities available to us we could efficiently employ the LAPACK diagonalizer dsyev for all below 23. For and higher we had to switch to the Lanzcos-based iterative diagonalizer PARPACK (Lehoucq et al., 1998) (a parallelized version of ARPACK). In fact, the dsyev LAPACK routine allowed us to compute and store all eigenvalues of a given Hamiltonian matrix for , beyond the cm-1 threshold. One can see from Fig. 1 that for the number roots to be determined in the eigenvalue problem represents only a small fraction of the matrix dimension (less than 10 %). This is important for efficient utilization of the iterative Lanzcos-type diagonalization approaches. The matrix diagonalization is the most consuming part of line list calculation, both in terms of time and memory.
Using these techniques, we were able to generate all eigenvalues and eigenvectors for values of up to 41, subject to the energy threshold of cm-1. However, only levels below were taken into the line list because higher values did not have any ro-vibrational states with energies below the threshold for the lower energy states in BYTe of = cm-1.
As previously mentioned, in order to compute the eigenvalues and eigenvectors of NH3 we employed a new, improved, ‘spectroscopic’ PES, NH3-2010. This PES was recently generated through fitting to the available experimental data below . It involved adjustments to the analytical representation from Yurchenko et al. (2005), using the refined PES from this work as a starting point. This refinement was performed using TROVE, which was extended to allow such fitting tasks. The details of the refinement procedure and the new PES NH3-2010 will be given elsewhere (Yurchenko et al., 2011).
An accurate dipole moment surface (DMS) is a prerequisite for producing accurate line intensities. Tests have shown that these are best taken directly from high quality ab initio calculations (Lynas-Gray et al., 1995). For BYTe we employed the ATZfc DMS of NH3 from Yurchenko et al. (2005) in the improved DMS representation from Yurchenko et al. (2009), which behaves well when the molecule adopts a planar geometry. This DMS has been shown to provide intensities in good agreement with experiment (Yurchenko et al., 2005, 2009); it was also used in producing the ‘cool’ ammonia line list (Yurchenko et al., 2009).
To speed up the computation of the transition moments used to generate the Einstein A coefficients, we used the pre-screening procedure, see Yurchenko et al. (2009), in which only eigen-coefficients with magnitude larger than were selected. This reduced the size of the vectors (by about 70-80%) as well as the computation time. We also imposed an absorption intensity threshold cm mol (1.7 cm/molecule) at K, for the intensities to be included in BYTe. This threshold corresponds to about of the maximum intensity at K (18 000 cmmol). The major bottle-neck in these calculations was associated with the need to read repeatedly a huge number of eigenvectors stored on the disk. The large size of these vectors prevented us from keeping all of them in the virtual memory during the computational process. We were able to reduce the number of readings by optimizing the computational logistics. In intensity simulations each transition can be independently processed, which effectively naturally parallelizes them, distributing them between computational nodes (see Yurchenko et al. (2009)).
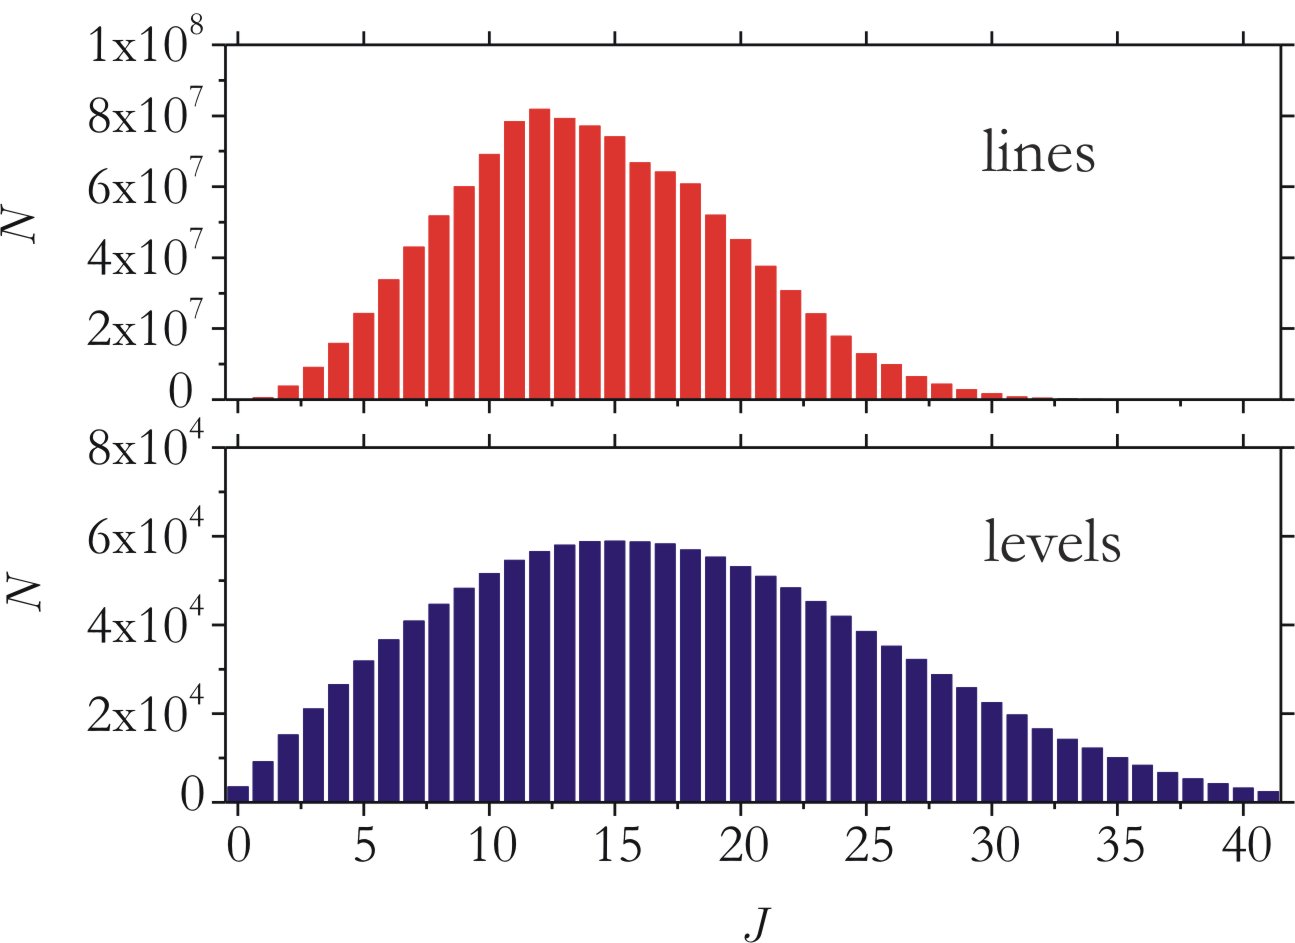
The most expensive part of the intensity calculations was for from to , which accounts for approximately 75 % of all transitions to be computed. In Fig. 2 we show how the number of lines and energy levels depend on . The number of levels peaks at and the reduces gradually with higher and eventually reaches zero due to our lower and upper energy limits of and cm-1 respectively.
4 Structure of the line list of NH3
The BYTe 14NH3 line list contains 1.138 billion lines, which are the allowed transitions above a certain minimum intensity, between 1.367 million ro-vibrational levels. The structure of BYTe is similar to that of the BT2 water line list (Barber et al., 2006). BYTe comprises two files. One, the Energy file, holds the energies and ro-vibrational quantum numbers of all NH3 states up to that are less than 18 000 cm-1 above the zero point energy (our value is 7430.288276 cm-1). Table 1 gives an extract from the Energy file. Apart from the general quantum numbers associated with the molecular group symmetry (Bunker & Jensen, 1998) (NH3 belongs to (M)) and total angular momentum , we have used both ‘normal mode’ and ‘local mode’ quantum numbers when labelling the energy levels. Our labelling scheme is discussed below.
The structure of the Transition file is simpler. It contains three columns: two give the reference numbers of the upper and lower states as they appear in the Energy file and third contains the Einstein A coefficient (s-1) for the transition (see Table 2). The entries in the Transition files are sorted according to the frequency, and we have split them into 120 small files in order to reduce the amount of data that needs to be handled when examining a specific frequency region.
In the actual TROVE calculations we employed ‘local mode’ basis functions in the FBR representation as explained in detail in Yurchenko et al. (2009). This allowed us to label the energy levels and hence to assign transitions based on the particular basis set making the largest contribution within the appropriate eigenfunction. Our local mode quantum numbers include , , . Here is the projection of total angular momentum onto the molecular symmetry axis; are stretching local mode quantum numbers (Mills & Robiette, 1985) which correlate with the normal mode notation as ; and are deformational bending quanta; is the inversion quantum number equivalent to , where is the normal mode quantum number and is the inversion parity (Yurchenko et al., 2005). Finally, and are the rotational and vibrational symmetries in (M).
Apart from the ‘local mode’ assignment that is generated by TROVE, we also provide the standard normal mode quantum numbers , according with the Herzberg convention (Herzberg, 1945). and are the symmetric stretch and symmetric bend, respectively, whilst and are the asymmetric stretch and asymmetric bend respectively. The additional quantum numbers and are necessary to resolve the degeneracy of the and vibrational states, respectively.
The selection rules which determine the allowed electric dipole transitions of 14NH3 are () with symmetry selection rules, , and . We used the nuclear spin statistical weight factor = 12 and 6 for the and transitions, respectively. The and levels are characterized by , that is, the corresponding transitions do not exist.
It should be noted that our assignments do not always agree with the experimental ones for the following reasons: (i) ambiguous definition of the quantum numbers (apart from and ), which depend on the basis functions used; (ii) strong interactions between ro-vibrational states of close-lying levels; and (iii) mapping between the normal and local mode labels is not always straightforward. The last of these means that it is sometimes difficult to distinguish between the symmetric and asymmetric stretch quantum numbers and .
Column Notation Level number (row) Rotational quantum number, angular momentum Total symmetry in D3h(M) Level number in a block Term value (in cm-1) Normal mode vibrational quantum numbers Vibratiobal angular momenta, normal mode vibrational quantum Inversional parity (0,1) Rotational quantum number (the same as column 2) Rotational quantum number, projection of onto the -axis Rotational parity (0,1) Local mode vibrational quantum numbers (see (Yurchenko et al., 2009)) Symmetry of the vibrational contribution in D3h(M)
| Aif / s-1 | ||
|---|---|---|
8851 |
5949 |
1.56092538E-03 |
8852 |
5949 |
5.48772171E+00 |
8853 |
5949 |
3.32423612E-01 |
8854 |
5949 |
2.71613285E+00 |
8855 |
5949 |
4.45088305E-02 |
5 Line list: Description and Validation
Absorption and emission intensity simulations are temperature-dependent. Specifically, temperature appears in the Boltzmann factors , where is the Boltzmann constant. Line lists, in contrast, do not specify a temperature, since the Einstein coefficients for the transitions are independent of temperature. We therefore need to explain why we refer to BYTe as a ‘hot’ list. The reason is that BYTe is able to describe the absorption/emission processes in NH3 for temperatures up to K. This is because the energy threshold that we have adopted, 8 000 cm-1, ensures that we include all those states that are significantly populated up to .
The temperature coverage of our data can be conveniently checked by using it to compute temperature-dependent partition functions for NH3.
| (2) |
where is the total degeneracy of the state with energy and the sum runs over all energy levels of the molecule. Including all energy levels up to 8 000 cm-1 gives an NH3 partition function, , of 57 944 at 1 500 K. This value is about 5 % below our best estimate for at 1 500 of 61 223. This discrepancy, which rapidly disappears at lower temperatures, is the reason we do not recommend the use of BYTe for temperatures above 1 500 K.
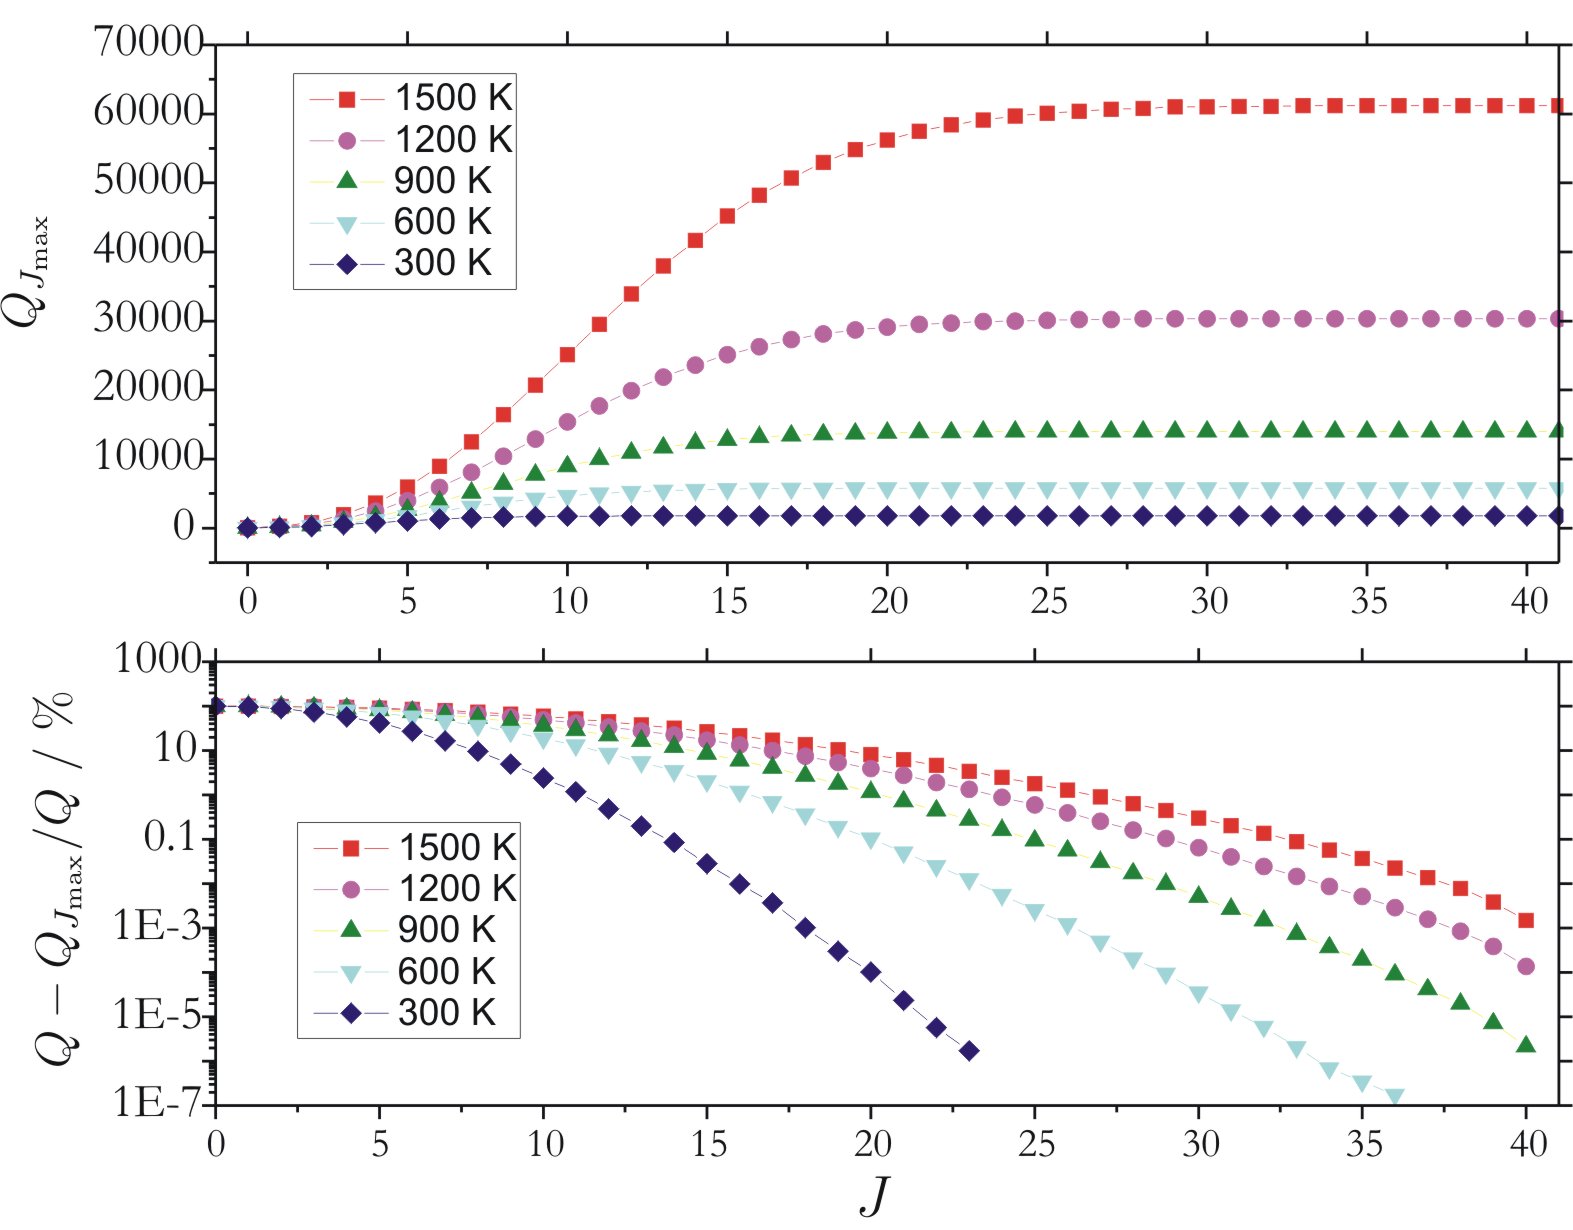
Apart from there are two main contributions that affect the total number of the excited ro-vibrational states accessed in the variational calculations, (i) the size of the vibrational basis set, which BYTe is determined by the polyad number (see Eq.1) and (ii) the size of the rotational basis set, determined by the maximal total angular momentum . Fig. 3 illustrates how the partition function of NH3 depends on for 300 K, 600 K, 900 K, 1200 K, and 1500 K (upper display). For K the contribution to from amounts to less than 1 %, see lower display of Fig. 3, where the relative contributions to the partition function are also shown as percentages. Here we used , where = 41, corresponding to the highest in our variational calculations.
The effect of the vibrational basis set on the partition function is less pronounced: at K and the partition function is converged to better than 0.03 % when testing our choice of basis set size. There are, of course, other factors that give rise to errors in our computed partition functions. One of these is the potential energy function, which is only reasonably accurately fitted to low-lying ro-vibrational levels. We will address the nature of the partition function of ammonia in greater details elsewhere.
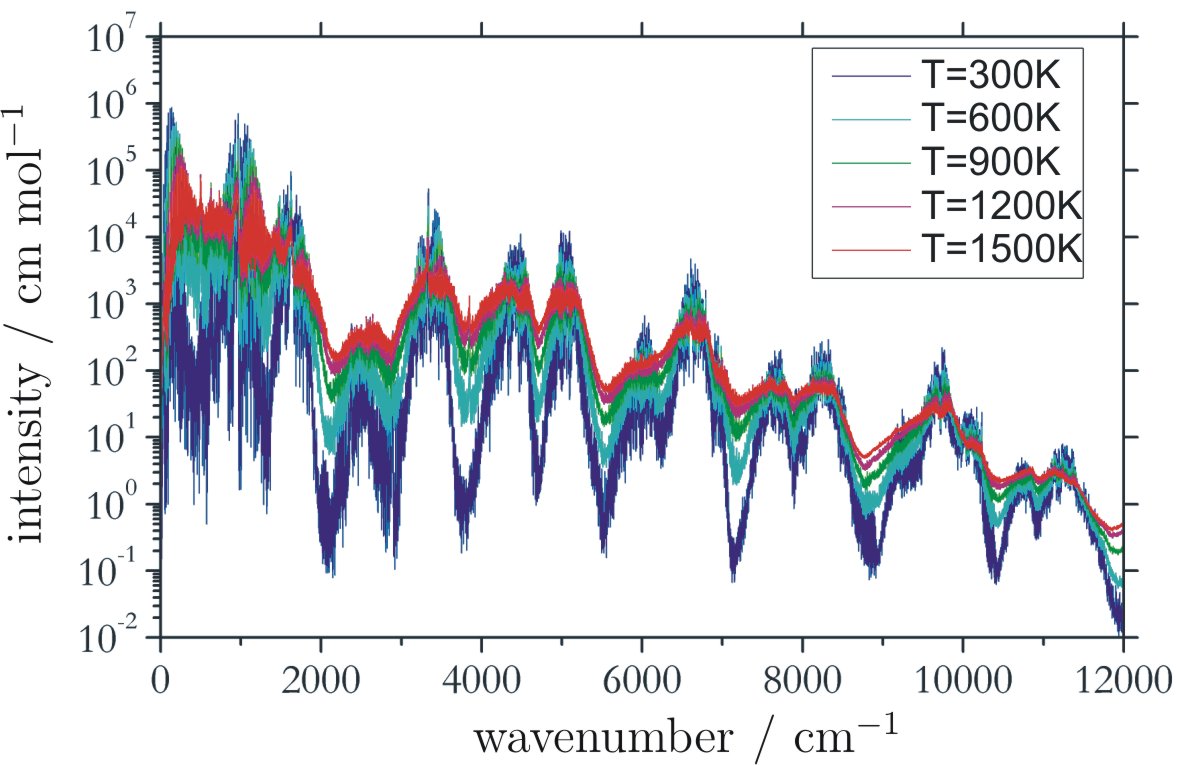
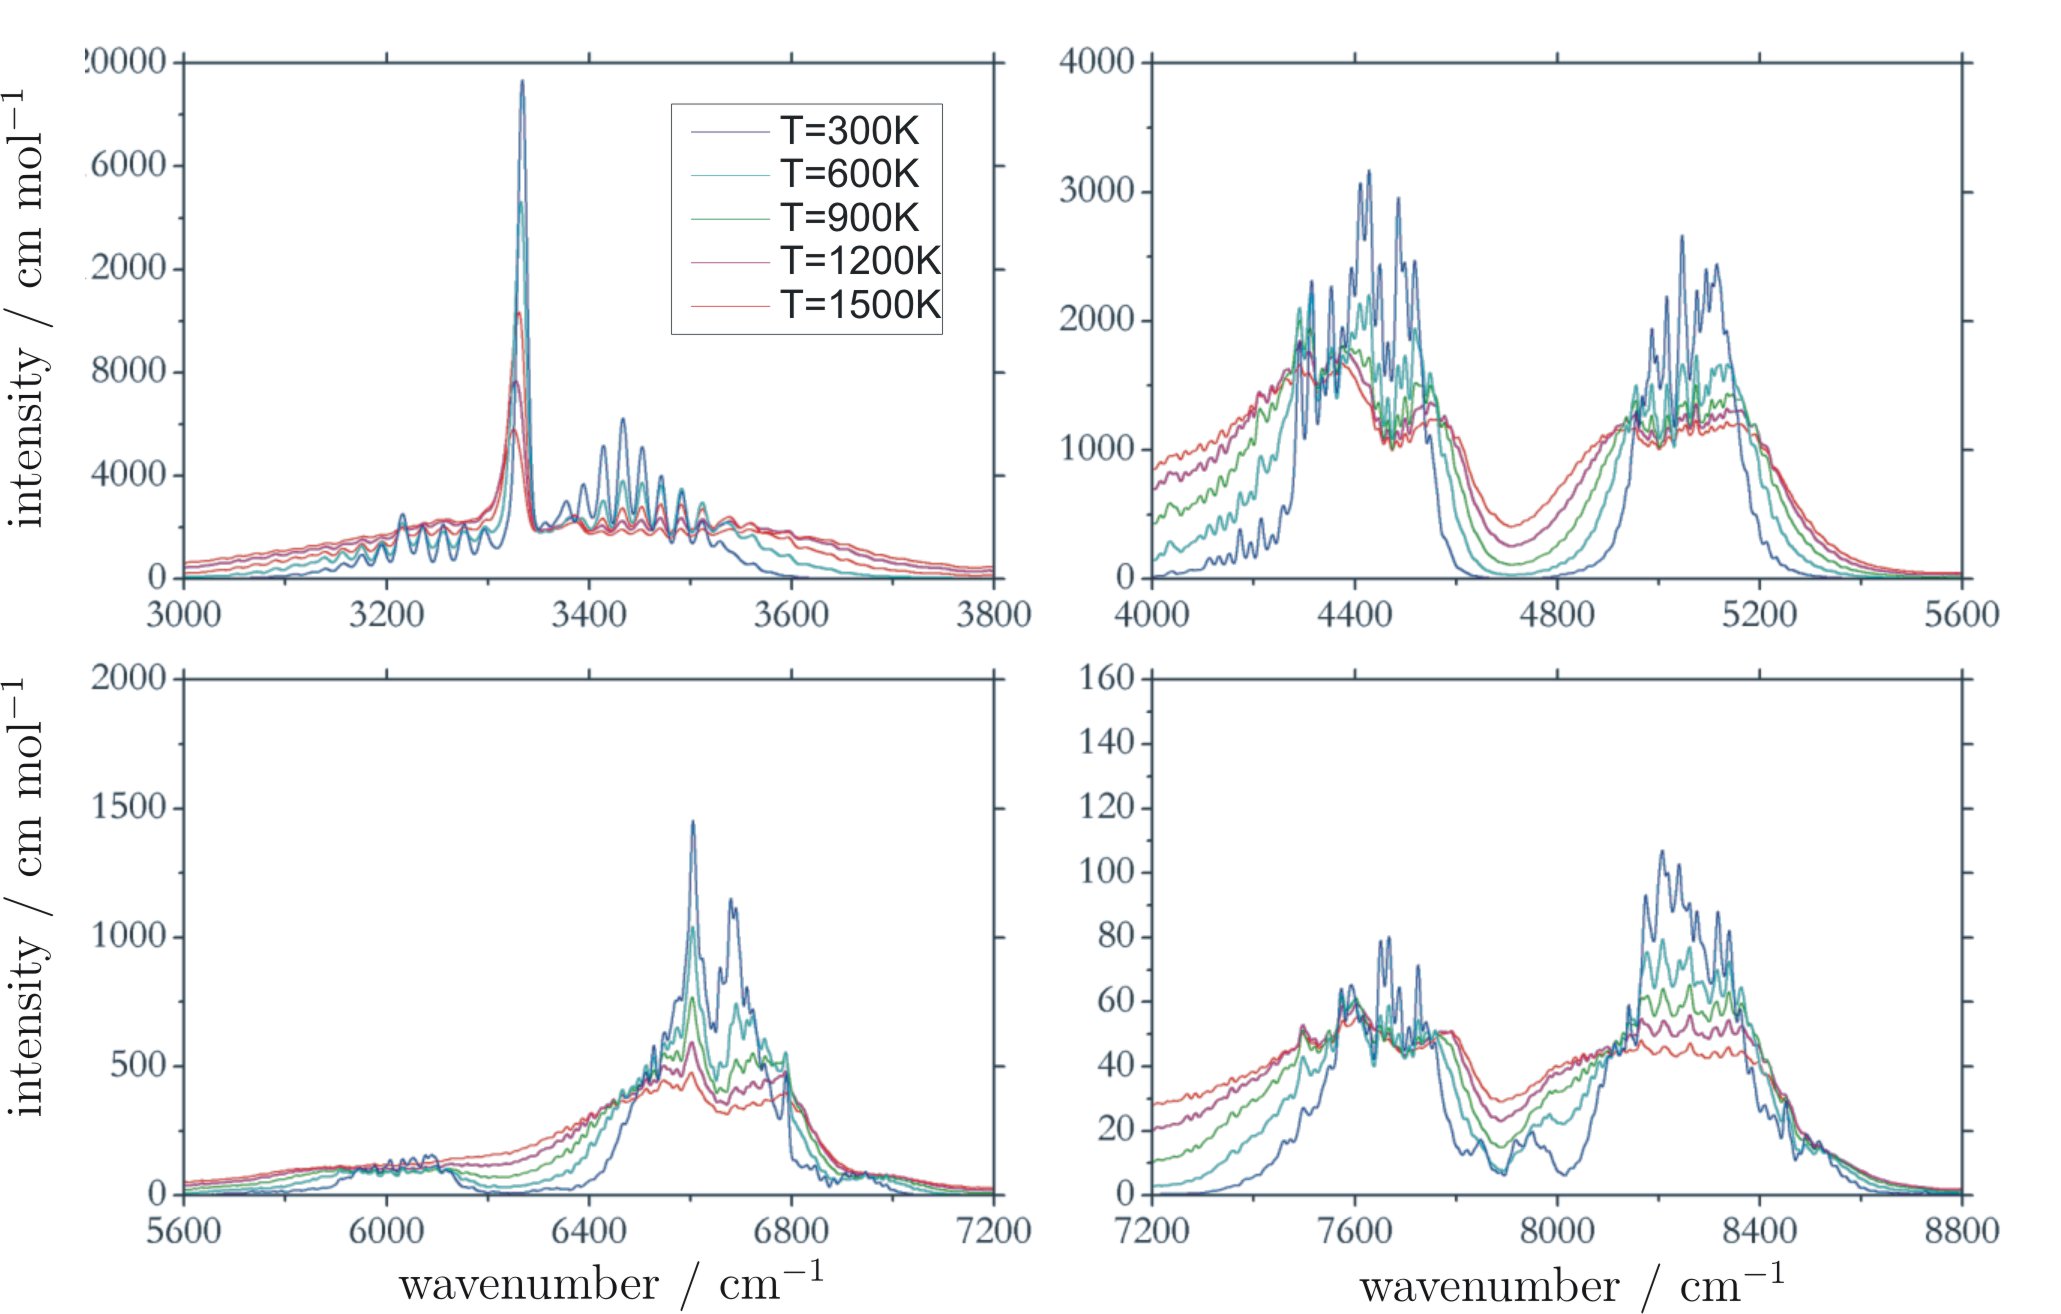
Figs. 4 and 5 illustrate the -dependence of the absorption spectra of ammonia, and give an overview of the complete range as well of the four selected regions computed at 300 K, 600 K, 900 K, 1 200 K, and 1 500 K. As expected, the spectrum profiles at higher become less extreme as the populations from the lower vibrational states are reduced in favour of the vibrationally excited states. Only those few bands that are the most pronounced features at K are still recognizable at K.
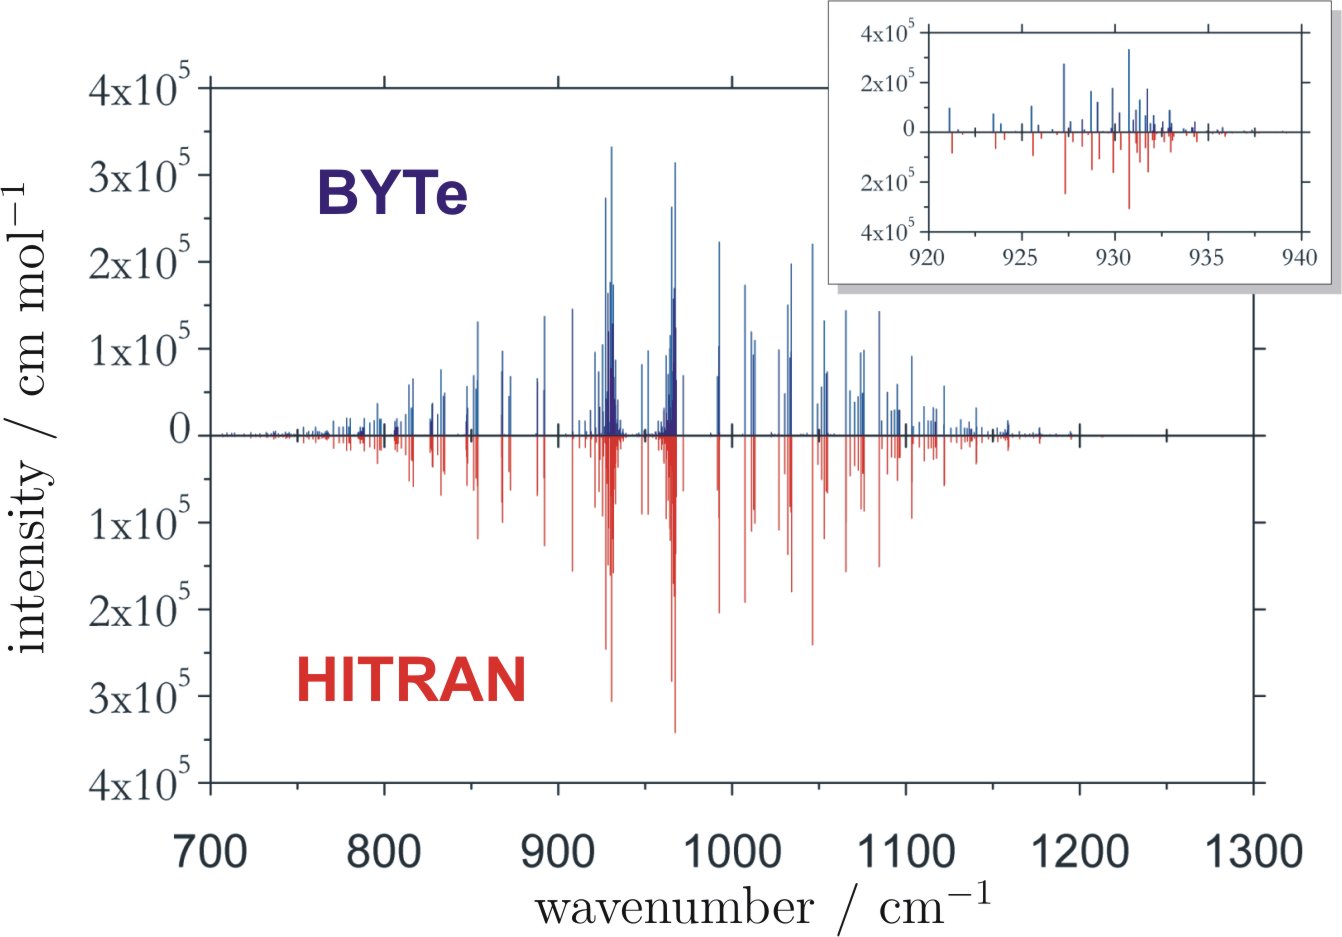
Our ‘cold’ NH3 paper (Yurchenko et al., 2009) contained detailed comparisons with the HITRAN database (Rothman et al., 2009) which demonstrated the accuracy of our procedure and also, that even at 300 K, HITRAN is missing significant NH3 data. In BYTe we have improved our ability to reproduce the HITRAN data, see Fig. 6; however we do not show the entire comparison here.
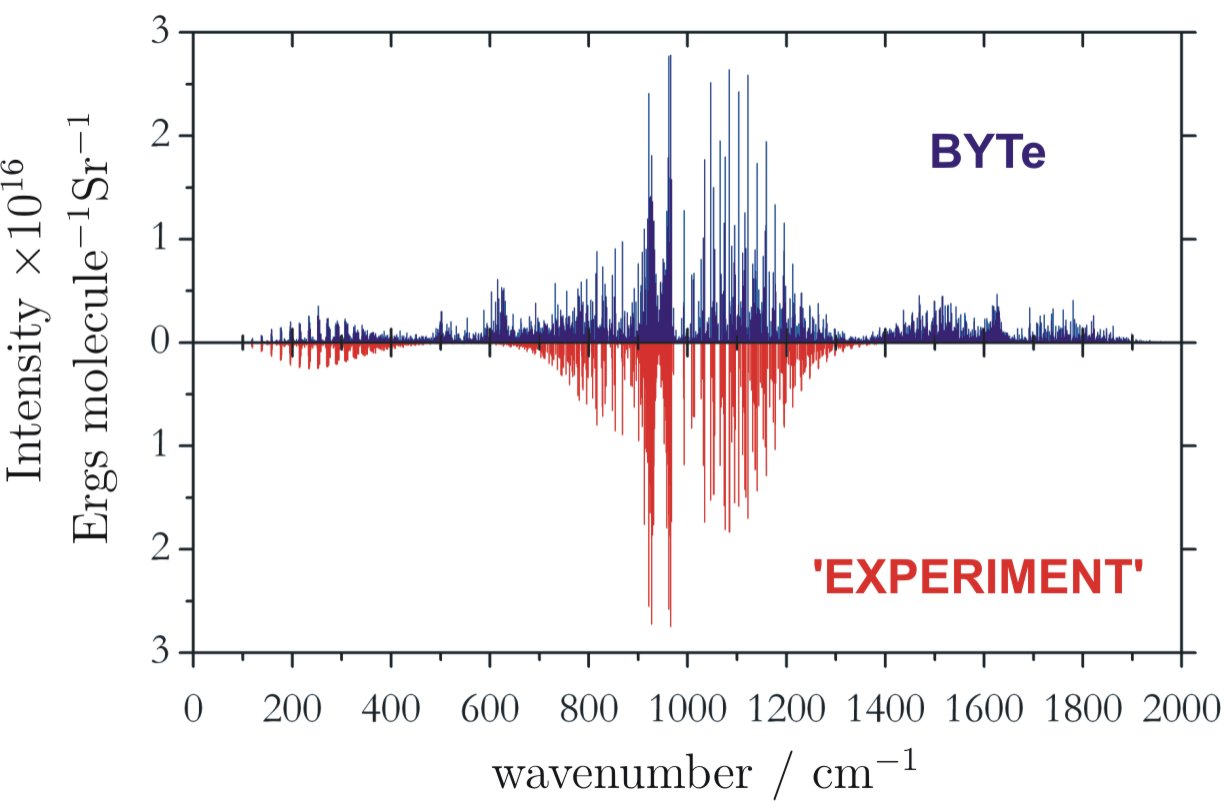
As we were completing our calculations, a high temperature emission spectra of ammonia ( K) for the ground and states of ammonia was reported by Yu et al. (2010). We use this spectrum to provide an independent validation of the BYTe line list. To this end we used BYTe to generate a 900 K synthetic emission spectrum of NH3 in the same spectral region. This is shown in Fig. 7 (lower part). The ‘experimental’ spectrum on this figure was generated using the Einstein coefficients from the synthetic line list reported by Yu et al. (2010). The spectra agree not only qualitatively but also quantitatively in terms of the absolute intensity values. The additional lines in the upper part of Fig. 7 are present because our synthetic spectrum includes all possible transitions falling into the region including hot bands, while Yu et al’s data is only for the ground and states of NH3.
6 Conclusion
We have calculated to a high level of accuracy the frequencies and Einstein coefficients of all the transitions that are present in the emission and absorption spectrum of NH3. The only limitations are: upper states with energies above 18 000 cm-1 are excluded; there is an effective short-end wavelength cut-off of 1 m, due to the incompleteness of our data at frequencies above 10 000 cm-1 (the excluded region is unimportant for NH3), and extremely weak lines have been excluded, which is of little physical significance.
Although the BYTe line list is explicitly aimed at modelling hot ammonia, it improves on our previous cold line list (Yurchenko et al., 2009) in terms of the quality of the potential energy surface used, in the size of the basis sets employed and in the range of frequencies studied. We therefore recommend the use of BYTe for all temperatures up to 1 500 K. The line list is freely available and can download in its entirety or in parts from: http://www.tampa.phys.ucl.ac.uk/ftp/astrodata/BYTe.
Acknowledgments
We thank members of UCL’s Research Computing who have supported this work by giving us extended access to both the Legion and Unity high performance computing systems. We are also grateful to Shanshan Yu for providing her results prior to publication. We thank the Leverhulme Trust for funding this work and STFC for support via a grant to the ”Miracle” computing consortium.
References
- Barber et al. (2009) Barber R. J., Miller S., Dello Russo N., Mumma M. J., Tennyson J., Guio P., 2009, Mon. Not. R. astr. Soc., 398, 1593
- Barber et al. (2006) Barber R. J., Tennyson J., Harris G. J., Tolchenov R. N., 2006, Mon. Not. R. Astron. Soc., 368, 1087
- Beaulieu et al. (2010) Beaulieu J.-P., Tinetti G., Kipping D. M., Ribas I., Barber R. J., Cho J. Y.-K., Polichtchouk I., Tennyson J., Yurchenko S. N., Griffith C. A., Waldmann I., Miller S., Carey S., Mousis O., Fossey S. J., A. A., 2010, Astrophys. J., submitted
- Bonev et al. (2009) Bonev B. P., Mumma M. J., Gibb E. L., DiSanti M. A., G.L.Villanueva Magee-Sauer K., Ellis R. S., 2009, Astrophys. J., 699, 1563
- Bunker & Jensen (1998) Bunker P. R., Jensen P., 1998, Molecular Symmetry and Spectroscopy, 2 edn. NRC Research Press, Ottawa
- Burrows et al. (1997) Burrows A., Marley M., Hubbard W. B., Lunine J. I., Guillot T., Saumon D., Freedman R., Sudarsky D., Sharp C., 1997, Astrophys. J., 491, 856
- Burrows et al. (2003) Burrows A., Sudarsky D., Lenine J. I., 2003, Astrophys. J., 596, 587
- Dello Russo et al. (2004) Dello Russo N., DiSanti M. A., Magee-Sauer K., Gibb E. L., Mumma M. J., Barber R. J., Tennyson J., 2004, Icarus, 168, 186
- Fletcher et al. (2010) Fletcher L. N., Orton G. S., Lisse C. M., Edwards M. L., de Pater I., Yanamandra-Fisher P. A., Fisher B. M., Hammel H. B., 2010, Icarus, submitted
- Herzberg (1945) Herzberg G., 1945, Infrared and Raman Spectra of Polyatomic Molecules. D. Van Nostrand Co. Inc., New York
- Irwin et al. (1999) Irwin P., Calcutt S., Sihra K., Taylor F., Weir A., Ballard J., Johnston W., 1999, J. Quant. Spectrosc. Rad. Trans., 62, 193
- Kawakita & Mumma (2010) Kawakita H., Mumma M. J., 2010, ApJ, in press
- Kawakita& Watanabe (2002) Kawakita H., Watanabe J.-I., 2002, ApJ, 572, L17
- Lara et al. (1998) Lara L. M., Bézard B.and Griffith C. A., Lacy J. H., Owen T., 1998, Icarus, 131, 317
- Lehoucq et al. (1998) Lehoucq R. B., Sorensen D. C., Yang C., 1998, ARPACK Users’ Guide: Solution of Large-scale Eigenvalue Problems with Implicitly Restarted Arnoldi Methods (Software, Environments and Tools). Society for Industrial & Applied Mathematics, U.S., http://www.caam.rice.edu/software/ARPACK/
- Lucas et al. (2010) Lucas P. W., Tinney C., Burningham B., Leggett S., Pinfield D. J., Smart R., Jones H. R. A., Marocco F., Barber R. J., Yurchenko S. N., Tennyson J., Ishii M., Tamura M., Day-Jones A. C., Adamson A., Allard F., Homeier D., 2010, MNRAS, 408, L56
- Lynas-Gray et al. (1995) Lynas-Gray A. E., Miller S., Tennyson J., 1995, J. Mol. Spectrosc., 169, 458
- Madden et al. (1986) Madden S. C., Irvine W. M., Matthews H. E., Brown R. D., Godfrey P. D., 1986, ApJ, 300, L79
- Mills & Robiette (1985) Mills I., Robiette A., 1985, Mol. Phys., 56, 743
- Orton et al. (1995) Orton G., Miller S., Achilleos N., Lam H., Tennyson J., others ., 1995, Science, 267, 1277
- Orton et al. (2010) Orton G. S., Fletcher L. N., Lisse C. M., Chodas P. W., Cheng A., Yanamandra-Fisher P. A., Baines K. H., Fisher B. M., Wesley A., Perez-Hoyos S., de Pater I., Hammel H. B., Edwards M. L., Mousis O., Marchis F., Golisch W., 2010, Icarus, submitted
- Rothman et al. (2009) Rothman L. S., Gordon I. E., Barbe A., Benner D. C., Bernath P. E., Birk M., Boudon V., Brown L. R., Campargue A., Champion J. P., Chance K., Coudert L. H., Dana V., Devi V. M., Fally S., Flaud J. M., 2009, J. Quant. Spectrosc. Radiat. Transf., 110, 533
- Sharp & Burrows (2007) Sharp C. M., Burrows A., 2007, Astrophys. J. Suppl., 168, 140
- Sudarsky et al. (2003) Sudarsky D., Burrows A., Hubeny I., 2003, Astrophys. J., 588, 1121
- Swain et al. (2008) Swain M. R., Vasisht G., Tinetti G., 2008, Nature, 452, 329
- Tinetti et al. (2007) Tinetti G., Vidal-Madjar A., Liang M.-C., Beaulieu J.-P., Yung Y., Carey S., Barber R. J., Tennyson J., Ribas I., Ballester N. A. G. E., Sing D. K., Selsis F., 2007, Nature, 448, 169
- Yu et al. (2010) Yu S., Pearson J., Drouin B., Sung K., Pirali O., Vervloet M., M.-A. M., Endres C. P., Shiraishi T., Kobayashi K., Matsushima F., 2010, J. Chem. Phys., 133, 174317
- Yurchenko et al. (2011) Yurchenko S. N., Barber R. J., Tennyson J., Thiel W., Jensen P., 2011, To be published
- Yurchenko et al. (2009) Yurchenko S. N., Barber R. J., Yachmenev A., Thiel W., Jensen P., Tennyson J., 2009, J. Phys. Chem. A, 113, 11845
- Yurchenko et al. (2005) Yurchenko S. N., Carvajal M., Jensen P., Lin H., Zheng J. J., Thiel W., 2005, Mol. Phys., 103, 359
- Yurchenko et al. (2005) Yurchenko S. N., Carvajal M., Zheng J., Thiel W., Jensen P., 2005, J. Chem. Phys., 122, 104317
- Yurchenko et al. (2007) Yurchenko S. N., Thiel W., Jensen P., 2007, J. Molec. Spectrosc., 245, 126
- Yurchenko et al. (2005) Yurchenko S. N., Zheng J. J., Lin H., Jensen P., Thiel W., 2005, J. Chem. Phys., 123, 134308