Spin-Density Wave near the Vortex Cores of Bi2Sr2CaCu2O8+δ
Abstract
Competition with magnetism is at the heart of high temperature superconductivity, most intensely felt near a vortex core. To investigate vortex magnetism we have developed a spatially resolved probe using nuclear magnetic resonance. Our spin-lattice-relaxation spectroscopy is spatially resolved both within a conduction plane as well as from one plane to another. With this approach we have found a spin-density wave associated with the vortex core in Bi2Sr2CaCu2O8+δ, which is expected from scanning tunneling microscope observations of ”checkerboard” patterns in the local density of electronic states.hof02 We determine both the spin-modulation amplitude and decay length from the vortex core in fields up to T.
pacs:
67.30.hm, 67.30.ht, 43.35.+d, 81.05.RmSuperconductivity and magnetism have been in the forefront of the study of high temperature superconductivity, largely because their interplay is central to the pairing interaction from which superconductivity originates. An important manifestation of this dichotomy can be found near a vortex core where circulating supercurrents create a sufficiently large magnetic field as to suppress the superconducting state, thereby tipping the balance for stability in favor of magnetism.aro97 A number of spin-sensitive, spatially-resolved, probes have been employed to explore this vortex state, including muon spin resonance, small angle neutron scattering, and nuclear magnetic resonance (NMR). These experiments can give the spatial distribution of local magnetic fields, as in the example of the 17O NMR spectrum shown in Fig. 1. This spectrum, as well as results of other methods, are a superposition of local fields from both magnetism and superconductivity and their deconvolution can be quite difficult.
Here, we develop a new approach based on NMR spin-lattice relaxation (SLR) rate spectroscopy. The source for relaxation is the Doppler effect on the nodal quasiparticle excitations and is given by the square of the supercurrent momentum, . Consequently, SLR can be attributed solely to superconductivity. Being two-dimensional, the rate is fully resolved from one superconducting plane to another, a decided benefit in comparison with measurements of the local field which average in three dimensions. Most importantly, SLR has strong spatial contrast increasing with the inverse square distance from the vortex core, . Taking advantage of this spectroscopy, together with measurements of the NMR spectrum of local magnetic fields, we are able to characterize the magnetic spin density wave (SDW) associated with vortices in our sample, consisting of a slightly over-doped, single crystal of the anisotropic high temperature superconductor, Bi2Sr2CaCu2O8+δ (Bi2212), K. Our measurements extend over a wide range of applied magnetic field, 4 T 30 T.
Scanning tunneling microscopy (STM) experiments on Bi2212 at moderate magnetic fields and low temperatures showed that vortices induce a checkerboard pattern of the local density of states with a spatial period of 15 Å 4.hof02 Further STM studies found such electronic ordering in Bi2201han04 and NaCCOCwis08 persisting to non-superconducting dopings and above the superconducting transition temperature. Elastic neutron scattering experimentslak01 ; lak02 ; kha02 on the cuprate superconductor, La214, produced magnetic Bragg reflections corresponding to a periodicity of 30 Å 8. Although spatially unresolved, this result was associated with the checkerboard pattern found from STM on Bi2212, since the period of a spin density wave is expected to be twice that found in the density of states.
There have been many theoretical interpretations for these results including competing SDW and superconducting orderdem01 ; dem02 , a Wigner crystal of Cooper pairs/pair density waveche04 ; tes04 , striped orderingkiv03 , and -density wave checkerboard orderseo07 . More recently, a phenomenological octet model of quasiparticle scattering from the fermi arcsmce03 has gained popularity in interpreting STM and STS results.han09 The octet model fits some STM, STS, and ARPESdam03 results, however, this model does not account for the neutron scattering resultslak02 as well as the STM results of NaCCOCwis08 . It has been suggestedsac02 that, by increasing the applied magnetic field, magnetic order might be ”tuned” and further suppress superconducting order. Since NMR is a bulk, spin-sensitive probe and can be performed up to high field, it is ideal for investigation of the vortex states of high temperature superconductors. In the present work, we exploit these capabilities of NMR in addition to its potential for spatial resolution.
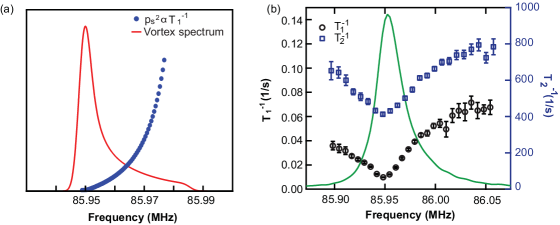
In the case of an ideal, non-magnetic, superconductor with straight vortex lines that form a two-dimensional lattice, the lowest frequencies of the NMR spectrum, Fig. 1(a,b), come from the resonant nuclei in the sample positioned furthest from the vortex cores; the highest frequency components are from the nuclei closest to the vortex cores where the field is highest; and the peak corresponds to a saddle-point in the distribution of frequencies , where is the nuclear gyromagnetic ratio. This relation between spatial positions in the vortex lattice unit cell and the NMR frequency is well-established.bra91 However, contributions to the local fields from magnetism associated with vortex cores must be accounted for independently.
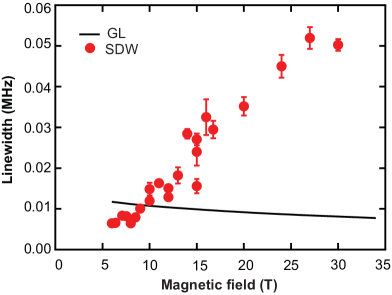
A clear indication that such contributions exist in Bi2212 is evident from the spectrum of the central transition for the O(1) planar site of 17O NMR, Fig. 1(b) and in the linewidths, Fig. 2. We find the distribution of local magnetic fields to be much greater than that expected for vortex supercurrents alone. Moreover, the linewidth increases systematically with applied magnetic field, rather than decreasing as would have been the case for supercurrents represented by the solid curve in Fig. 2. Secondly, in Fig. 1(b) and Fig. 4, the SLR rate, , is strongly non-monotonic across the spectrum contrary to predictionsmor00 for -wave superconductors without magnetic vortices, Fig. 1(a). Since SLR is from Doppler-shifted, nodal quasiparticles, it must increase smoothly and monotonically with decreasing distance approaching the vortex core (see supporting online materials). Thirdly, it is expected that the dominant interaction for spin-spin relaxation is from vortex vibrations which are also determined by vortex supercurrents.lu06 Although there is not yet a quantitative theory for spin-spin relaxation, nonetheless it should mimic SLR. From Fig. 1(b), the strong similarity between the two rate profiles indicates that this is correct. As with SLR, the spin-spin relaxation rate is not a monotonic function of local field.
From these results we infer that the local field distribution is not that of an ideal superconductor and has substantial magnetic contributions. Furthermore, the well-defined correlation between NMR relaxation and position in the spectrum requires that these additional contributions be closely associated with vortices. In fact, the non-monotonic behavior of the relaxation rate profiles can only be understood if the vortex local fields are oscillatory. We find that a spin-density wave model for vortex magnetism can completely describe both field distribution (spectrum) and supercurrent distribution (SLR) and thereby characterize the vortex, spin-density wave state in Bi2212.
In order to model the measured local field distributions, we construct a spin ”checkerboard” cosine wave decaying as a gaussian away from the vortex core. Consistent with STM and elastic neutron scattering measurementshof02 ; lak02 we take the period to be Å and allow the amplitude and range of the spin-density modulation to be free parameters for fitting to the NMR spectra,
| (1) |
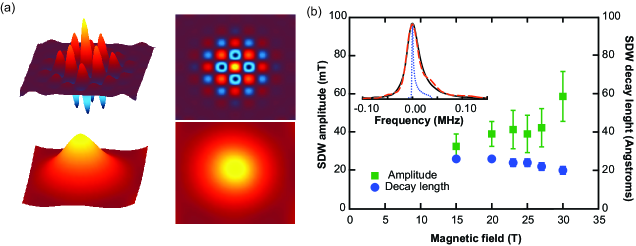
where is the amplitude of the magnetization at the vortex core and is its decay length. Eq. 1 produces a SDW magnetic field component as shown in the upper part of Fig. 3(a).
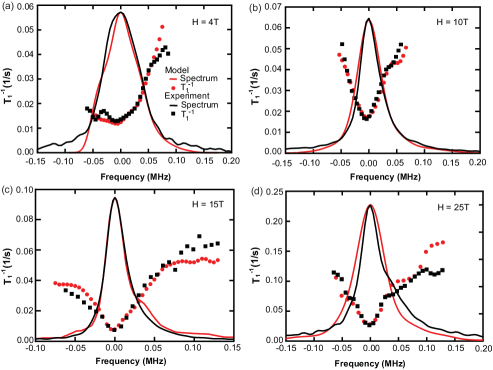
We also include in our fitting the local magnetic field distribution from diamagnetism of the vortex supercurrents and we add this contribution to Eq. 1 at each position in the vortex unit cell before fitting to the data. The supercurrent diamagnetism was calculated using Brandt’s algorithm obtained by solving the Ginzburg-Landau (GL) equations for an ideal vortex latticebra97 and is shown at 15 T in Fig. 3(a) for a quantitative comparison with the corresponding SDW. To find the proper fitting parameters, we calculated the spectra for the GL solution plus SDW for many different values of and and we used a chi-squared test to find the parameters shown in Fig. 3(b). With increasing applied field there is an increase in and a nearly constant , approximately twice the superconducting coherence length, Å. We then calculated the SLR rate being proportional to , plus a constant offset, at each applied magnetic field where the supercurrent momentum is also calculated from GL theory. Multiple values of the calculated SLR rate, within each of 32 contiguous intervals of local field, were averaged and then presented as a single value to be compared with the data in Fig. 4. Over the entire range of applied field we capture an excellent representation of both the field distribution and the relaxation profiles with just two parameters, despite the unusual non-monotonic behavior of the SLR rate as a function of frequency (local field).
There are three ranges of applied magnetic field which characterize different profiles of across the NMR spectrum, depending on the relative contributions of the diamagnetic local fields and the vortex-induced magnetic contribution . At low magnetic fields, 4-6 T, when , resembles the near monotonic behavior expected for a -wave superconductor without magnetic vortices,mor00 see Fig. 1(a). Upon increasing the external magnetic field to 6-12 T there is a sharp increase of on the low frequency side of the spectrum in the range where . Finally, at high magnetic fields, 15-30 T, there is a significant increase of on both low and high frequency sides of the spectrum corresponding to . Measurements in YBCO have revealed a small upturn in at low frequency, but much less pronounced than what we report here for Bi2212. In the YBCO work, contamination on the low frequency side of the spectrum from quadrupolar transitions precluded an unobstructed view of the magnetic field distributions over the same wide range as is possible with Bi2212. We think it is possible that vortices in YBCO are accompanied by a SDW checkerboard pattern which has not been resolved in these earlier NMR experiments.
In summary we have shown that a spin-density wave can be associated with vortices in Bi2212 which accounts for both the NMR spectrum and NMR relaxation behavior as a function of local magnetic field. The SDW amplitude increases with applied field and its spatial range is nearly constant at up to T. These results establish a link between previously reported checkerboard STM patternshof02 and spin-dependent elastic neutron scattering in a cuprate superconductorlak02 and provide a detailed characterization of magnetic vortices in Bi2212.
I ACKNOWLEDGEMENTS
We thank H. Alloul, C.A. Collett, M.R. Eskildson, W.J. Gannon, J.E. Hoffman, J.B. Ketterson, Jia Li, K. Machida, V.F. Mitrović, D.K. Morr, J. Pollanen, J.A. Sauls, Z. Tešanović, and O. Vafek for helpful discussions. This work was supported by the Department of Energy, contract DE-FG02-05ER46248 and the National High Magnetic Field Laboratory, the National Science Foundation, and the State of Florida.
The authors declare no competing financial interests
II Author Contributions
Experiments were carried out by A.M.M., S.O., S.M., W.P.H., A.P.R. and P.L.K. Samples were provided by K.F., M.I., and S.U.
References
- (1) Hoffman, J. E. et al. A four unit cell periodic pattern of quasi-particle states surrounding vortex cores in Bi2Sr2CaCu2O8+δ . Science 295, 466–469 (2002).
- (2) Arovas, D. P., Berlinsky, A. J., Kallin, C. & Zhang, S.-C. Superconducting vortex with antiferromagnetic core. Phys. Rev. Lett. 79, 2871–2874 (1997).
- (3) Brandt, E. H. Precision Ginzburg-Landau solution of ideal vortex lattices for any induction and symmetry. Phys. Rev. Lett. 78, 2208–2211 (1997).
- (4) Hanaguri, T. et al. A ’checkerboard’ electronic crystal state in lightly hole-doped Ca2-xNaxCuO2Cl2. Nature 430, 1001–1008 (2004).
- (5) Wise, W. D. et al. Charge-density-wave origin of cuprate checkerboard visualized by scanning tunnelling microscopy. Nature Physics 4, 696–699 (2008).
- (6) Lake, B. et al. Spins in the vortices of a high-temperature superconductor. Science 291, 1759–1762 (2001).
- (7) Lake, B. et al. Antiferromagnetic order induced by an applied magnetic field in a high-temperature superconductor. Nature 415, 299–302 (2002).
- (8) Khaykovich, B. et al. Enhancement of long-range magnetic order by magnetic field in superconducting La2CuO4+y. Phys. Rev. B 66, 014528 (2002).
- (9) Demler, E., Sachdev, S. & Zhang, Y. Spin-ordering quantum transitions of superconductors in a magnetic field. Phys. Rev. Lett. 87, 067202 (2001).
- (10) Zhang, Y., Demler, E. & Sachdev, S. Competing orders in a magnetic field: Spin and charge order in the cuprate superconductors. Phys. Rev. B 66, 094501 (2002).
- (11) Chen, H.-D., Vafek, O., Yazdani, A. & Zhang, S.-C. Pair density wave in the pseudogap state of high temperature superconductors. Phys. Rev. Lett. 93, 187002 (2004).
- (12) Tešanović, Z. Charge modulation, spin response, and dual hofstadter butterfly in high-Tc cuprates. Phys. Rev. Lett. 93, 217004 (2004).
- (13) Kivelson, S. A. et al. How to detect fluctuating stripes in the high-temperature superconductors. Rev. Mod. Phys. 75, 1201–1241 (2003).
- (14) Seo, K., Chen, H.-D. & Hu, J. -wave checkerboard order in cuprates. Phys. Rev. B 76, 020511 (2007).
- (15) McElroy, K. et al. Relating atomic-scale electronic phenomena to wave-like quasiparticle states in superconducting Bi2Sr2CaCu2O8+δ. Nature 422, 592–596 (2003).
- (16) Hanaguri, T. et al. Coherence factors in a high-Tc cuprate probed by quasi-particle scattering off vortices. Science 323, 923–926 (2009).
- (17) Damascelli, A., Hussain, Z. & Shen, Z.-X. Angle-resolved photoemission studies of the cuprate superconductors. Rev. Mod. Phys. 75, 473–541 (2003).
- (18) Sachdev, S. & Zhang, S.-C. Superconductivity: Tuning order in cuprate superconductors. Science 295, 452–454 (2002).
- (19) Brandt, E. H. Magnetic-field variance in layered superconductors. Phys. Rev. Lett. 66, 3213–3216 (1991).
- (20) Morr, D. K. & Wortis, R. Theory of NMR as a local probe for the electronic structure in the mixed state of the high-Tc cuprates. Phys. Rev. B 61, R882–R885 (2000).
- (21) Lu, T. & Wortis, R. Calculated NMR T2 relaxation due to vortex vibrations in cuprate superconductors. Physical Review B (Condensed Matter and Materials Physics) 74 (2006).
- (22) Mitrović, V. F., Sigmund, E. E. & Halperin, W. P. Progressive saturation NMR relaxation. Phys. Rev. B 64, 024520 (2001).
- (23) Mounce, A. et al. Charge induced vortex lattice instability. Nature Physics (2010). URL (preprint)http://arxiv.org/abs/1009.4727.
- (24) Chen, B. et al. Two-dimensional vortices in superconductors. Nature Physics 3, 239 (2007).
- (25) Volovik, G. E. Superconductivity with lines of gap nodes: density of states in the vortex. Pis’ma Zh. Eksp. Teor. Fiz. 58 (1993).
- (26) Curro, N. J., Milling, C., Haase, J. & Slichter, C. P. Local-field dependence of the 17O spin-lattice relaxation and echo decay rates in the mixed state of YBa2Cu3O7. Phys. Rev. B 62, 3473–3479 (2000).
- (27) Mitrović, V. F. et al. Spatially resolved electronic structure inside and outside the vortex cores of a high-temperature superconductor. Nature 413, 501–504 (2001).
III Supporting Online Materials
IV Materials and Methods
Our Bi2Sr2CaCu2O8+δ sample was post-processed by isotope exchange in 1 bar of flowing 17O ( 90% enriched) at 600 ∘C for 48 h followed by annealing for 150 h at 450 ∘C resulting in a superconducting transition temperature K. Spatially resolved and measurements were taken by Fourier transforming progressive saturation and Hahn echo sequences, respectively, with 16-pulse, phase alternation. Spectra from the central transition of the planar oxygen O(1) were acquired for a wide range of relaxation recovery times and then the frequency domain of each one was subdivided into 32 intervals. The recovery profiles in each interval were fit to a progressive saturation recoverymit01a for and an exponential for . Experiments presented here were performed at the National High Magnetic Field Lab in Tallahassee, Florida and at Northwestern University for fields from 4 to 30 T at a temperature of 4.2 K. The spectra were taken using a frequency sweep technique. Before taking data at a particular applied magnetic field, we heated the sample above for 10 min followed by quench cooling to 4.2 K. This procedure consistently produced reproducibly narrow spectra through many field cycles for which one indication is the systematic dependence of the linewidth on magnetic field, Fig. 2. Data for some fields were also acquired at different temperatures, but are not reported here. Measurements were also taken at magnetic fields below those shown in Fig. 2 and are reported separately mou10 .
Spectra from the oxygen sites,che07 O(1) in the CuO2 plane and O(2) in the SrO plane, are well-resolved at K. At lower temperatures the central transitions overlap. Discrimination between O(1) and O(2) can be achieved by saturation of the O(2) resonance which is only weakly coupled to the electronic excitations in the CuO2 plane and has an order of magnitude smaller compared to O(1). The relative intensities of the central and quadrupolar satellites in the O(1) spectrum, which do not overlap with the O(2) spectrum, are monitored down to 4.2 K to assure that the O(1) central transition has no contribution from O(2).
V NMR linewidth
The temperature of the transition from vortex liquid to vortex solid has been determined as a function of magnetic field by Chen et al.che07 in Bi2212, signaled by an abrupt increase in linewidth with decreasing temperature. In the liquid state the time scale for vortex dynamics is much shorter than that of the NMR measurement, thereby averaging the local magnetic fields associated with vortices. The experiments reported here are performed in the vortex solid phase.
It is instructive to compare the linewidth for 17O NMR reported here with that measured in YBCO in the normal state for various cations (Zn, Ni, and Li) substituted for copper in the CuO2 plane generating an impurity local moment that contributes to the lineshape. The 17O NMR broadening we observe in Bi2212 is similar in magnitude to that reported for Zn in YBCO at the same field. For this comparison we make an adjustment for the vortex concentration (Bi2212) to be the same as the cation impurity concentration (YBCO). We assume the same hyperfine coupling for Bi2212 and infer, based on the NMR spectrum alone, that the vortex core could be modeled as a local impurity with moment of . By local impurity we mean a perturbation that induces local field, RKKY-type oscillations with period , which is about a factor of four smaller than the modulation period we use here. Although our analysis does not allow the numerical freedom to independently choose the period of the modulation for all applied fields, nonetheless, at the highest magnetic fields we can perform a analysis to simultaneously fit the measured SLR rate and the spectrum in terms of the model of Eq. 1. We find that the oscillation period is then constrained to be Å, as might be expected from the reports from STM and elastic neutron scattering.hof02 ; lak02
VI NMR relaxation
Spatially resolved NMR relaxation experiments have been carried out on YBCO aligned powders in previous work.cur00 ; mit01a ; mit01b However, the present single crystal samples of BSCCO show significantly higher quality results, in part because the quadrupolar satellites are fully resolved. Nonetheless, both the YBCO and Bi2212 measurements at low temperatures, K, and at high magnetic fields, T, consistently indicatemit01a ; mit01b that at each frequency position in the spectrum, is a constant and that increases with applied magnetic field uniformly across the spectrum, except in the vortex core region. This quadratic field dependence has been attributed to the Zeeman shift in the nodal quasiparticle (NQ) energy.mit01a ; mit01b The mechanism for relaxation with nodal quasiparticles includes thermal, Zeeman, and Doppler contributions. Based on the above observations, at fixed applied magnetic field, the dependence of the SLR rate on position in the vortex unit cell can be attributed to the Doppler shift in the NQ energy, . Since the SLR rate depends on the square of the local density of states (LDOS) and the LDOS is linear in the NQ energy, then the Doppler contribution to the SLR rate is as displayed in Fig. 1(a). These arguments are presented in more detail by Mitrovic et al.mit01a
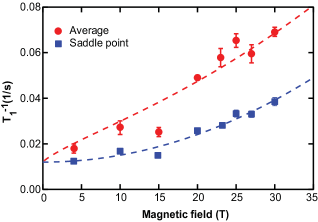
The time derivative of the measured relaxation profile in the limit of short times, averaged over the entire spectrum, gives the average SLR rate. This is proportional to the average of the square of the LDOS over the vortex unit cell whose spatial area is itself proportional to applied magnetic field. Volovikvol93 pointed out that such an average is dominated by the Doppler term in the electronic excitation energy. In Fig. 5 we show the magnetic field dependence of the average SLR rate, red points, together with the Zeeman contribution to the rate, green points, measured at the peak in the spectrum, i.e. the saddle point. The difference between the data sets is due to the Volovik effect following the expected log behavior which we show, together with the Zeeman contribution, as the (red) dashed curve in the figure. This agreement confirms that the Doppler effect on NQ is a principal mechanism for relaxation and depends on position in the vortex unit cell. Consequently, a measurement of can distinguish between atoms in the NMR signal that are at different positions relative to the vortex core thereby providing spatial resolution within the CuO2 plane.