Photonic Crystals with Controlled Disorder
Abstract
Photonic crystals are extremely sensitive to structural disorder even to the point of completely losing their functionalities. While on one side this can be detrimental for applications in traditional optical devices, on the other side, it gives also rise to very interesting new physics and maybe even new applications. We propose a route to introduce disorder in photonic crystals in a controlled way, by creating a certain percentage of vacancies in the lattice. We show how the method works and what type of materials can be obtained this way. Also we characterize the resulting transport properties from various points of view, including measurements of the transport and scattering mean free path and the diffusion constant.
pacs:
42.25.Dd, 42.25.Bs, 42.25.Fx, 06.30.Gv, 66.30.hI I. INTRODUCTION
Numerous applications of photonic crystals Yablo ; John have been proposed, based on their ability to control ballistic light transport. In practice, most photonic crystals contain a certain amount of intrinsic disorder, which gives rise to multiple light scattering and light diffusion Koenderink . An extraordinary progress has been made in the fabrication of nano-photonic structures, with many novel optical properties Review . Using engineered disorder by introducing defects of controlled amount, position, shape, and other morphological characteristics can, however, lead to interesting new functionalities Florendefects ; Noda . The extreme case of disorder is that of a photonic glass, in which the building blocks are perfect spheres which are distributed randomly PG2 . In such systems, light undergoes multiple resonant Mie-scattering due to the equal shape and size of its scatterers Sapienza .
While light propagation in photonic crystals is described by Bloch-modes, transport in photonic glasses is dominated by random multiple scattering. Random systems also exhibit interference effects, of which maybe the most dramatic is that of Anderson localization of light waves, in which interference brings light transport to a complete halt Anderson . The combination of a photonic crystal and a certain amount of random multiple scattering is believed to be the key to observe optical Anderson localization John : the presence of a photonic bandstructure can lead to a strongly reduced diffusion constant compared to an equivalent random system without the underlying periodic backbone Toninelli . While Anderson localization requires very strongly scattering materials, the interplay between order and disorder is mostly unknown, even at low refractive index, far away from the predicted Anderson localization transition,
In this paper we show a method to obtain structures in between a photonic crystal and a photonic glass, by adding a small amount of controlled defects, and to characterize the topology of the resulting optical properties. The paper is organized as follows: In section II, we will show how to introduce extrinsic disorder in photonic crystals as vacancies in the lattice and how to analyze the topological disorder of such structures. In section III we will show measurements of the static transport properties, in particular the scattering mean free path. In section IV we will report on measurements of the diffusion constant in photonic crystals as a function of the density of vacancies. In section V, we will show total white light transmission measurements from photonic glasses and photonic crystals with a high amount of vacancies.
II II. VACANCY-DOPED PHOTONIC CRYSTALS
II.1 Sample preparation
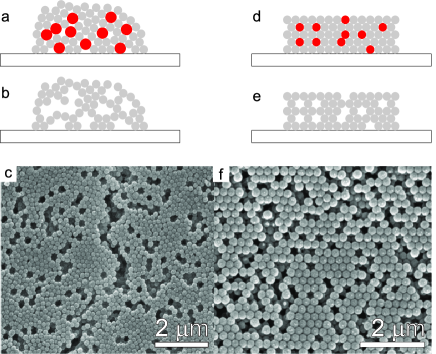
An alloy photonic crystal BBlaader ; BOzin ; BSpin is grown with a binary colloid that consists of spheres of two types. Compared to the crystals which are composed by single-specie spheres, binary crystals exhibit a rather rich phase behavior that depends on the volume fractions of the constituents, in particular on their diameter ratio. If the constituents are chemically different but of the same diameter, it is possible to obtain also a regular lattice of which, after crystal growth, one of the constituents can be chemically removed. The one constituent that is removed acts in that sense as a dopant, since it introduces vacancies in the lattice. Fig. 1a-b and 1d-e schematize the process. Binary colloidal suspensions of polymethyl-methacrylate (PMMA) and polystyrene (PS) spheres were ordered by vertical deposition Vertical . This method allows us to grow large homogenous 3D alloys with appreciable thickness. The total colloidal concentration in the liquid is typically set fixed at , and the density of dopants (PS spheres, in this case) is tuned by changing the partial PS concentration in the initial colloidal suspension. For example, if a final vacancy density is needed, a partial PS spheres concentration of and PMMA concentration of will be mixed to obtain a total colloidal suspension. Once the alloy colloidal crystal is grown, the PS spheres are removed by selective chemical etching, by immersing the samples in pure Cyclohexane for, at least, 4 h. This very easy procedure completely removes the PS spheres, leaving the PMMA spheres undisturbed. Scanning electron microscopy (SEM) image Fig. 1f shows a colloidal crystal realized with of PS spheres and of PMMA spheres after PS etching. In that case, both PMMA and PS spheres had the same diameter , with an error included in the polidispersity of each of the spheres ( of the sphere diameter).
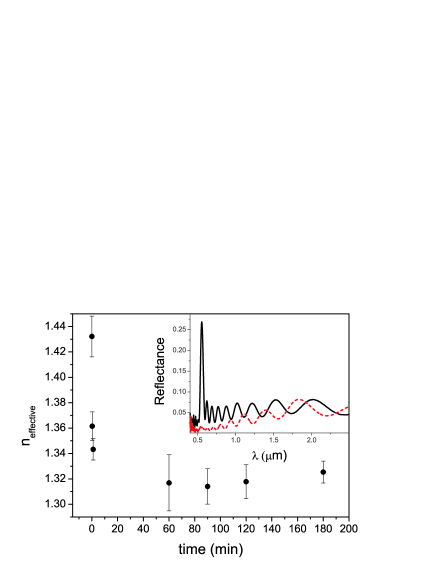
The selective etching of PS spheres can be conveniently monitored optically, during the etching process. At low energies, far from the first stopband, the sample can be considered as a homogenous thin layer with effective refractive index . This can be measured by recording the spectral separation of the Fabry-Perot fringes in the transmittance or reflectance spectra, which depend on the optical thickness of the sample and thereby both on its physical thickness and refractive index. Local reflectance maxima of the Fabry-Perot fringes will appear at (for an opal on a substrate with a refractive index higher than that of the opal Born ):
| (1) |
where m is the resonance order, L is the sample thickness and is the wavelength of the m-resonance. A linear relation is obtained by plotting the inverse of as a function of m, which slope yields the inverse of the sample thickness and . The initial of the alloy crystal, composed by PS and PMMA spheres (Fig. 1d), can be calculated from the partial concentration of each type of spheres, their refractive index: and , and the total filling fraction of spheres in the crystal . This gives us a precise estimation of the sample thickness, which remains constant during the etching process. The evolution of the etching can then be follow by monitoring the value of with time, using Eq. 1 with this initial value of L. Fig. 2 shows the effective refractive index for a thin film initially composed of of PMMA spheres and a of PS spheres, both of diameter . The figure reveals that the etching is complete after few minutes, when reaches a constant value. The inset of Fig. 2 shows the reflectance spectrum from the composite before (black-solid curve) and after (red-dashed curve) complete PS removal. Apart from the disappearance of the reflectance peak related to the first stopband in the direction (which will be the object of attention in the following section), a blue shift in the Fabry-Perot fringes clearly shows the significant change in . The final vacancy-doped photonic crystals (Fig. 1f) have typically the same dimensions as a thin photonic crystal film, that is, they have a thickness of several microns and can be several centimeters wide. The vacancies are distributed homogeneously throughout the structure.
II.2 Optical characterization
As a first characterization of our samples we have recorded standard angular dependent reflection and transmission spectra. In particular, we recorded the specular reflectance, , and transmittance, , of light with wavelength from to in the direction perpendicular to the sample surface () and in the low energy range (, where is the lattice parameter). This measurement directly gives the amount of light lost from this particular direction which, due to elastic scattering, propagates in other directions different than the incident one. By increasing the amount of vacancies in the crystal lattice, the amount of light scattering increases as we will discuss later.
The analysis carried out in the present section will tackle the measurement of the amount of remaining order in the bulk of the structure. The magnitude can be used to estimate the amount of remaining order GalisteoPRB ; AstratovPRB if absorption and higher-order Bragg scattering can be neglected. In that case, the diffuse light intensity is simply , which accounts for the losses due to elastic light scattering from the lattice vacancies which act as the scatterers note . Note that one expects the diffuse intensity to be non-zero also for samples without intentionally introduced defects (our samples with zero percent vacancies), due to residual polidispersity and various sample imperfections that are common for even the most accurately prepared photonic crystal opals Koenderink .

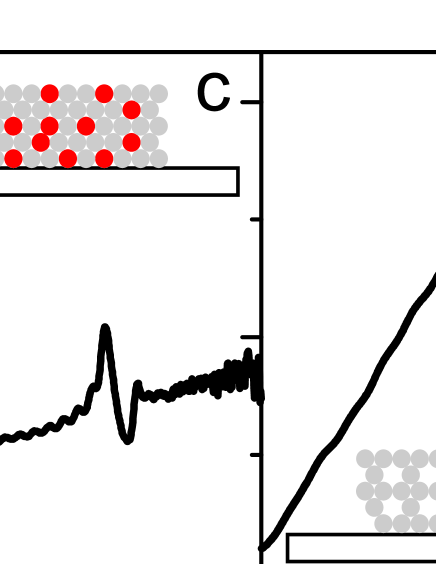
Fig. 3a and 3b show and measurements from samples doped with a and of vacancies, respectively. The disappearance of the reflectance (transmittance) peak (dip) related to the pseudogap in the direction is the first and most evident effect of increased disorder. Fig. 3c plots D, proportional to the light loses, which presents the usual features for a finite opal GalisteoPRB : a monotonic increase for frequencies outside the gap, attributed to Rayleigh-Gans type of scattering, the presence of a dip at for polymeric spheres which accounts for a reduction of scattering losses inside the gap and two peaks at the band edges which represents an increase of scattering at these spectral positions. Here we are measuring light which is lost from the initial direction and diffuses through the crystal. Therefore, the asymmetry between the high and the low energy band edges can be explained by examining the photonic band structure in other crystallographic directions close to the incident one. For light incident in the direction, scattered photons in the low energy band-edge find allowed states in adjacent directions when a small momentum is acquired. At the high energy band-edge, the additional momentum needed for a scattered photon to couple to a Bloch mode in other directions is larger and the process for this frequency becomes less probable than the former. This is the reason which, qualitatively, explains this asymmetry. For a high amount of vacancies, Fig. 3d reveals the disappearance of any hint of gap or band-edges features and shows the increase of scattering losses for all frequencies. The higher the relative concentration of PS, the more abrupt the transition is: when increasing disorder, constructive and destructive interference is averaged out giving rise to an effective medium behavior and losses increase monotonically with energy.
III III. Static measurements: Scattering mean free path
The measurements of the reflectance and transmittance coefficient as reported in the previous section can be used also to determine the scattering mean free path , defined as the length over which a light beam can propagate inside the sample before it is scattered due to randomness PRBscattering . To that end the reflectance and transmittance are recorded in the way described in section II.2, now studied versus the thickness of the sample (see Fig. 4). Specular and (similar to those from Fig. 3a and b) are taken in adjacent regions in a set of samples with a vacancy density from to . Adjacent regions have a different amount of stacked layers and are visible by optical microscope inspection as terraces on the sample surface. The thickness of such films is assessed by measuring the density of Fabry-Perot fringes, which is crucial to provide the exact thickness, , of the tested region. The thickness can also be determined in an alternative and independent way by simply counting the terraces on the photonic crystal, since each terrace corresponds to a thickness increase by one layer (see Fig. 4b). The accuracy in the determination of the thickness is in that case limited by the cumulative effect of the sphere polydispersity ().
The analysis of the thickness dependence of reflectance and transmittance spectra has to take into account the fact that light impinging on a photonic crystal can be transmitted, (specularly) reflected, diffracted, absorbed, or (diffusely) scattered. Considering energies below the onset of diffraction () GalisteoPRB , diffraction can be disregarded. Absorption is also negligible for the considered frequencies for PS and PMMA spheres. Elastic scattering is then the only loss mechanism and the Lambert-Beer law can be written as:
| (2) |
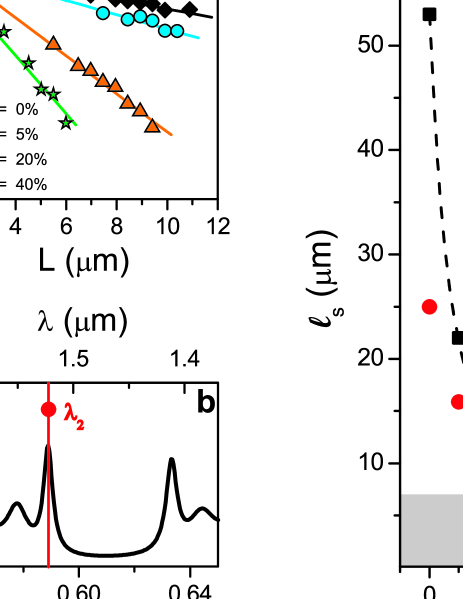
Fig. 5a shows the measurement of for four different vacancy density at a wavelength for spheres with diameter (). In this type of representation, the slope yields directly according to equation 2. Fig. 5c shows the variation of with the vacancy density in the pass band (, see Fig. 5b). We observe how the optical thickness of the sample, (where is the sample thickness), increases with . Table 1 shows this evolution and also gives the average number of scattering events light performs before exiting the sample, given by . This number is below one (0.2) in the case of the most perfect opal-based photonic crystal which is comparable to other very high quality opals Baumberg and it becomes as large as 28 in the case of . This last value is comparable to opals grown by centrifugation KoenderinkCBS which show an average number of scattering events of . The very high quality of the crystals is of paramount importance to access the different light transport regimes of our samples: near-single scattering in the case of non-doped crystals up to diffusion in the highest doping case of .
| 0 | 0.4 | 0.2 | ||
| 5 | 1 | 1 | ||
| 20 | 3 | 9 | ||
| 40 | 5.3 | 28 |
From Figs. 5b and 5c it is clear that the dependence of the scattering mean free path is very different at a wavelength at the band-edge ( in Figs. 5) than it is at wavelengths far away from the stopband ( in Figs. 5). At the band-edge the density of states is high and the group velocity low, which increases the amount of scattering and hence reduces the scattering mean free path Froufe ; PRBscattering . This explains the large difference between at the two wavelengths, for . At increasing , the effect of the photonic crystal diminishes and at there is no difference in the value of the scattering mean free path for the two wavelengths. At wavelengths far away from the stopband we do not expect strong effects from the photonic crystal and the inverse of the scattering mean free path should simply depend linearly on the density of scattering elements. If we distinguish between the scattering that is intrinsically present in the photonic crystal (expressed in terms of a density and cross section that represents the average of all intrinsic scattering, e.g., due to polidispersity of the spheres, cracks, staking faults and so on), and the scattering introduced by the vacancies (with vacancy density and vacancy scattering cross section ), we can write the inverse of the scattering mean free path as:
| (3) |
assuming independent scattering from the vacancies. Eq. 3 allows to fit and extract the value . Note that at both wavelengths and the mean free path becomes smaller than the Bragg length for (shaded area in Fig. 5c), which means that above those vacancy densities the Bloch approximation fails to give an accurate description of the propagation process.
IV IV. Dynamic measurements: DIFFUSION CONSTANT

The static measurements presented in section III reveal how sensitive is to the vacancy density. In order to get information on the behavior of the diffusion constant one has to resort to time-resolved measurements. In this section, we will use a non-linear optical gating technique to analyze the time-resolved response of transmitted diffuse light through photonic crystals with vacancies gating . This will allow us to measure the diffusion constant as a function of wavelength and disorder.
Most regular disordered systems are isotropic, meaning that the diffusion constant and mean free path are angular independent. In (partially disordered) photonic crystals it is, on the contrary, crucial to take into account directionality. The photonic band-edge of a stopband, for instance, occurs for a wavelength which will change when varying angle, hence its effect on the diffuse transport of light can also be anisotropic. The technique that we use in this section to measure the time-evolution of the transmitted diffuse light is sensitive to the component of the diffusion constant in the direction perpendicular to the slab, which is also the direction in which has been determined in the static measurements described in the previous section.
Fig. 6 shows time-resolved transmission through thin film opals, thickness ( layers), grown with PMMA spheres (diameter ) for . The measurements have been performed at (black-dotted curve) and (red-dotted curve). The reference pulse is plotted with a blue-solid curve in both figures to compare it with the diffuse decay. The value of the diffusion constant is obtained by fitting the experimental time profile of with the dynamical solution to the diffusion equation ltcolloidal1 . At the band-edge, we obtain while in the pass band, at , the transmitted pulsed through the sample is of the order of the probe pulse (150 fs, blue-solid curve). This is due to the fact that is larger than the maximum diffusion constant we can measure with our setup ().
The optical thickness of the sample, , is wavelength dependent at , as shown in the previous section. In the pass band, acquires a very large value compared to and becomes very large, as well. At this wavelength, scattering becomes dominantly single/low-order scattering so that it is actually not meaningful anymore to define a diffusion constant in the first place. The observed strong wavelength dependence diminishes at increasing disorder. This is shown in the inset of Fig 7 and is expected, as the photonic crystal correlations disappear. This behavior is clearly observed in the inset of Fig. 7, where is plotted at .
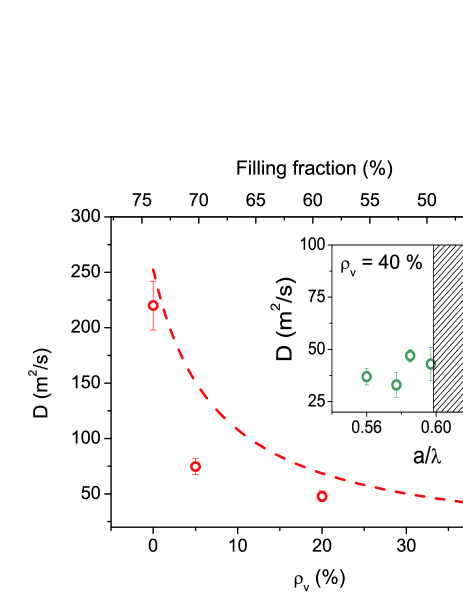
The complete measurement of as a function of is plotted in Fig. 7. It shows a 5-fold decrease of the value of as a consequence of disorder from to . The diffusion constant already reaches its minimal value at vacancy density and increasing the vacancy density beyond that point seems not to reduce the diffusion constant further. The total decrease of at is comparable to the decrease of at the same wavelength.
The diffusion constant in regular isotropic disordered systems is given by:
| (4) |
where is the energy velocity Albada and is the transport mean free path. This relation remains valid in isotropic systems for each Cartesian coordinate if we take the appropriate values for , , and in those directions. As mentioned above, our experimental technique is sensitive to the value of the diffusion constant in the direction perpendicular to the slab, which is also the direction in which we have determined the other optical properties of our samples.
If we now assume, to first order, (which is reasonable for our system) we can use the values of and to estimate , which yields: (where c is the speed of light in vacuum). This value is small compared to the phase velocity in an equivalent homogeneous system with the same average refractive index as our materials, which lies between 1.3 and 1.4, and also much smaller then the transport velocity that one would expect for the equivalent fully disordered system.
In Fig. 7, we have also plotted the vacancy density dependence of the diffusion constant if we assume the transport velocity to remain constant, using only the vacancy dependence of the mean free path as found before. We see that the overall variation of the diffusion constant of a factor of 5 can be entirely explained in that case by the vacancy dependence of . However, at intermediate vacancy values the such obtained curve overestimates . Currently there is no theory available that can describe accurately the behavior of the transport velocity in partially disordered photonic crystals, and this would be an interesting topic to look into in the future.
V V. TOTAL WHITE LIGHT TRANSMISSION: FROM CRYSTALS TO GLASSES
In the previous sections we have shown via static and dynamic measurements how a high amount of vacancies gives rise to strong multiple scattering in photonic crystals. In this section, we want to compare these highly doped photonic crystals with photonic glasses. To this purpose, we measured total light transmission from to wavelength through photonic crystals with with an integrating sphere (the setup is shown elsewhere PRA ) on large areas of .
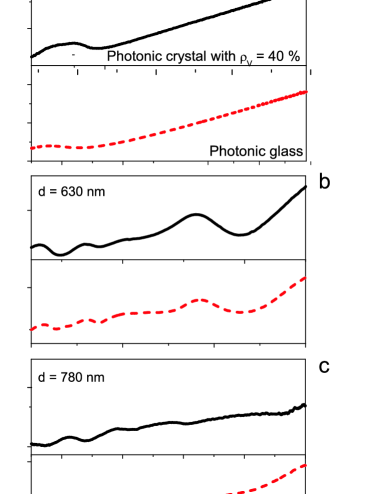
Fig. 8 compares total light transmission through photonic crystals with vacancies and through photonic glasses made with the same PMMA spheres for three different diameters: (8a) , (8b) and (8c) . The three figures show that the total transmission presents a very similar behavior in both cases, including the occurrence of very similar resonances. The transport mean free path measured in photonic glasses, Sapienza is comparable to the one measured in natural-sedimented photonic crystals kundePRA and to the value of obtained previously for our photonic crystals with vacancies . The occurrence of the same resonances in the total transmission for photonic glasses and photonic crystals with vacancies is noteworthy. In photonic glasses these resonances originate from the (Mie) resonances in the single scattering coefficient of the monodisperse constituent spheres. In the doped photonic crystals the scattering originates from vacancies and apparently, at high vacancy density, the Mie resonances of the spheres that constitute the photonic crystal emerge as dominant when the spatial correlations of the photonic crystal are strongly attenuated. The remarkable similarity of the curves shown in Fig. 8 is a clear indication of the convergence of a photonic crystal into a photonic glass with disorder.
VI VI. CONCLUSIONS
In this paper we report on the realization of photonic crystals with a controlled amount of, well-defined, disorder. We characterize the optical properties of such materials in various ways and determine the degree of scattering at various wavelengths and doping concentrations. In particular, our measurements show that it is possible to control and fine tune the amount of multiple scattering in a photonic crystal, by adding vacancies and hence without altering the crystal structure. In the highly vacancy doped photonic glass we observe a resonant behavior, analogous to that observed due to Mie scattering in photonic glasses. Our materials might therefore be useful to explore Fano-like interactions Fano between the extended Bloch-mode of the photonic crystal and spatially confined Mie-modes.
The possibility of controlling light scattering and diffusion in photonic crystals has important implications to test and understand better the quality of photonic crystal-based devices. The use of high refractive index materials, like Si Ibisate , may amplify the effect presented here becoming proper candidates to observe and control Anderson localization of light in 3D John83 , as already observed in slightly disordered 1D photonic crystal waveguides Science ; waveguides and for the spectral control of lasing emission from ordered/disordered active media.
VII ACKNOWLEDGMENTS
We thank J. F. Galisteo-Lopez for the data of the group index. The work was supported by the EU through Network of Excellence IST-2-511616-NOE (PHOREMOST), and partially supported by EU FP7 NoE Nanophotonics4Energy grant No. 248855; the Spanish MICINN CSD2007-0046 (Nanolight.es), MAT2009-07841 (GLUSFA) and Comunidad de Madrid S2009/MAT-1756 (PHAMA) projects . RS acknowledges support by RyC.
References
- (1) Present address: DTU Fotonik, Department of Photonics Engineering, Technical University of Denmark, rsteds Plads 343, DK-2800 Kgs. Lyngby, Denmark.
- (2) Present address: ICFO-Institut de Ciencies Fotoniques, Mediterranean Technology Park, 08860 Castelldefels (Barcelona), Spain.
- (3) E. Yablonovitch, Phys. Rev. Lett. 58, 2059 (1987).
- (4) S. John, Phys. Rev. Lett. 58, 2486 (1987).
- (5) A. F. Koenderink and W. L. Vos, Phys. Rev. Lett. 91, 213902 (2003).
- (6) J. F. Galisteo-López, M. Ibisate, R. Sapienza, L. S. Froufe-Pérez, A. Blanco, C. López, DOI: 10.1002/adma.201000356 (2010).
- (7) P. V. Braun, S. A. Pruzinsky, and F. Garcia-Santamaria, Adv. Mater. 18, 2665 (2006).
- (8) Y. Akahane, T. Asano, B. Song, and S. Noda, Nature 425, 944 (2003).
- (9) P. D. Garcia, R. Sapienza, and C. Lopez, Avd. Mater. 22, 12 (2010).
- (10) R. Sapienza, P. D. Garcia, J. Bertolotti, M. D. Martin, A. Blanco, L. Vina, C. Lopez, and D. S. Wiersma, Phys, Rev. Lett. 99, 233902, (2007).
- (11) P. W. Anderson, Phys. Rev. 109, 1492, (1958).
- (12) C. Toninelli, E. Vekris, G. A. Ozin, S. John, and D. S. Wiersma, Phys. Rev. Lett. 101, 123901 (2008).
- (13) K. P. Velikov, C. G. Christova, R. P. A. Dullens, and A. van Blaaderen, Science 296, 106 (2002).
- (14) V. Kitaev and G. Ozin, Avd. Mater. 15, 75 (2003).
- (15) D. Wang, H. Moehwald, Avd. Mater. 16, 244 (2004).
- (16) P. Jiang, J. F. Bertone, K. S. Hwang, and V. L. Colvin, Chem. Mater. 11, 2132 (1999).
- (17) M. Born, E. Wolf, Principles of Optics, Pergamon Press (1986).
- (18) J. F. Galisteo-Lopez, E. Palacios-Lidon, E. Castillo-Martinez, and C. Lopez, Phys. Rev. B 68, 115109 (2003).
- (19) V. N. Astratov, A. M. Adawi, S. Fricker, M. S. Skolnick, D. M. Whittaker, and P. N. Pusey, Phys. Rev. B 66, 165215 (2002).
- (20) This consideration is valid for our samples, since PS and PMMA absorbance is negligible for the considered frequencies PSabsorbance ; PMMAabsorbance , confirmed also by measurements of the absorption length () in the visible range for a photonic glass composed by the same polymer spheres PRA . Higher-order scattering is also negligible compared to the scattering losses.
- (21) T. Inagaki, E. T. Arakawa, R. N. Hamm, and M. W. Williams, Phys. Rev. B 15, 3243 (1977).
- (22) M. A. Khashan and A. Y. Nassif, Opt. Comm. 188, 129 (2001).
- (23) P. D. Garcia, R. Sapienza, J. Bertolotti, M. D. Martin, A. Blanco, A. Altube, L. Vina, D. S. Wiersma, and C. Lopez, Phys. Rev. A 78, 023823 (2008).
- (24) J. J. Baumberg, O. L. Pursiainen, and P. Spahn, Phys. Rev. B 80, 201103R (2009).
- (25) O. L. Muskens, A. F. Koenderink, and W. L. Vos, arXiv:1010.5008v1 (2010)
- (26) P. D. Garcia, R. Sapienza, L. S. Froufe-Perez, and C. Lopez, Phys, Rev. B 79, 241109 (R) 2009.
- (27) L. S. Froufe-Perez, R. Sapienza, P. D. Garcia, and C. Lopez, In preparation.
- (28) R. Sapienza, P. Costantino, D. S. Wiersma, M. Ghulinyan, C. J. Oton, and L. Pavesi, Phys. Rev. Lett. 91, 263902 (2003).
- (29) M. S. Patterson, B. Chance, and B. C. Wilson, Appl. Opt. 28, 2331 (1989).
- (30) M. P. van Albada, B. A. van Tiggelen, A. Lagendijk, and A. Tip, Phys. Rev. Lett. 66, 3132 (1991).
- (31) A. F. Koenderink, M. Megens, G. van Soest, W. L. Vos, and Ad Lagendijk, Physics Letters A 268, 104 (2000).
- (32) M. V. Rybin, A. B. Khanikaev, M. Inoue, K. B. Samusev, M. J. Steel, G. Yushin, and M. F. Limonov, Phys. Rev. Lett. 103, 023901 (2009)
- (33) M. Ibisate, D. Golamayo, and C. Lopez, Adv. Mater. 21, 2899 (2009).
- (34) S. John and M. J. Stephen, Phys. Rev. B 28, 6358 (1983).
- (35) L. Sapienza, H. Thyrrestrup, S. Stobbe, P. D. Garcia, S. Smolka, and P. Lodahl, Science 327, 1352 (2010).
- (36) P. D. Garcia, S. Smolka, S. Stobbe, and P. Lodahl, Phys. Rev. B 82, 165103 (2010).