THE ORIGIN OF DUST IN THE EARLY UNIVERSE: PROBING THE STAR FORMATION HISTORY OF GALAXIES BY THEIR DUST CONTENT
Abstract
Two distinct scenarios for the origin of the of dust observed in the high-redshift () quasar J1148+5251 have been proposed. The first assumes that this galaxy is much younger than the age of the universe at that epoch so that only supernovae (SNe) could have produced this dust. The second scenario assumes a significantly older galactic age, so that the dust could have formed in lower-mass asymptotic giant branch (AGB) stars. Presenting new integral solutions for the chemical evolution of metals and dust in galaxies, we offer a critical evaluation of these two scenarios, and observational consequences that can discriminate between the two. We show that AGB stars can produce the inferred mass of dust in this object, however, the final mass of surviving dust depends on the galaxy’s star formation history (SFH). In general supernovae cannot produce the observed amount of dust unless the average SN event creates over of dust in its ejecta. However, special SFHs can be constructed in which SNe can produce the inferred dust mass with a reasonable average dust yield of . The two scenarios propose different origins for the galaxy’s spectral energy distribution, different star formation efficiencies and stellar masses, and consequently different comoving number densities of J1148+5251-type hyperluminous infrared (IR) objects. The detection of diagnostic mid-IR fine structure lines, and more complete surveys determining the comoving number density of these objects can discriminate between the two scenarios.
1 INTRODUCTION
Determining the origin of the massive amount of dust present in SDSS J1148+5251 (hereafter J1148+5251), a hyper-luminous quasar at presents a special challenge. The dust mass inferred from far-infrared and submillimeter observations is depending on dust composition (Dwek et al. 2007, and references therein), about ten times larger than the mass of dust in the Milky Way (Sodroski et al., 1997). The total far-infrared (IR) luminosity is about , giving a star formation rate (SFR) of yr-1 for a Salpeter initial mass function (IMF) (Kennicutt, 1998a). Since the universe was only Myr old at that redshift, and the galaxy perhaps much younger, it has been suggested that only core-collapse supernovae (CCSNe) can produce the observed amount of dust in this object (Morgan & Edmunds, 2003; Dunne et al., 2003; Nozawa et al., 2003; Maiolino et al., 2004; Rho et al., 2008; Sibthorpe et al., 2009). Another argument made in favor of SNe as the most important dust sources in the early universe, was based on observations of unmixed ejecta of young remnants, primarily Cas A. The inferred dust mass in this remnant, ranging from , was considered sufficiently large for SNe to account for the observed dust mass in J1148+5251 (Rho et al., 2008; Sibthorpe et al., 2009; Barlow et al., 2010). We consider the of dust mass claimed by Dunne et al. (2003, 2009) to have formed in Cas A as an unreasonable amount of dust. The total ejecta mass is , of which only consists of condensible elements [e.g. Nozawa et al. (2010), and references therein].
None of these assertions, that SNe are significant dust sources in the early universe, were substantiated by detailed calculations. Specifically, the role of supernovae as destroyers of dust during the remnant phase of their evolution was completely ignored. Furthermore, these claims tacitly assume that the epoch of intense star formation spanned the entire age of the galaxy, which requires an excessively large reservoir of interstellar gas. Finally, recent calculations show that only of dust is created in a Population III 20 SN (Cherchneff & Dwek, 2010), which may be a typical yield for Pop II SNe of similar masses. All these considerations point to the need of more detailed calculations to ascertain the role of SNe as dust sources and sinks in the early universe. In such recent calculations, (Dwek et al., 2007) explored the combined effects of dust formation and destruction on the net amount of dust produced in J1148+5251. They found that SNe cannot be important sources of dust in the early universe unless they produce significantly more, and destroy significantly less dust than implied by current observations or theoretical calculations.
In light of these difficulties, Valiante et al. (2009) suggested that AGB stars could be the source of dust in J1148+5251. Their model was motivated by the numerical simulations of the formation and growth of this galaxy through a series of successive mergers that resulted in repeated intense bursts of star formation [(Li et al., 2007), hereafter Li07]. Associated with these mergers is the growth of its central black hole (BH) which at has reached a mass of about . In this scenario, star formation commenced at , when the universe was merely 250 Myr old. Consequently, the progenitors of the more numerous and efficient dust producing AGB stars had time to evolve off the main sequence (see Table 1), and produce the observed mass of dust in J1148+5251.
This paper takes a critical look at these two proposed dust formation scenarios, hereafter referred to as the SN and AGB scenarios. We start by introducing some basic definitions of the various quantities that govern the chemical evolution of galaxies, and present new integral solutions for the chemical evolution of their elemental and dust content (Section 2). In Section 3 we discuss the yields of the main stellar dust sources. These include the explosive SN ejecta, the fast winds created during the Wolf-Rayet (WR) stage of the evolution of stars with masses in excess of , and the quiescent winds from AGB stars. In Section 4 we apply the model to follow the chemical evolution of J1148+5251. We calculate the contribution of SNe and AGB stars to the production of dust in this galaxy, and the evolution of its stellar mass and luminosity. The simulated SFH of Li07 leading to the formation of J1148+5251 is not unique, and in Section 5 we examine alternate scenarios for the formation and survival of dust by AGB stars and SNe. Our results show that both, the AGB and the SN scenarios, are still viable for producing the mass of dust observed in J1148+5251, each scenario with its own problems and limitations. We therefore present in Section 6 observational tests, including studies of the spectral energy distribution (SED), the rarity of J1148+5251-type objects, and the inferred SFR, that can discriminate between the two. In Section 7 we explore two additional, non-stellar, dust sources: molecular clouds, which have always been considered as an environment for the growth and processing of interstellar dust grains in the Galaxy (Snow, 1975; Dwek & Scalo, 1980; Liffman & Clayton, 1989; Dwek, 1998; Greenberg & Li, 1999; Zhukovska et al., 2008), and AGN winds, which were recently suggested as potential producers of interstellar dust in quasars (Elvis et al., 2002; Maiolino et al., 2006). The results of the paper are briefly summarized in Section 8.
Throughout this paper we adopt a flat CDM cosmology, with a baryonic density parameter , a total matter (dark+baryonic) density parameter of , a vacuum energy density , and a Hubble constant of km s-1 Mpc-1 (Spergel et al., 2007).
2 EQUATIONS FOR THE EVOLUTION OF DUST
2.1 Basic Definitions
We define the stellar IMF, , so that , is the number of stars with masses between and , and normalize it to unity in the {} mass interval, where , and are, respectively, the lower and upper mass limits of the IMF. The IMF-averaged stellar mass, , is then:
| (1) |
The SFR, , is the mass of stars formed per unit time, and is related to the stellar birthrate, , by:
| (2) |
We assume that all stars in the [] mass range end their life quiescently, whereas all stars with masses become CCSNe, where , is their lower mass cut.
A useful quantity is , the mass of all stars born per SN event, given by:
| (3) |
The SN rate, , is then given by:
| (4) |
In all our calculations we will use a mass-heavy ISM characterized by a power law: in the {} = {1 , 100 } mass interval, with . For this IMF we get:
| (5) |
The choice of this mass-heavy IMF is motivated by studies suggesting that star formation in the early universe was biased towards more massive stars (Bromm & Larson, 2004). For comparison, a Salpeter IMF gives values of , and .
2.2 Equations for the Evolution of Dust or Elements
We first describe the equations for the evolution of the mass of dust in the ISM. Let be the mass of the gas in the ISM at a given time . The evolution of , the mass of dust in the ISM, is governed by the equation:
| (6) |
where is the dust-to-gas mass ratio:
| (7) |
The first term in Equation (6) represents the rate at which the dust is removed from the ISM by star formation; the second is the rate at which dust is destroyed by sputtering or grain-grain collisions in SN blast waves. The parameter is the timescale for the combined effect of these processes; the third term, , is a source function representing the rate of dust formation in the different astrophysical environments; and the fourth term represents the rate of increase/decrease in the dust mass as a result of infall/outflow from the galaxy.
The timescale for grain destruction in supernova shock waves is given by (Dwek & Scalo, 1980):
| (8) |
The parameter is the total mass of the refractory elements, initially locked up in dust, which are returned back to the gas phase of the ISM throughout the evolution of a single supernova remnant (SNR). For the MW galaxy, Jones (2004) found dust lifetimes of 400 and 600 Myr for silicate and carbon grains, respectively. We adopt here an average lifetime of Myr. This average should be time dependent since the dust composition, specifically the relative abundance of silicate and carbon dust, evolves with time. However, such distinction is not warranted in the present investigation because of our current lack of knowledge of the nature of the dust in high-redshift galaxies. Adopting a total dust mass , and a Galactic SN rate (Diehl et al., 2006), gives a value of about 3 for the grain destruction efficiency in the Galaxy. Since scales linearly with the mass of ISM dust, we can normalize it to its Galactic value:
| (9) |
where is the Milky Way value of , and is the average dust-to-gas mass ratio in the Milky Way (Zubko et al., 2004).
The grain destruction rate can then be written as:
| (10) |
The source function (t) represents the rate at which the dust mass in the ISM increases by nucleation in the different dust sources, or by growth in the ISM, which is an important process responsible for the differential depletions in its different phases. Considering only stellar sources, the source function can be written as:
where the different terms represent the net contribution of the different stellar sources to the dust mass in the ISM. For each stellar mass, the SFR, , is calculated at the epoch , where is the main sequence lifetime of a star of mass (Table 1). For AGB stars, the lower limit of the integral, , is given by: max{}, where is the mass of a star with a main sequence lifetime . The lower limit, is the limiting mass above which stars undergo extensive mass loss and become WR stars. , , , and are the dust yields in the quiescent winds of AGB and WR stars, and in the explosive ejecta of core-collapse and Type Ia SNe, respectively. In the last term, is a normalization constant that can be determined from the ratio between the observed frequency of Type II and Type Ia SNe, and is the distribution function of the delay time, , between the birth of the stellar system and the SNIa event (Greggio, 2005, 2010).
Finally, the yields in eq. (2.2), except the SNIa yields, depend on the initial stellar metallicity. This implicit time dependence is suppressed in the equations, and its implementation in the solution is described in Section 2.4 below.
For stellar masses above , for most times of interest, so that the yield from SNe and WR stars can be set equal to , and , respectively. is the rate of WR stars, which can be defined similarly to the SN rate [see eq. (4)] with replaced by . The IMF-averaged yields of SNe and WR stars are given by:
| (12) |
where or .
The term describing the rate of change in the dust mass caused by the exchange of gas with the intergalactic medium depends on whether the gas is flowing in or out of the galaxy. In an outflow, the dust-to-gas mass ratio in the outflowing gas is about equal to the galaxy’s value, , and the term is given by:
| (13) |
In the case of infall, the dust-to-gas mass ratio of the infalling gas, , is an independent variable and the term becomes:
| (14) |
2.3 The Evolution of the Gas
The evolution of the ISM gas is given by the equation:
where the first term in the top line represents the conversion rate of the ISM mass into stars, the second term represents the rate of stellar mass loss, where is the total mass returned back to the ISM by a star of initial mass , and the third term represents the rate of change in the ISM mass as a result of gas infall or outflow. The second line represents the behavior of in the instantaneous recycling approximation, where the returned (ejected) mass fraction, , is approximately 0.7.
The evolution of the gas mass is only weakly coupled to its chemical evolution. The returned mass, , is almost independent of metallicity (Karakas & Lattanzio, 2007) and the stellar MS lifetimes are only weakly dependent on metallicity for values above 0.001. So with reasonable accuracy, the evolution of the gas mass can (but does not need to) be solved independently of the evolution of the dust and metals in the ISM.
2.4 Integral Solutions
When the evolution of the ISM gas is decoupled from its chemical evolution, eq. (6) can be readily solved with the aid of an integration factor, to yield a convenient functional form for the evolution of the dust or any element in the ISM.
Changing variables (Audouze & Tinsley, 1976):
| (16) |
eq. (6) can be rewritten as:
| (17) |
where and are dimensional functions (units of time-1), given by:
| (18) |
and
| (19) |
Note that the outflow term is included in because it is proportional to , whereas the infall term is included in the expression for , since it is independent of the evolving metallicity of the galaxy. Equation (17) can be solved with the aid of an integration factor , which is defined as:
| (20) |
giving,
| (21) |
where is an integration constant.
Given , the mass of dust is simply given by:
| (22) |
Finally, equation (6) can also be used to describe the evolution of the metallicity, , of any stable or unstable element by the formal substitution of with , and by using the appropriate yields in eq. (2.2). For stable elements the parameter mw in eq. (18) should be set to zero, and for an unstable element, the dust lifetime, , in eq. (6) must be substituted by its radioactive decay time.
The solutions, as written here, are easily calculated for yields at a fixed metallicity, when the source function has a simple time dependency. Taking the changes of with metallicity into account can be achieved in a straightforward way. Yields are usually calculated for a finite grid of metallicities {}. One can therefore calculate the times {} when the solutions derived with stellar yields at the fixed metallicities, , reach the corresponding metallicities {}. The final evolution of the mass, , of the elements or the dust can then be written as a sum:
| (23) |
where {} are weight functions chosen to ensure the continuity of across the grid of times {}.
3 STELLAR SOURCES OF INTERSTELLAR DUST
In the following we examine the yields and relative importance of the dust formation in SNe, WR, and AGB stars. In all our calculations we adopt the previously described mass-heavy IMF.
3.1 Supernovae
Consider a constant SN rate, . The dust production rate is simply given by . Without grain destruction and with a SN rate of 20 yr-1, SN need to condense only 0.03 of dust over a period of Myr in order to produce an observed dust mass of . When grain destruction by SN is taken into account, the amount of dust produced by SNe is given by: , giving the trivial solution: , that is, in a steady state SNe must produce a dust mass that is equal to the amount they destroy during their lifetime. However, the required value of can be lower before the system reaches a steady state. For example, the first SNe expand in a dust-free medium and therefore are net producers of interstellar dust. Detailed chemical evolution and population synthesis models are therefore needed to fit the observational constraints imposed by the inferred stellar, gas, and dust masses, as well as the stellar and radiative output of the galaxy.
Simple analytical models have shown that even in the absence of grain destruction, SNe must produce at least of dust to account for the observed dust-to-gas mass ratio in J1148+5251 (Dwek et al. 2007; Figure 8). The reason that this number is not lower and equal to the value of derived in our simple estimate above, stems from the fact that in these models the SFR is proportional to , where is the mass surface density of the gas (Kennicutt, 1998b). evolves with time, so that the effective timespan over which star-formation takes place is therefore much shorter than the age of the galaxy. It is determined by either the buildup of the ISM in infall models, or by the depletion of the ISM in closed box models. For J1148+5251 the situation is exacerbated by the fact that the IR-inferred SFR is yr-1. This SFR can therefore only be sustained for about 20 Myr, if the reservoir of gas is comparable to the dynamical mass or the CO mass of the galaxy.
Do SNe actually produce this much dust? The most detailed information on the amount of dust formed in SNe comes from IR observations of the young supernova remnant of Cas A. Spitzer observations of the remnant have revealed the presence of of hot (Rho et al., 2008) and of cool dust (Sibthorpe et al., 2009; Barlow et al., 2010). Furthermore, detailed calculations, using a chemical kinetic approach to follow the transformation of gas phase molecules into small clusters of dust precursors, show that only of dust is created in the explosive ejecta of a Population III 20 SN (Cherchneff & Dwek, 2010). Such yield may be typical of SNe of similar masses, regardless of the initial metallicity of the progenitor star. This yield is still not sufficient to account for the mass of dust observed in J1148+5251 except when grain destruction is almost nonexistent in that galaxy. Such special scenario is discussed in Section 4.1.
3.2 Wolf-Rayet Stars
Of the stars that become CCSNe, only those with masses above will become WR stars, a stage during they will experience extensive mass loss. The formation of carbon dust becomes feasible during the latest phases of this mass loss phase, when the stellar surface becomes carbon enriched, and the star evolves into a carbon-rich WR star (WC star) (Crowther, 1997). For an IMF with a Salpeter slope of , the fraction of CCSNe that become WR stars is:
| (24) |
So WR stars have to produce about 10 times more dust than SNe to account for the dust mass in J1148+5251. There is observational evidence that most of WR stars are part of a binary system with an OB companion and that the dust formation locus is located in the region where the two winds collide as exemplified by the archetypical systems WR104 and WR140. For the Pinwheel Nebula WR 104, a dust mass loss of yr-1 is derived by Harries et al. (2004). A typical 60 WR star is characterized by a WC phase lasting about yr (Prantzos et al., 1986). We can thus approximate the amount of dust formed by WR stars as over their lifetime. This number is of the same order of magnitude and not 10 times larger than the dust mass formed in the ejecta of a CCSN. Therefore, WR stars are certainly contributing to the dust budget of J1148+5251 but no more than 10% of all dust makers.
3.3 AGB Stars
In the Milky Way, a significant fraction of dust is produced in AGB stars (Dwek, 1998; Tielens, 1998). Dependent of their evolutionary stage on the AGB, red giants have either a oxygen-rich stellar photosphere characterized by a C/O ratio 1, or a carbon-rich photosphere resulting from thermal pulses and 3rd dredge-up and characterized by a C/O ratio 1. The former stars form silicate and metal oxide dust whereas the latter essentially form carbon dust and silicon carbides. At present, there exist no satisfactory models explaining the chemical formation of dust in AGBs and the impact of dust on accelerating the outflow through radiative pressure. Dynamical models often use the classical nucleation theory to describe dust synthesis and derive dust yields (Ferrarotti & Gail, 2006), an approach that has been proved to be inadequate when applied to circumstellar outflows (Donn & Nuth, 1985; Cherchneff & Dwek, 2010).
For the purpose of the present study, we ignore the chemical and physical complexity of the dust formation processes and assume a condensation efficiency of unity to calculate the dust yields as described by Dwek (1998). The calculations assume that carbon dust forms when the C/O number ratio exceeds 1, and that silicate dust forms when this ratio is less than unity. This approach provides upper limits for the dust mass. For illustrative purposes, Figure 1 (left panel) depicts the mass of dust produced during the AGB phase from 1-8 stars with an initial metallicity of 0.008. Yields were taken from Karakas & Lattanzio (2007). Also shown in the figure are the carbon and oxygen yields (in units of and divided by their atomic mass), to illustrate the range of stellar masses that produce either silicate or carbon dust. Yields similar to those presented in this figure were adopted by Valiante et al. (2009) based on the models of Ferrarotti & Gail (2006). These models give different dust compositions, a distinction which is not important for the purpose of this paper.
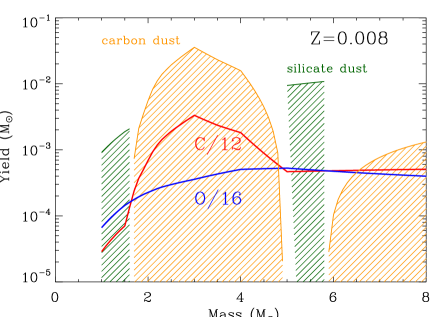
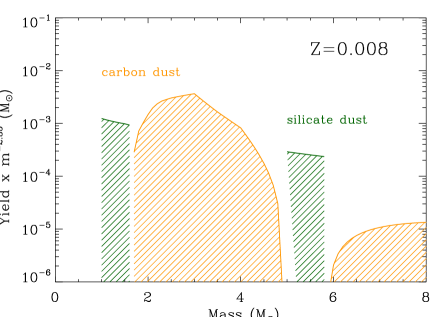
The right panel of the figure shows the IMF-weighted yield of dust from these stars, where the IMF is characterized by a power-law in mass with a Salpeter index of 2.35. The figure shows that he most efficient dust producers are stars, which have a MS lifetime of about 350 Myr. For AGB stars to be significant contributors to the reservoir of dust in a galaxy, its age has to be significantly older than yr.
3.4 Relative Importance
The rate of dust production by SNe, WR stars, and AGB stars is given by: , , and , respectively. Taking 0.15, 0.2, and 0.04 as the respective yields of dust in these sources, we get that in a steady-state, their relative dust production rate is: 1.0 : 0.11 : 4.6. AGB stars are therefore the most important sources of interstellar dust. However, this steady state is not immediately realized because of the delayed injection of AGB-condensed dust into the ISM. In the local group of galaxies, this delayed injection is manifested in the observed trend of the abundance of polycyclic aromatic hydrocarbons (PAHs) with galactic metallicity, which is taken as a proxy for galactic age (Dwek, 2005; Galliano et al., 2008). The trend shows the existence of a threshold metallicity below which the abundance of PAH is very low. PAHs condense in the atmospheres of AGB stars, and therefore represent AGB-condensed dust. So at early times, the mass of dust in galaxies is dominated by SN-condensed dust. The dust evolution models presented in (Galliano et al., 2008) suggest that the steady state when AGB sources are the dominant dust producers may only be reached after about Gyr of stellar evolution. PAHs can also be produced by shock processing of AGB-condensed carbon dust. However, both mechanisms, stellar condensation and shocks, need AGB stars as the source of dust, so the PAH-metallicity trend manifests the delayed injection of dust by AGB stars, even if most of the PAHs are formed in interstellar shocks.
4 THE QUASAR J1148+5251
4.1 The Evolution the ISM Gas and Dust Masses
In the following we will apply our new mathematical formalism to calculate the evolution of the gas and dust in J1148+5251. For AGB stars to be an important source of interstellar dust, star formation must have commenced at least 400 Myr before the epoch of observations which is about 900 Myr. In their paper, Valiante et al. (2009) adopted the SFH derived by Li07 from simulations of hierarchical galaxy mergers taking place at redshifts . The merger history of Li07 is not unique, and just one possible scenario leading to the formation of a supermassive BH at . We use it for illustrative purpose only, since it fulfills the necessary requirement for AGB stars to be significant sources of dust at high redshift. Their SFH, taken from their Figure 7 in Li07, is reproduced as a bold solid line in the left panel of Figure 5.
An important ingredient of chemical evolution models is the evolution of the gas mass. We adopted two different prescription for calculating this quantity. In the first, we adopted a closed box model (no infall or outflow) with an initial gas mass of , and used eq. (2.3) and the Li07 SFR to calculate its evolution. A value of was chosen so that the stellar mass derived from the chemical evolution model would match that derived from the population synthesis model PÉGASE (see Section 4.2). In the second approach we assumed that the SFR derived from the galaxy simulation follows the Schmidt-Kennicutt law in which , where is a proportionality constant and a measure of the star formation efficiency in the galaxy. The value of was chosen to reproduce the model’s SFR of 60 yr-1 at Myr with a gas mass of .
In the calculations we adopted an IMF-averaged dust yield of , the yield derived by Cherchneff & Dwek (2010) for a 20 primordial core-collapse supernova. The yield of dust in AGB stars was calculated as in Dwek (1998) using the stellar elemental yields of Karakas & Lattanzio (2007). The total dust yield from AGB stars is only weakly dependent on metallicity, so for simplicity we adopted AGB yields at a constant metallicity of . The stellar IMF was chosen to be a power law: between 1 and 100 , with a spectral index of .

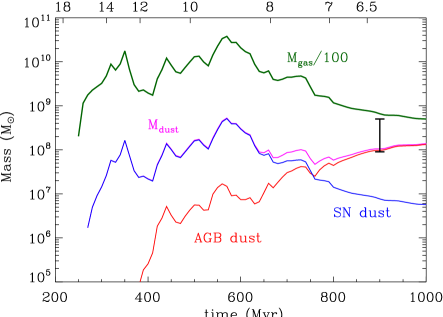
Figure 2 depicts the evolution of dust and gas masses for the two adopted evolutionary models for : the closed box model (left panel), and the model described by the Schmidt-Kennicutt SF law (right panel). The vertical line at Myr is the observed dust abundance, the length of the bar reflecting the range of dust masses for the different dust compositions (Dwek et al., 2007). The results of our calculations are in good agreement with those of Valiante et al. (2009). Not surprising, the detailed evolution differs from theirs, since it depends on their adopted evolutionary history of the gas mass, the grain destruction efficiency, and AGB yields, all quantities that differ somewhat from the ones used in this work. However, the main results, the final masses produced by SN- and AGB-condensed dust, are very similar. The figures show that AGB stars can readily produce the observed amount of dust with the proposed SFR, and that SNe contribute less than 20% of the total dust mass at Myr. They can therefore only be important dust sources if their IMF-averaged yield is , confirming the results of the simpler analytical model of Dwek et al. (2007).
Figure 2 also shows that for the Schmidt-Kennicutt model there exist two epochs, occurring and Myr after the commencement of SF at , during which SNe produce over of dust. It therefore seems that in a SF scenario consisting of either an extremely young or an intermediate-age burst of stars, SNe can produce the observed amount of dust, even with an average dust yield of , without resorting to the need of AGB stars.
At the time of the intermediate burst, the SFR is over yr-1. Compared to the younger burst, this burst requires a significantly larger SFR to produce a similar amount of dust, a consequence of the effect of grain destruction. The corresponding bolometric luminosity is over . Both, the SFR and the luminosity are in excess of the observational constraints, ruling out this SN scenario as a viable source of dust.
The extremely young burst will produce a total bolometric luminosity of , similar to the observed luminosity of , and a stellar mass of (see Figure 3). This is a viable scenario for the formation of dust in J1148+5251, although it requires the formation of supermassive BH on a very short timescale, and has implication on the comoving number and luminosity densities of such objects in the early universe (see Section 6.2 below).
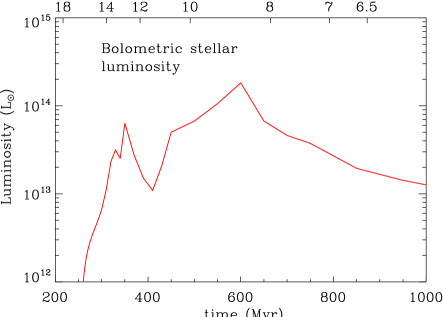
4.2 The Evolution the Stellar Luminosity and Mass
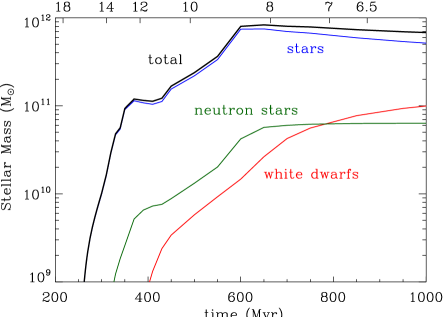
Figure 3 depicts the evolution of the stellar masses and remnants (left panel) and the bolometric stellar luminosity (right panel) of J1148+5251. Calculations were done for the hierarchical SF history depicted in figure 5, using the PÉGASE population synthesis code (Fioc & Rocca-Volmerange, 1997). Similar figures with identical results were presented by Li07 (Figures 11-12 in their paper). The merger history was proposed by them to account for the presence of a supermassive black hole (BH) of mass (Willott et al., 2003). Assuming that the relationship between the BH mass and its spheroidal component is still valid at redshifts , gives a stellar bulge mass of few [e.g. review by (Kormendy & Gebhardt, 2001)]. While the stellar mass derived here agrees with that estimate, it is in excess of the dynamical mass of that is enclosed within a 2.5 kpc radius of J1148+5251 (Walter et al., 2004). Walter et al. (2004) proposed several solutions to this discrepancy, including an overestimate in the mass of the BH, and a breakdown in the assumption that the CO gas is gravitationally bound. Also, there may be evidence that at high redshifts BHs may grow very rapidly without the corresponding increase in the mass of the host galaxy (Shields et al., 2006). It is therefore premature to rule out the AGB dust formation scenario while the origin of this discrepancy is still unresolved.
5 THE DEPENDENCE OF DUST MASS ON THE
STAR FORMATION HISTORY
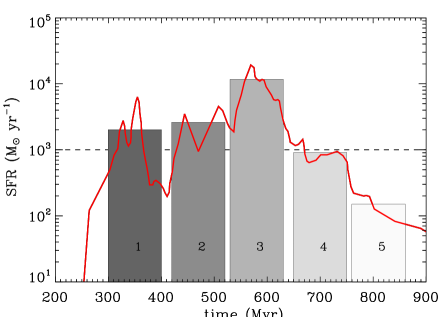
As pointed out earlier, the Li07 SF scenario for the formation of J1148+5251 is not unique. We therefore explore the dependence of the total dust mass on the SFH of the galaxy. We first consider the production and survival of dust by single short bursts of star formation. Figure 4 depicts the evolution of the mass of dust produced by AGB stars that were born at time in a 100 Myr burst of star formation characterized by a constant SFR of 1000 yr-1. The bold solid line depicts the net production of dust by AGB stars when no grain destruction occurs. It takes about Myr for the first AGB stars to evolve off the main sequence. The thinner lines depict the dust evolution in the presence of grain destruction. Grain destruction was assumed to be constant and to commence only after the cessation of the burst. After 600 Myr the burst releases of dust if no destruction has taken place in the intervening period since the end of the burst and the time of observation. The surviving mass of dust is significantly smaller when grain destruction is taken into account. A young burst produces after 200 Myr the least amount of dust, about with no grain destruction, but is also least affected by grain destruction. The figure shows that a single burst of star formation (with no subsequent grain destruction), for example burst 1 with an intensity of yr-1, or burst 4 with an intensity of 10,000 Myr, can produce the observed of dust in J1148+5251.

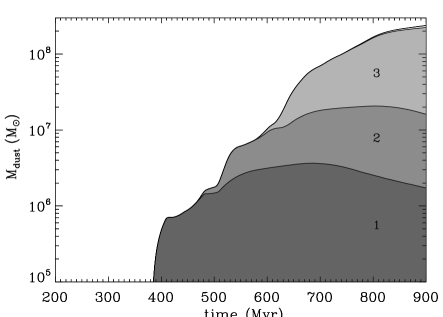
Deconstructing the complex SFH of a galaxy undergoing a series of hierarchical mergers can be very illustrative for understanding the origin of dust in such systems. In Figure 5 (left panel) we approximate the SFH of J1148+5251 used by Valiante et al. (2009) by five discrete bursts of star formation. The right panel depicts the cumulative contribution of each of the bursts to the total mass of dust in the galaxy. The oldest burst (number 1) releases the most amount of dust since all stars above 2.1 contributed to its production. However, grain destruction by the subsequent bursts reduces the mass of dust that survives until 900 Myr to only . Almost all of the surviving dust was produced by the third burst. It has a main sequence turnoff mass of , but also the largest SFR, and it is followed by a period of relatively low star formation activity and grain destruction.
The formation of about of dust at can therefore be achieved for different SFHs. As illustrated in Figure 4, a single burst of star formation with the appropriate intensity can produce the required amount of dust, since no grain destruction takes place after the cessation of all star formation activities in the galaxy. Massive amounts of dust can also be produced by complex SFHs such as that presented in Figure 5, provided that the epochs of intense starburst acivity are followed by a period with a very low rate, yr-1, of star formation, so that the dust lifetime will be over 100 Myr. The discriminating factor between the different star formation histories capable of producing large amount of dust are the cumulative products, such as the metals or stellar masses, resulting from the star formation activities.
6 OBSERVATIONAL DISCRIMINATION BETWEEN
THE SN AND AGB SCENARIOS
We have shown that not only AGB stars, but also SNe can produce the inferred dust mass in J1148+5251, even with observed SN dust yields inferred from observations of Cas A. The SN scenario requires a special SF event, characterized by an intense burst of star formation that commenced just prior to the observations. The short duration of the burst can insure that grain destruction did not have any time to significantly erode the newly-formed dust. This is clearly an idealized scenario, since some grain destruction will take place when the reverse shock travels through the SN ejecta (Nozawa et al., 2010). In the following we discuss several observational effects that can discriminate between the two scenarios.
6.1 The Spectral Energy Distribution
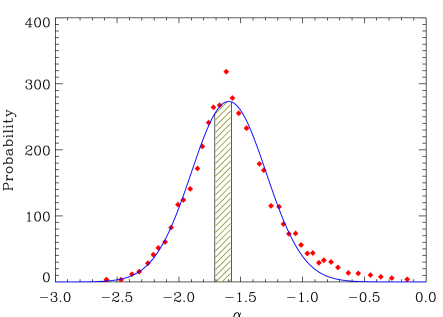
An important distinction between the SN and AGB scenarios for the origin of dust in J1148+5251 is the origin of its SED. In the SN scenario, most of the UV-optical and all the far-IR emission originate from starlight and starlight-heated dust. In the AGB scenario the situation is more complicated, and the origin of the SED depends on the fractions of the AGN and starburst luminosities that are absorbed and re-emitted by the dust. The total calculated stellar luminosity at ( Myr) is (see Figure 3 and Table 2), about equal to the total far-infrared (FIR) luminosity, which is . So, in principle, all the FIR emission could arise from dust heated by the stellar radiation. In this extreme case, all the observed UV to near-IR luminosity should originate from the AGN. Figure 6 (left panel) depicts the stellar SED calculated for the hierarchical merger SFR at the galactic age of 900 Myr. In the absence of any discriminating line emission, can this extreme case be ruled out on the basis of the 0.1 to 1 m continuum emission? This question is addressed in the right panel of the figure which depicts the probability distribution of photometric spectral indices derived from the observed magnitudes of quasars Richards et al. (2003). The spectral index of the 0.1–1.0 m spectrum of J1148+5251 is (left panel) which corresponds to a value of . This value is near the median value of -1.6. The optical to near-IR spectrum of J1148+5251 has therefore an equally high probability of being entirely that of an AGN as that of a starburst galaxy. The nature of the SED can therefore only be determined with the detection of mid-IR fine structure lines from highly ionized species such as [Ne V]14.3 and 24.3 m which are unambiguous diagnostics of AGN activity (Satyapal et al., 2009; Dudik et al., 2009).

6.2 The Rarity of Dusty Hyperlumimous IR Galaxies at High Redshifts
The AGB scenario for the formation of dust in J1148+5251 requires the early onset of star formation. Valiante et al. (2009) used the SFR derived in the Li07 hierarchical mergers model as a plausible description of the SFH in J1148+5251. Figure 3 shows that this scenario requires the assembly of galaxies with stellar masses of by . The associated mass of the dark matter (DM) halo is: . The comoving number density of such halos derived from the Press-Schechter (PS) approximation (Press & Schechter, 1974) is about Mpc-3 (Stiavelli, 2009; Li et al., 2007). This number is significantly smaller that the Mpc-3 comoving volume density of the SDSS QSOs (Fan et al., 2003) which have optical to near-IR luminosities similar to J1148+5251 (Jiang et al., 2010). The apparent three orders of magnitude discrepancy between the observed number density of J1148+5251-like QSOs and that calculated using the PS approximation can probably be attributed to one or more of the following: (1) the breakdown in the accuracy of the formalism at high redshifts and large halo masses (Li07, and references therein); (2) the observations presented by Jiang et al. (2010) only cover the optical to near-IR wavelengths, which only includes a hot dust component. Their QSO sample may therefore not contain a massive amount of colder dust, and may therefore not be representative of the population of J1148+5251-type objects at far-IR wavelengths; and (3) the Li07 merger scenario is not the only scenario that can lead to the formation of the supermassive black hole, even if the BH-halo mass correlation holds at these redshifts.
In the SN scenario, if we assume that the dust formed in an extremely young burst, the mass of the dark halo associated with an galaxy is about . The comoving number density of such halos is about Mpc-3, consistent with the number density of galaxies with similar stellar masses detected in the Great Observatories Origins Deep Survey (GOODS) fields (Stark et al., 2009). If all these galaxies had luminosities similar to J1148+5251, then the comoving bolometric luminosity density at should be about Mpc-3. This luminosity density is somewhat larger than the total luminosity density presented in Figure 18 of Franceschini et al. (2010), when extrapolated to . However, galaxy count models suggest that galaxies with luminosities above constitute only a small a fraction, about , of the total number of galaxies at high redshift (Chary & Elbaz, 2001; Franceschini et al., 2010). This gives a comoving number density of J1148+5251-type objects of Mpc-3, similar to the Fan et al. (2003) observations. So in the SN scenario a significant fraction of the quasars should have massive amounts of dust. This result is not yet supported by current observations, which show that a significant fraction of these objects are dust-free. However, among the galaxies, J1148+5251 is an extremely rare object, consistent with the inferred low extinction and metallicities in galaxies detected in the CDF-South GOODS field with the WFC3/IR camera on the Hubble Space Telescope (Bouwens et al., 2010). The rarity of J1148+5251 in the SN scenario should not be surprising considering the very contrived SFH required to form the inferred mass of dust in this object.
6.3 The Star Formation Efficiency
Observations of star forming galaxies revealed an empirical relation between a galaxy’s global SFR and its total gas mass. For a Salpter IMF, this relation can be written as Kennicutt (1998b):
| (25) |
VLA observations of J1148+5251 show that the CO gas is distributed over an extended region with an area of kpc2 (Walter et al., 2004). Adopting a total gas mass of , and assuming that it occupies the same area as the CO gas gives an expected SFR of yr-1. For the mass heavy IMF adopted here, the corresponding SFR is yr-1. This value is larger than the SFR at the epoch of observations in the AGB scenario, suggesting that the SF efficiency at that time is about times lower than that in normal star forming galaxies, which varies between 2 and 10% (Kennicutt, 1998b). However, this instantaneous SF efficiency does not reflect its past value which, averaged over a fixed time interval, should scale as . So the average SF efficiency in J1148+5251 should be similar to that in normal SF galaxies.
Studies of the relation between the mass of dark matter (DM) halos and the luminosity of their host galaxies show an evolutionary trend between the galaxies’ luminosity function and their halo masses (Trenti et al., 2010). This trend can be translated into a relation between their SF efficiency, , and their halo mass. For masses above , the SF efficiency depends only mildly on halo mass, and is given by (Trenti et al., 2010). For the inferred halo mass of in the AGB scenario, . So the predicted SF efficiency is somewhat higher than the inferred average in the AGB scenario, which can however be attributed to expected large variations in individual objects.
In the SN scenario, all the far-IR luminosity is powered by star formation, suggesting a SFR in excess of yr-1. This implies a very high SF efficiency for the given mass of the galaxy. At this rate the galaxy will deplete its reservoir of gas in about 10 Myr, suggesting that we are just witnessing the onset of a large burst of SF in this object, which will be rapidly quenched by stellar feedback.
7 ALTERNATIVE DUST SOURCES
The still unresolved discrepancy between the predicted and inferred stellar masses in the AGB scenario, and the specialized SF scenario required to form the inferred J1148+5251 dust mass by SNe, raises the need to explore alternative, non-stellar, sources that may produce the large amount of dust in this object. In the following we consider the growth of dust in molecular clouds and their formation around AGN as such sources.
7.1 Molecular Clouds
Numerous observations and theoretical considerations support the notion that dust grains are processed and grow in dense molecular clouds (MCs). Observationally, extinction measurements show that the value of , an indicator of grain size, increases with hydrogen column density [e.g. Kandori et al. (2003), and references therein]. Similarly, interstellar depletions of refractory elements increase with average gas column density (Savage & Sembach, 1996; Jenkins, 2009) and infrared spectroscopy of molecular clouds show the presence of ices, expected to have condensed out on interstellar grain cores (van Dishoeck, 2004). Theoretically, the discrepancy between the relatively short lifetime of interstellar dust (Jones, 2004) and the longer lifetime for their replenishment by SNe or AGB stars has been attributed to grain growth in molecular clouds (Dwek & Scalo, 1980; Dwek, 1998; Tielens, 1998; Zhukovska et al., 2008). In particular, the possibility that rapid growth of dust in high-redshift galaxies took place in molecular clouds was considered by Michałowski et al. (2010). Here we provide a more quantitative discussion of such possibility.
Several conditions must be met for grain growth in clouds to be significant: (1) the presence of preexisting refractory grain cores onto which the accretion can take place; (2) the accretion time onto these cores must be shorter than the lifetime of the dense clouds in which this process is taking place.
Let be the mass density of grains in the MC, where is their number density and their mass. Assuming that all grains have the same radius , the growth rate of due to accretion of a heavy element with a molecular weight and number density is given by:
| (26) |
where is the sticking coefficient in the collision, and is the mean thermal velocity of at temperature .
The accretion time, , is defined as follows:
Taking the mass of an oxygen atom to represent that of a colliding species, so that , and (assuming solar abundances), we get that:
| (28) |
For a grain density of 3 g cm-3, radius of 0.1 m, a cloud density of cm-3, and cloud temperature of 20 K, the accretion time becomes yr.
The lifetime, , of the molecular clouds is given by:
| (29) |
where is the MC mass, and where we used the inferred H2 mass and SFR to calculate the average lifetime of the molecular gas. We used here the large SFR inferred from the SN scenario to minimize the lifetime of the MC. Had we used the SFR from Figure 5 the MC lifetime would have been higher by a factor of . Within the uncertainties of the chosen values of the various parameters, the cloud lifetime is not significantly shorter than the accretion time. Consequently grain growth in the dense ISM can play an important role in determining the observed dust mass.
The accreted material may be in the form of organic refractory material (Greenberg et al., 1995). The main observational constraints, extinction, diffuse IR emission, interstellar abundances, in the Milky Way can also be met with composite dust models that incorporate such material (Li & Greenberg, 1997; Zubko et al., 2004). If so, then the dust of J1148+5251 could also consist of such composite grains that could have a significant abundance in the diffuse ISM. In the Milky Way, most (60–75%) of the IR emission is radiated by dust in the diffuse ISM, with only 15–30% radiated from MCs (Sodroski et al., 1997). Likewise, the IR emission from J1148+5251 could arise either from the dust in the MCs, or from dust in the diffuse ISM, including H II regions. The origin of the IR emission in this case can therefore only be determined by considering dust evolution models that incorporate a two phase medium, and take the physical processes and the cycling between the phases into account.
7.2 “Smoking Quasars”
The concept of “smoking quasars”, that is, the possibility that quasars may be producers of interstellar dust was first put forward by Elvis et al. (2002). In his scenario, the broad emission line clouds (BELCs), confined by the centrifugally driven outflowing wind (Kartje & Königl, 1996), go through the same density and temperature conditions that characterize the dusty winds in stellar outflows. It is therefore naturally to postulate that if the conditions in the stellar winds are ripe to form dust, a similar process will be taking place in the BELCs. This idea was further discussed by Maiolino et al. (2006).
The main issue, not addressed in these papers is whether the BELCs were dusty to start with (Elitzur & Shlosman, 2006). If so, then the IR emission observed in the vicinity of the AGN is not the signature of radiation from newly-formed dust, but that of reprocessed dust. This dust could have formed previously in SNe or dusty stellar winds. If so, quasars cannot be considered as net producers of interstellar dust. The issue of quasars as dust sources can therefore only be settled once we have a clearer understanding the origin of the BELCs, and of the dust formation process in these objects.
8 DISCUSSION AND SUMMARY
Using our new integral solutions for the chemical evolution of the ISM gas and its metal and dust contents, we examined the origin of the large amount of dust discovered in the high quasar J1148+5251. We have confirmed that AGB stars can produce the required amount of dust in a merger scenario in which the assembled galaxy undergoes a period of intense star formation at , followed by a period of significantly lower stellar activity. In this AGB scenario, an average 20 supernova needs to make at least of dust in order to be a viable source of dust at this high redshift. However, SNe can yet produce the required amount of dust with a significantly lower dust yield, provided the galaxy underwent a very special SFH. In the following we summarize the main results of our paper, and discuss future observations and studies needed to distinguish between the two scenarios in order to determine the origin and nature of the dust in J1148+5251 and similar objects in the early universe.
-
1.
The AGB scenario - A galaxy must be at least 400 Myr old for AGB stars to have made a significant contribution to its reservoir of dust, a conditioned fulfilled by the merger scenario for the formation of J1148+5251. However, this SFH is not unique, and we outlined several alternative scenarios for the formation of large amounts of dust with AGB stars. At any given epoch, the intensity of the starburst must be at least 2000 yr-1 in order to produce the inferred amount of dust, and the star formation rate must have dropped to less than yr-1 thereafter so that the dust that is injected at the epoch of observations will not be significantly destroyed.
-
2.
The SN scenario - In general, an average SN must condense about 1 of dust in order to produce the observed amount of dust in J1148+5251. Our current state of knowledge, observationally and theoretically, suggest that the explosive ejecta of a progenitor star produces only about of dust. Such progenitors are the most common metal producing SNe, and fall short of meeting the production requirement. However, our knowledge is based on limited number of observations and calculations, so it may change in the future. Similarly to the alternative AGB scenario, SNe can produce the observed amount of dust with a dust yield of in a single short-duration and intense burst of star formation, followed by a period of very low star forming activity. Such scenarios must be very rare in order to explain the low comoving number density of hyperluminous IR objects at high redshifts.
-
3.
The stellar mass and gas content of J1148+5251 - The stellar mass offers an important integral constraint on the duration and intensity of the burst of star formation. These place integral constraints on the total amount of dust that could have formed in the quasar. In the SN scenario of stars are formed around . So if dust formation was very efficient in these objects, the SN scenario would produce more dusty hyperluminous IR stars than currently observed at high redshifts. The formation of SN dust must therefore be a very rare event in these objects, limited by the dust formation and grain destruction efficiencies in these objects. The AGB scenario requires the formation of at redshifts of , suggesting that J1148+5251 is a very rare event, but perhaps consistent with the number of J1148+5251-like QSOs detected at . If so, a significant fraction of quasars should have massive amount of dust, a prediction that is yet unsupported by current observations. Furthermore, the stellar mass produced in the AGB scenario is much larger that the inferred dynamical mass of the galaxy. Resolving this discrepancy is a crucial step in determining the origin of the dust in J1148+5251.
-
4.
The nature of the optical to near-IR SED of J1148+5251 - In the SN scenario all the emission in this wavelength region is produced by stars, whereas in the AGB scenario all this emission is produced by the AGN. In the absence of a detailed spectrum, we used the slope of the SED to discriminate between the two scenarios. The results show that the slope of the SED is typical of quasars, and also consistent with that produced by an extincted burst of star formation. The detection of mid-IR fine structure lines that serve as unambiguous diagnostics of AGN or starburst activity will be extremely useful for distinguishing between the two scenarios.
-
5.
The efficiency of grain destruction in the ISM - Our current state of knowledge is predominantly based on the simulations that were performed for a homogenous ISM. These calculations need to be expanded for a 2-phase ISM, taking also the spatial distribution of dust sources and sinks into account. For example, one can easily envision an intense starburst or spatially isolated SNe producing large amount of dust in one location in the galaxy, followed sometime later by another physically isolated starburst that will have little effect on the destruction of the dust created in the first. Spatially isolated starburst or SNe may therefore increase the currently estimated short lifetime of the dust in the ISM.
-
6.
Dust growth in the ISM - Accretion in molecular clouds must play an important role in explaining the origin of the Galactic pattern of interstellar depletions. A necessary condition for this process to be important is that the lifetime of molecular clouds be larger than the timescale for grain growth by accretion. This condition is met in J1148+5251, rendering it a possible, but not necessary, source for the growth of dust in this object. Detailed information of the correlation of the IR emission with the different gas phases in J1148+5251 may resolve this ambiguity.
-
7.
Dust formation in around AGN - The effectiveness of AGNs as sources of newly-formed dust remains unclear. The origin of the dense broad-line-emitting clouds, and whether they were initially dusty so that the AGN merely reformed pre-existing dust, are questions that need to be addressed to ascertain their role as dust sources in quasars.
Acknowledgements ED thanks the Department of Astronomy at the University of Maryland, and the Department of Astronomy and Astrophysics at Tel Aviv University for their hospitality during the time of the writing of this paper. ED also acknowledges helpful discussions with Richard Mushotzky, Sylvain Veilleux, Amiel Sternberg, Dan Laor, and Hagai Netzer, and thanks Rick Arendt and Dieter Hartmann for comments on parts of the manuscript. ED also thanks Massimo Stiavelli for providing an expanded version of Figure 2.6 in his book for use in this study. Finally, we thank the anonymous referee for his/her useful comments that have led to significant improvements in the paper.
References
- Audouze & Tinsley (1976) Audouze, J. & Tinsley, B. M. 1976, ARA&A, 14, 43
- Barlow et al. (2010) Barlow, M. J., Krause, O., Swinyard, B. M., et al. 2010, ArXiv e-prints
- Bouwens et al. (2010) Bouwens, R. J., Illingworth, G. D., Oesch, P. A., et al. 2010, ApJ, 708, L69
- Bromm & Larson (2004) Bromm, V. & Larson, R. B. 2004, ARA&A, 42, 79
- Chary & Elbaz (2001) Chary, R. & Elbaz, D. 2001, ApJ, 556, 562
- Cherchneff & Dwek (2010) Cherchneff, I. & Dwek, E. 2010, ApJ, 713, 1
- Crowther (1997) Crowther, P. A. 1997, MNRAS, 290, L59
- Diehl et al. (2006) Diehl, R., Halloin, H., Kretschmer, K., et al. 2006, Nature, 439, 45
- Donn & Nuth (1985) Donn, B. & Nuth, J. A. 1985, ApJ, 288, 187
- Dudik et al. (2009) Dudik, R. P., Satyapal, S., & Marcu, D. 2009, ApJ, 691, 1501
- Dunne et al. (2003) Dunne, L., Eales, S., Ivison, R., Morgan, H., & Edmunds, M. 2003, Nature, 424, 285
- Dunne et al. (2009) Dunne, L., Maddox, S. J., Ivison, R. J., et al. 2009, MNRAS, 394, 1307
- Dwek (1998) Dwek, E. 1998, ApJ, 501, 643
- Dwek (2005) Dwek, E. 2005, in American Institute of Physics Conference Series, Vol. 761, The Spectral Energy Distributions of Gas-Rich Galaxies: Confronting Models with Data, ed. C. C. Popescu & R. J. Tuffs, 103–+
- Dwek et al. (2007) Dwek, E., Galliano, F., & Jones, A. P. 2007, ApJ, 662, 927
- Dwek & Scalo (1980) Dwek, E. & Scalo, J. M. 1980, ApJ, 239, 193
- Elitzur & Shlosman (2006) Elitzur, M. & Shlosman, I. 2006, ApJ, 648, L101
- Elvis et al. (2002) Elvis, M., Marengo, M., & Karovska, M. 2002, ApJ, 567, L107
- Fan et al. (2003) Fan, X., Strauss, M. A., Schneider, D. P., et al. 2003, AJ, 125, 1649
- Ferrarotti & Gail (2006) Ferrarotti, A. S. & Gail, H.-P. 2006, A&A, 447, 553
- Fioc & Rocca-Volmerange (1997) Fioc, M. & Rocca-Volmerange, B. 1997, A&A, 326, 950
- Franceschini et al. (2010) Franceschini, A., Rodighiero, G., Vaccari, M., et al. 2010, A&A, 517, A74+
- Galliano et al. (2008) Galliano, F., Dwek, E., & Chanial, P. 2008, ApJ, 672, 214
- Greenberg & Li (1999) Greenberg, J. M. & Li, A. 1999, Advances in Space Research, 24, 497
- Greenberg et al. (1995) Greenberg, J. M., Li, A., Mendoza-Gomez, C. X., et al. 1995, ApJ, 455, L177+
- Greggio (2005) Greggio, L. 2005, A&A, 441, 1055
- Greggio (2010) Greggio, L. 2010, MNRAS, 406, 22
- Harries et al. (2004) Harries, T. J., Monnier, J. D., Symington, N. H., & Kurosawa, R. 2004, MNRAS, 350, 565
- Jenkins (2009) Jenkins, E. B. 2009, ApJ, 700, 1299
- Jiang et al. (2010) Jiang, L., Fan, X., Brandt, W. N., et al. 2010, Nature, 464, 380
- Jones (2004) Jones, A. P. 2004, in ASP Conf. Ser. 309: Astrophysics of Dust, ed. A. N. Witt, G. C. Clayton, & B. T. Draine, 347–+
- Kandori et al. (2003) Kandori, R., Dobashi, K., Uehara, H., Sato, F., & Yanagisawa, K. 2003, AJ, 126, 1888
- Karakas & Lattanzio (2007) Karakas, A. & Lattanzio, J. C. 2007, Publications of the Astronomical Society of Australia, 24, 103
- Kartje & Königl (1996) Kartje, J. F. & Königl, A. 1996, Vistas in Astronomy, 40, 133
- Kennicutt (1998a) Kennicutt, Jr., R. C. 1998a, ARA&A, 36, 189
- Kennicutt (1998b) Kennicutt, Jr., R. C. 1998b, ApJ, 498, 541
- Kormendy & Gebhardt (2001) Kormendy, J. & Gebhardt, K. 2001, in American Institute of Physics Conference Series, Vol. 586, 20th Texas Symposium on relativistic astrophysics, ed. J. C. Wheeler & H. Martel, 363–381
- Li & Greenberg (1997) Li, A. & Greenberg, J. M. 1997, A&A, 323, 566
- Li et al. (2007) Li, Y., Hernquist, L., Robertson, B., et al. 2007, ApJ, 665, 187
- Li et al. (2008) Li, Y., Hopkins, P. F., Hernquist, L., et al. 2008, ApJ, 678, 41
- Liffman & Clayton (1989) Liffman, K. & Clayton, D. D. 1989, ApJ, 340, 853
- Maiolino et al. (2006) Maiolino, R., Nagao, T., Marconi, A., et al. 2006, Memorie della Societa Astronomica Italiana, 77, 643
- Maiolino et al. (2004) Maiolino, R., Schneider, R., Oliva, E., et al. 2004, Nature, 431, 533
- Michałowski et al. (2010) Michałowski, M. J., Murphy, E. J., Hjorth, J., et al. 2010, ArXiv e-prints
- Morgan & Edmunds (2003) Morgan, H. L. & Edmunds, M. G. 2003, MNRAS, 343, 427
- Nozawa et al. (2010) Nozawa, T., Kozasa, T., Tominaga, N., et al. 2010, ApJ, 713, 356
- Nozawa et al. (2003) Nozawa, T., Kozasa, T., Umeda, H., Maeda, K., & Nomoto, K. 2003, ApJ, 598, 785
- Prantzos et al. (1986) Prantzos, N., Doom, C., De Loore, C., & Arnould, M. 1986, ApJ, 304, 695
- Press & Schechter (1974) Press, W. H. & Schechter, P. 1974, ApJ, 193, 437
- Raiteri et al. (1996) Raiteri, C. M., Villata, M., & Navarro, J. F. 1996, A&A, 315, 105
- Rho et al. (2008) Rho, J., Kozasa, T., Reach, W. T., et al. 2008, ApJ, 673, 271
- Richards et al. (2003) Richards, G. T., Hall, P. B., Vanden Berk, D. E., et al. 2003, AJ, 126, 1131
- Satyapal et al. (2009) Satyapal, S., Böker, T., Mcalpine, W., et al. 2009, ApJ, 704, 439
- Savage & Sembach (1996) Savage, B. D. & Sembach, K. R. 1996, ARA&A, 34, 279
- Shields et al. (2006) Shields, G. A., Menezes, K. L., Massart, C. A., & Vanden Bout, P. 2006, ApJ, 641, 683
- Sibthorpe et al. (2009) Sibthorpe, B., Ade, P. A. R., Bock, J. J., et al. 2009, ArXiv e-prints
- Snow (1975) Snow, Jr., T. P. 1975, ApJ, 202, L87
- Sodroski et al. (1997) Sodroski, T. J., Odegard, N., Arendt, R. G., et al. 1997, ApJ, 480, 173
- Spergel et al. (2007) Spergel, D. N., Bean, R., Doré, O., et al. 2007, ApJS, 170, 377
- Stark et al. (2009) Stark, D. P., Ellis, R. S., Bunker, A., et al. 2009, ApJ, 697, 1493
- Stiavelli (2009) Stiavelli, M. 2009, From First Light to Reionization: The End of the Dark Ages (Wiley-VCH)
- Tielens (1998) Tielens, A. G. G. M. 1998, ApJ, 499, 267
- Trenti et al. (2010) Trenti, M., Stiavelli, M., Bouwens, R. J., et al. 2010, ApJ, 714, L202
- Valiante et al. (2009) Valiante, R., Schneider, R., Bianchi, S., & Andersen, A. C. 2009, MNRAS, 397, 1661
- van Dishoeck (2004) van Dishoeck, E. F. 2004, ARA&A, 42, 119
- Walter et al. (2004) Walter, F., Carilli, C., Bertoldi, F., et al. 2004, ApJ, 615, L17
- Willott et al. (2003) Willott, C. J., McLure, R. J., & Jarvis, M. J. 2003, ApJ, 587, L15
- Zhukovska et al. (2008) Zhukovska, S., Gail, H., & Trieloff, M. 2008, A&A, 479, 453
- Zubko et al. (2004) Zubko, V., Dwek, E., & Arendt, R. G. 2004, ApJS, 152, 211
| Mass | Metallicity | ||||
|---|---|---|---|---|---|
| () | 0.0001 | 0.001 | 0.008 | 0.0100 | 0.02 |
| 1.0 | 4998 | 6774 | 8634 | 8846 | 9516. |
| 1.5 | 1474 | 2022 | 2415 | 2446 | 2528. |
| 2.0 | 663 | 914 | 1047 | 1054 | 1062. |
| 2.25 | 486 | 670 | 756 | 759 | 757. |
| 2.5 | 371 | 512 | 570 | 570 | 565. |
| 2.75 | 292 | 404 | 444 | 443 | 436. |
| 3.0 | 236 | 326 | 355 | 354 | 346. |
| 3.25 | 195 | 270 | 291 | 290 | 282. |
| 3.5 | 164 | 227 | 243 | 241 | 234. |
| 3.75 | 140 | 194 | 206 | 204 | 197. |
| 4.0 | 121 | 168 | 177 | 175 | 168. |
| 4.5 | 94 | 129 | 135 | 134 | 128. |
| 5.0 | 75 | 104 | 107 | 106 | 100. |
| 5.5 | 62 | 85 | 87 | 86 | 81. |
| 6.0 | 52 | 72 | 73 | 72 | 68. |
| 6.5 | 45 | 61 | 62 | 61 | 57. |
| 7.0 | 39 | 53 | 53 | 53 | 49. |
| 7.5 | 34 | 47 | 47 | 46 | 43. |
| 8.0 | 31 | 42 | 41 | 41 | 38. |
| Wavelengths | Luminosity () |
|---|---|
| UV–near-IR (0.1–5 m) | |
| mid-IR (5–30 m) | |
| far-IR (30–300 m) | |
| bol (0.1–300 m) | |
| calculated stellar11The total bolometric output at Myr (see Figure 3). |