Goddard Robotic Telescope
- Optical Follow-up of GRBs and Coordinated Observations of AGNs -
Abstract
Since it is not possible to predict when a Gamma-Ray Burst (GRB) will occur or when Active Galactic Nucleus (AGN) flaring activity starts, follow-up/monitoring ground telescopes must be located as uniformly as possible all over the world in order to collect data simultaneously with Fermi and Swift detections. However, there is a distinct gap in follow-up coverage of telescopes in the eastern U.S. region based on the operations of Swift. Motivated by this fact, we have constructed a 14′′ fully automated optical robotic telescope, Goddard Robotic Telescope (GRT), at the Goddard Geophysical and Astronomical Observatory. The aims of our robotic telescope are 1) to follow-up Swift/Fermi GRBs and 2) to perform the coordinated optical observations of Fermi Large Area Telescope (LAT) AGN. Our telescope system consists of off-the-shelf hardware. With the focal reducer, we are able to match the field of view of Swift narrow instruments (20). We started scientific observations in mid-November 2008 and GRT has been fully remotely operated since August 2009. The 3 upper limit in a 30-second exposure in the R filter is 15.4 mag; however, we can reach to 18 mag in a 600-second exposures. Due to the weather condition at the telescope site, our observing efficiency is 30-40% on average.
keywords:
gamma ray , burst , AGN , optical1 Introduction
The -ray emission which comes from extremely energetic -ray sources such as Gamma-Ray Bursts (GRBs) and Active Galactic Nuclei (AGNs) (especially blazars) is believed to be produced by accelerated particles in a relativistic jet with bulk Lorentz factors of 100 for GRBs and 10 for AGNs. A GRB jet is formed when a massive star () collapses into a black hole [11, 3, 1]. On the other hand, an AGN jet is a continuous outflow from an active supermassive black hole ( ) [e.g. 8]. Although the energy scale and bulk motion of jets differ by an order of magnitude between GRBs and AGNs, their radiation processes are expected to be similar. Therefore, understanding radiation processes in the context of shock physics and particle acceleration using both GRBs and AGNs will provide a deeper understanding of the the fundamental physics in these extreme environments.
Recent observations of prompt GRB optical emission by ground/space robotic telescopes are providing key data for understanding the radiation mechanism of GRBs. The observations of GRB 050820A by RAPid Telescope for Optical Response (RAPTOR; [10]) and GRB 061121 by Swift UV/Optical Telescope (UVOT; [4]) indicate that there are at least two components in the prompt optical emission. One component is optical emission correlated with the prompt -ray emission. The other component is a smoothly rising and decaying component during the prompt -ray phase. The first component could be interpreted as emission from an internal shock because of the similar variability between the optical and -ray bands. The second component could be due to an external shock interacting with the inter-stellar matter. However, the Robotic Optical Transient Search Experiment (ROTSE) has shown that there are a couple of cases where the early optical emission does not correlate with the -ray emission (e.g. [6]). The extremely bright prompt optical emission from GRB 080319B observed by TORTORA and ’PI of the sky’ challenges the standard picture of the GRB emission model [5].
Blazars form a sub-group of radio-loud AGNs and show an extreme variability at all wavelengths [9]. The most accepted scenario is that a rotating supermasive black hole surrounded by an accretion disk with an intense plasma jet closely aligned to the line of sight is responsible for the blazar emission. However, fundamental understanding of the radiation process in blazars requires extensive monitoring campaigns at all wavelengths. In particular, properties of variability (including flares) and spectra from simultaneous data in various wavelengths provides key information for a physical understanding of blazars.
2 Motivation and Telescope Specification
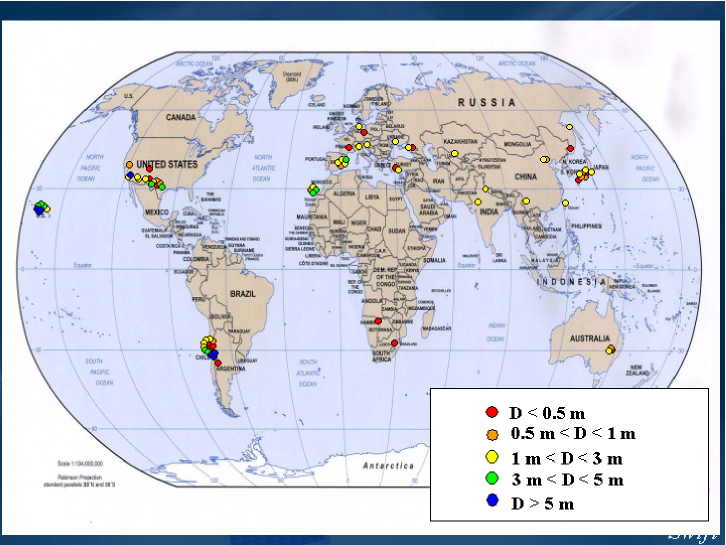
Since it is not possible to predict when a GRB will occur or when AGN flaring activity starts, follow-up/monitoring ground telescopes must be located as uniformly as possible all over the world in order to collect data simultaneously with Fermi and Swift detections. Based on the operations of Swift, however, we notice a distinct gap in follow-up coverage in the eastern U.S. region (Figure 1). This fact motivated us to construct a fully automated optical telescope at the Goddard Space Flight Center. If there is no GRB to observe, this telescope will perform extensive optical monitoring of Fermi Large Area Telescope (LAT) AGNs to identify the variability on the time scale of a day [7].
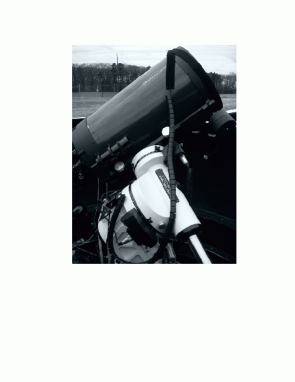
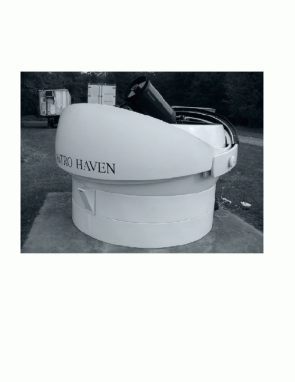
The Goddard Robotic Telescope (GRT) system consists of a 14′′ Celestron Optical Telescope Assembly (OTA), an Astro-Physics 1200GTO mount, an Apogee U47 CCD camera, a JMI electronic focuser (EV2CM) with a PC controller (PCFC), and a Finger Lake Instrumentation color filter wheel (CFW-1-8) with standard Johnson U, B, V, R, I and Clear filters. The quantum efficiency of the camera and the transmission curves of each filter are shown in Figure 2. With the focal reducer (Celestron f/6.3), a 20 field of view has been achieved. The observatory dome is an Astro Haven 7ft clam-shell dome. Opening and closing of the dome is controlled by the serial interface. Figures 4 and 4 are pictures of the telescope and the dome.
The dome, the weather station (Davis Instruments Vantage Pro2), the webcams (Logitech Quick Cam Chat), and the rain sensors are controlled by another Linux PC. The dome is directly connected by a serial port to the PC. The Linux-based weather station control software (wview111http://www.wviewweather.com/) and the webcam driver (spca5222http://mxhaard.free.fr/index.html) are used to control the weather station and the webcams. The signal from rain sensors (Asuzac Inc.) is recorded by the I/O board (Arduino333http://www.arduino.cc/), and used to close the dome automatically in case of rain.
The telescope site is the Goddard Geophysical and Astronomical Observatory (GGAO) which is about 1.5 miles northeast from the Goddard main campus.


3 Automation of the Observatory
The whole telescope system, including the telescope mount, the focuser, the CCD camera and the filter wheel, is controlled by the ACP Observatory Control Software.444http://acp.dc3.com/index2.html An advantageous feature of the ACP software is to perform a short test exposure (five seconds in our case) after each slew and to do astrometry automatically using the Guide Star Catalog555A user can specify either the Guide Star Catalog 1.1 or the USNO A2.0 catalog. to find the center sky coordinate of an image. If the pointing is off, ACP requests the mount to re-slew so that the requested position will be exactly at the center of an image. Furthermore, ACP will automatically construct a pointing model by recording an offset between the requested position and the actual slew position. This pointing model will be used for every slew to achieve a better pointing at the initial attempt.
We developed a script to make an observation schedule for a single night. This scheduler calculates the elevation of all objects in the database. It selects objects which are visible from the site (an elevation has to be larger than 35∘ to avoid the light pollution), and then schedules objects at the time when they reach the highest elevation. The output of the script is a text file with lines of ACP commands. ACP commands consist of an object name, a set of coordinates for each object, filters, exposure times of each filter, a bin size of images and the starting time of the observation. Since it is a text file, it is easy to modify the schedule by hand if we need to schedule an object which is not in the database. The sky flat, bias and dark frames are scheduled at the end of observations. The script runs once a day in the afternoon. This schedule file is automatically submitted through ACP by the observation control script which we describe next. As of September 2010, we have 58 Fermi LAT AGNs, 70 variable stars, 33 near-by galaxies to search for supernova, and 37 guest observers’ objects in the database.
A script to control the whole observatory has been developed. The script calculates the Sun’s elevation every 10 minutes and sends commands to ACP or to the dome at specific Sun elevations to perform actions such as opening/closing the dome, changing the CCD temperature, submitting the schedule or re-submitting the schedule in case of a termination of on-going observation for various reasons.
The GRB position information is received via a Gamma-ray bursts Coordinates Network (GCN) socket connection. Once the GRB position has been received, our custom GCN receiver code will calculate the elevation of the GRB at the site, and if it is observable (an elevation of a GRB has to be higher than 20∘ and also the Sun’s elevation has to be less than ), it will send commands to ACP to quit on-going observations and execute a GRB observation. We collect 200 frames of 5 sec, 80 frames of 30 sec, 120 frames of 60 sec and 72 frames of 100 sec exposure of the GRB field in the time order given. Based on a real-time observation of several GRBs, GRT took 47 sec on-average to terminate on-going observations and complete a slew to the GRB location. The initial exposure was made 66 sec on average after we received the GRB position information through the GCN.
The automatic script for LAT AGNs has also been developed to do the photometry. The script performs the relative photometry using Sextractor666http://terapix.iap.fr/rubrique.php?id_rubrique=91/ and PyRAF777http://www.stsci.edu/resources/software_hardware/pyraf adopting three reference stars defined for each object. The aperture photometry (IRAF phot task) is obtained using a circular extraction region of 5′′ for the source and an annulus with inner/outer radius of 5.5′′/6.25′′ for the background. The script also extracts the publically available light curves of Fermi LAT,888http://fermi.gsfc.nasa.gov/ssc/data/access/lat/msl_lc/ Swift BAT,999http://swift.gsfc.nasa.gov/docs/swift/results/transients/ and Swift XRT101010http://www.swift.psu.edu/monitoring/ of the AGNs. Examples of multi-band AGN light curves produced by this script are shown in Figure 5. All of the AGN light curves observed by GRT are available to the public from the dedicated web page.111111http://asd.gsfc.nasa.gov/Takanori.Sakamoto/GRT/index.html
In Figure 6, we summarize the automation of the observatory as a flowchart.


4 Performance
We used the observations of GRB 100915 to estimate the detection limit of our telescope system. The first several hours had good weather conditions. The CCD temperature was C. The observations were performed in the airmass range from 1.13 to 1.27 (about four hours) collecting 423 frames in total with four different exposures (5 sec, 30 sec, 60 sec and 100 sec). All the light frames are in the R filter and corrected for the bias, the dark and the flat. First, we extract the sources in the image using Sextractor. Then, we perform photometry using the IRAF phot task. The aperture foreground radius is 1.6 times the averaged FWHM of extracted sources. The background annulus with inner and outer radius are, respectively, 1.75 and 2.0 times the averaged FWHM of the extracted sources. A signal-to-noise ratio of extracted sources is calculated using the IRAF phot result.121212The signal and the noise are calculated by and The USNO B1 catalog R1 magnitude is used as the R magnitude of the extracted sources. The 3 detection limit has been defined by fitting the signal-to-noise versus R magnitude data, and finding the 3 crossing point to the fit (see Figure 7). The 3 detection limit of a 30 sec exposure in R is 15.4 mag. To understand the detection limit as a function of exposure time, we repeated the same analysis of the images with different exposures (5 sec, 30 sec, 60 sec, 120 sec, 180 sec, 300 sec and 600 sec). We stacked 30 sec images using swarp131313http://terapix.iap.fr/rubrique.php?id_rubrique=49 to create images with 30 sec exposure. The relationship between the 3 detection limit and exposure time is shown in Figure 8. We reached 18 mag in a 600 sec exposure.
In Figure 9, we summarize the fraction of good observations for each month for four AGN observations. Although we experienced few months with 60% of good weather night, the typical fraction of observable nights is 30-40%.


5 Current Status
We started fully automatic operation in mid-November 2008. Although, at the beginning, we had conservative operations by having a duty operator every night, GRT is completely human free as of August 2009. We are currently observing 85 objects and collecting 350 images per night.
Our optical contribution to the multi-wavelength observing campaign of the -ray outburst of 3C 454.3 has been published [2]. Further collaborations with the Fermi/LAT team for Mrk 421, Mrk 501, 1ES 1959+650 and MG4 J200112+4352 are on-going.
We have performed 13 follow-up observations of GRBs (12 Swift GRBs and one INTEGRAL GRB). Three of them were observed within 10 minutes after the GRB trigger. Although there is no detection of prompt optical emission or an afterglow so far, we confirmed that GRT can achieve a 17.5 to 19 magnitude limit in the R filter, and also respond automatically and promptly to a GRB through the GCN socket connection.
6 Acknowledgements
We would like to thank the anonymous reviewers for comments and suggestions that materially improved the paper. We also would like to thank H. A. Krimm for carefully reading the paper.
References
- MacFadyen & Woodley [1999] Collapsars: Gamma-Ray Bursts and Explosions in “Failed Supernovae”, MacFadyen, A. I., Woosley, S. E., 1999, ApJ, 524, 262-289
- Pacciani et al. [2010] The 2009 December Gamma-ray Flare of 3C 454.3: The Multifrequency Campaign, Pacciani, L., Vittorini, V., Tavani, M. et al. 2010, ApJL, 716, 170-175
- Paczyński [1998] Are Gamma-Ray Bursts in Star-Forming Regions?, Paczyński, B. 1998, ApJL, 494, 45-48
- Page et al. [2007] GRB 061121: Broadband Spectral Evolution through the Prompt and Afterglow Phases of a Bright Burst, Page, K. L., Willingale, R., Osborne, J. P. et al. 2007, ApJ, 663, 1125-1138
- Racusin et al. [2008] Broadband observations of the naked-eye γ-ray burst GRB080319B, Racusin, J. L., Karpov, S. V., Sokolowski, M. et al. 2008, Nature, 455, 183-188
- Rykoff et al. [2005] Prompt Optical Detection of GRB 050401 with ROTSE-IIIa, Rykoff, E. S., Yost, S. A., Krimm, H. A. et al. 2005, ApJL, 631, 121-124
- Totani et al. [2005] A Discovery of Rapid Optical Flares from Low-Luminosity Active Nuclei in Massive Galaxies, Totani, T., Sumi, T., Kosugi, G. et al. 2005, ApJL, 621, 9-12
- Urry & Padovani [1995] Unified Schemes for Radio-Loud Active Galactic Nuclei, Urry, C. M., Padovani, P., 1995, PASP, 107, 803-845
- Urry [1999] Multiwavelength properties of blazars, Urry, C. M. 1999, Astropart.Phys, 11, 159-167
- Vestrand et al. [2006] Energy input and response from prompt and early optical afterglow emission in -ray bursts, Vestrand, W. T., Wren, J. A., Wozniak, P. R. et al. 2006, Nature, 442, 172-175
- Woosley [1993] Gamma-ray bursts from stellar mass accretion disks around black holes, Woosley, S. E. 1993, ApJ, 405, 273-277