IGR J165471916/1RXS J165443.5191620 — a New Intermediate Polar from the INTEGRAL Galactic Survey
Will be published in ’’Astronomy Letters’’, 2010, V.36, N12, pp.904-909
1 Space Research Institute, Moscow,
117997, Profsoyuznaya str. 84/32, Russia
2 Tübingen University, Tübingen, Germany
3 Kazan (Volga Region) Federal University, Kremlevskaya
ul. 18, Kazan, 420008 Russia
Received July 1, 2010
We present the results of our optical identification of the X-ray source IGR J16547-1916 detected by the INTEGRAL observatory during a deep all-sky survey. Analysis of the spectroscopic data from the SWIFT and INTEGRAL observatories in the X-ray energy band and from the BTA (Special Astrophysical Observatory) telescope in the optical band has shown that the source is most likely an intermediate polar – an accreting white dwarf with the mass of in a low-mass binary system. Subsequent studies of the object’s rapid variability with the RTT-150 telescope have confirmed this conclusion by revealing periodic pulsations of its optical emission with a period of s.
Keywords: cataclysmic variables, intermediate polars, white dwarfs
∗ e-mail: aal@iki.rssi.ru
INTRODUCTION
The surveys that make it possible to measure the space density of binary systems with accreting white dwarfs are very rare. This is mainly because such objects are detected mostly in the optical band according to various criteria that can barely be described quantitatively (outbursts, variability, eclipses, etc). X-ray sky surveys have significant advantages in this sense. Such surveys have well-defined limits of sensitivity to sources in different parts of the sky, which allows the densities of various components of the Galactic stellar population to be estimated more reliably (see, e.g., Hertz and Grindlay 1984; Verbunt et al. 1997; Grimm et al. 2002; Revnivtsev et al. 2008). One of the currently best Galactic hard X-ray surveys is the INTEGRAL survey (see, e.g., Krivonos et al 2007, 2010; Bird et al. 2010). However, to carry out statistical studies and to make reliable estimates of the densities of objects using the survey results, it is necessary that the completeness of the optical identifications of cataloged objects be high enough. For this purpose, several groups in the world systematically perform observations of the objects detected by the INTEGRAL observatory in an effort to establish their nature (see, e.g., Bikmaev et al. 2006, 2008; Burenin et al. 2008, 2009; Sazonov et al. 2008; Masetti et al. 2007, 2010; Tomsik et al. 2008, 2009). Persistent bright hard X-ray sources in our Galaxy are not that many – about 180, according to the latest catalog by Krivonos et al. (2010); only 33 of them are accreting white dwarfs. This means that determining the nature of each Galactic source of such a brightness is of considerable value.
The source IGR J16547-1916 has been detected at a statistically significant level by INTEGRAL only in the sum map obtained over seven years of its in- orbit operation with a flux of mCrab ( erg s-1 cm-2) in the keV energy band (Krivonos et al. 2010; see also Bird et al. 2010). The source has been previously observed in the ROSAT all-sky survey and is designated as 1RXS J165443.5-191620. Here, based on a comprehensive analysis of the spectroscopic and timing data from the INTEGRAL and SWIFT X-ray observatories and the optical BTA (Special Astrophysical Observatory, SAO) and RTT-150 Russian-Turkish (TUBITAK Observatory, Turkey) telescopes, we show that IGR J16547-1916 is most probably an intermediate polar – an accreting white dwarf whose magnetic field is strong enough to destroy the disk flow near the white dwarf surface but is not strong enough to completely prevent its formation (see, e.g., Patterson 1994).
1 OPTICAL IDENTIFICATION
The source IGR J16547-1916 is detected at a statistically significant level in the sum all-sky map obtained by INTEGRAL over seven years of its in-orbit operation. The effective exposure time of the sky region under consideration was Ms. The position of the source on the celestial sphere was determined from these data with an uncertainty of 3(Krivonos et al. 2010).
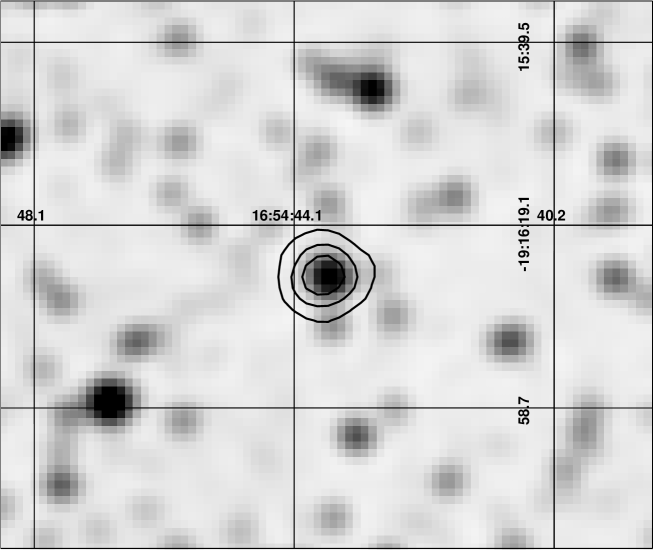
To determine the source position with a higher accuracy (up to arcseconds) and to construct its soft ( keV, see below) X-ray spectrum, we used the XRT/SWIFT data obtained on January 21 and 23, 2010, (ObsID 90182) in the Photon Counting mode with a total exposure time of ks. The source was detected at a statistically significant level in both observations with approximately the same flux, which allowed us to refine its coordinates, RA=16h 54m 43.7s, Dec=-191630(J2000), and to improve the accuracy of their determination . One optical object with a magnitude (see Fig. 1) visible on the digitized Palomar Observatory Sky Survey plates falls with confidence into the error box of IGR J16547-1916. To establish the nature of the source, its spectroscopic observations were performed with the 6-m BTA telescope (SAO, the Russian Academy of Sciences) in June 2010. The spectroscopic observations were performed on the night of June 9, 2010, with the SCORPIO spectrometer (Afanasiev and Moiseev 2005). A 1-wide long slit and a 400 lines mm-1 diffraction grating were used in the observations; the total exposure time was 600 s. This allowed a highquality spectrum of the source to be obtained in the range from 3900 to with a resolution of .
The optical spectrum of this object is shown in Fig. 2. It exhibits a blue continuum and a set of intense hydrogen and helium emission lines that are typical of the spectra of accretion disks around white dwarfs (see, e.g., Williams and Fergusson 1982). Thus, this object is a cataclysmic variable – an accreting white dwarf in a binary system. Recently, Masetti et al. (2010) have reached the same conclusion based on optical spectroscopic observations.
2 OPTICAL VARIABILITY
To investigate the temporal variability of the optical emission from IGR J16547-1916, photometric observations of this object were performed with the RTT-150 telescope. The observations were performed with the medium- and low-resolution TFOCS spectrometer on the night of June 27, 2010, for 2.3 h. A total of 297 measurements of the optical flux from the source were obtained with a time resolution of about 30 s. The Lomb-Scargle periodogram of the derived light curve (see Fig. 3a) revealed brightness oscillations in the source with a period of about s (see Fig. 3b). The brightness oscillations were coherent throughout the observations (as far as this can be judged from a 8000-s-long time series).
The detected brightness oscillations can be caused either by the orbital brightness variability in the binary system or by the variability related to the white dwarf spin. An orbital period of s seems too short for a hard X-ray source; binary systems with such short orbital periods usually accrete matter without disk formation and have a fairly soft X-ray spectrum (see V407 Vul, ES Cet, AM CVn). In our case, we are most likely dealing with the white dwarf spin period and the orbital period of the binary system is considerably longer than 549 s. Consequently, IGR J16547-1916 is an intermediate polar.
3 X-RAY SPECTROSCOPY
Figure 4 shows a broadband spectrum of IGR J16547-1916/1RXS J165443.5-191620 in the 0.6120 keV energy band constructed from SWIFT and INTEGRAL data. It should be noted that, although the ’’soft’’ ( keV) part of the spectrum was obtained in January 2010 and the ’’hard’’ ( keV) one was accumulated in the period from 2003 to 2009, they agree well with each other, which may be indicative of a relatively constant spectral shape. Therefore, we subsequently fitted the source spectrum in a wide energy range by a single model, leaving the normalization of the INTEGRAL spectrum as a free parameter.
On the whole, the spectrum of IGR J16547-C1916 can be well described by the model of partially absorbed (i.e., when only part of the emergent radiation is intercepted and absorbed by the medium) bremsstrahlung with a temperature of keV. The best-fit parameters are given below:
| , keV | , | , 1022 cm-2 | ||||
|---|---|---|---|---|---|---|
| 0.83 |
Here, is the emitting-plasma (bremsstrahlung) temperature, K is the normalization of the bremsstrahlung spectrum given in units and defined by the expression
| (1) |
where is the distance to the source in cm, is the electron number density in the emitting plasma, and is its volume; is the fraction of the absorbed radiation in neutral matter with an equivalent column density , is the measured flux in the keV energy band, is the unabsorbed flux in the keV energy band (they are given in units of erg s-1 cm-2). It is interesting to check whether the derived emitting-plasma parameters are consistent with the assumption that the source being studied is an intermediate polar. Using the normalization obtained, we can estimate the radius of the accretion column on the white dwarf surface based on its simplest single-zone model (Warner 1995). Based on this model, we can determine and the column height by assuming the composition of the accreting plasma to be solar:
| (2) |
| (3) |
where is the white dwarf mass expressed in solar masses, is the local accretion rate in g s-1 cm-2, is the white dwarf radius in units of cm. The accretion column radius is then
| (4) |
i.e., several percent of the white dwarf radius, in good agreement with the present views. Here, we use the designation pc.
For a more physical description of the broadband spectrum for IGR J165471916, we used a grid of accretion column model spectra from Suleimanov et al. (2005) (see also Revnivtsev et al. 2004) in which the white dwarf mass is the only parameter. The maximum possible plasma temperature in the accretion column and, hence, the characteristic energy of the exponential cutoff in the source energy spectrum depends on the white dwarf mass. Despite a moderate quality of the hard X-ray spectroscopic data, we can roughly estimate the mass of the white dwarf in the binary system: . The best-fit parameters are given below (the notation is the same as that above):
| , 1022 cm-2 | |||
|---|---|---|---|
| 0.83 |
4 CONCLUSIONS
Here, we presented the results of X-ray and optical observations of the source IGR J16547-1916 from the INTEGRAL survey. We showed the following:
– The optical spectrum of the source has all the signatures typical of cataclysmic variables (accreting white dwarfs) – a blue continuum with a series of intense Balmer emission lines and a distinct HeII line.
– Our analysis of the optical variability of the source revealed coherent (as far as this can be judged from our relatively short observations) brightness oscillations with a period of s. We hypothesize that this period is the spin period of the white dwarf. Hence it follows that the source belongs to the class of intermediate polars, i.e., accreting white dwarfs whose magnetic field is strong enough to destroy the disk flow near the white dwarf surface but is not strong enough to completely prevent it formation.
– The broadband X-ray ( keV) spectrum of the source is well described by a model typical of intermediate polars.the model of optically thin emission from a plasma heated in a shock wave near the white dwarf surface. The shape of the source spectrum at energies above keV allows a simple estimate of the white dwarf mass to be made: .
5 ACKNOWLEDGMENTS
We wish to thank T. Fatkhullin for help in conducting the observations with the BTA (SAO) telescope and S. Tsygankov for help in reconstructing the source spectrum from INTEGRAL data. This work was supported by the Russian Foundation for Basic Research (project nos. 10-02-00492, 10-02-01442, 10-02-91223, 09-02-97013-p-povolzh’ye- ), the Russian Academy of Sciences (the ’’Origin, Structure, and Evolution of Objects in the Universe’’ and ’’Active and Stochastic Processes in the Universe’’ Program), the Program of the President of Russia for support of scientific schools (grant no. NSh- 5069.2010.2) and the government contract 14.740.11.0611. Authors thank to Shtaerman for the translation of the paper.
REFERENCES
1. V. L. Afanasiev and A. V. Moiseev, Astron. Lett. 31, 194 (2005).
2. I. F. Bikmaev, R. A. Burenin, M. G. Revnivtsev, et al., Astron. Lett. 34, 653 (2008).
3. I. F. Bikmaev, M. G. Revnivtsev, R. A. Burenin, and R. A. Sunyaev, Astron. Lett. 32, 588 (2006).
4. A. Bird, A. Bazzano, L. Bazzani, et al., Astrophys. J. Suppl. Ser. 186, 1 (2010).
5. R. A. Burenin, I. F. Bikmaev,M. G. Revnivtsev, et al., Astron. Lett. 35, 71 (2009).
6. R. A. Burenin, A. V. Meshchepyakov, M. G. Revnivtsev, et al., Astron. Lett. 34, 367 (2008).
7. H.-J. Grimm, M. Gilfanov, and R. Sunyaev, Astron. Astrophys. 391, 923 (2002).
8. P. Hertz and J. Grindlay, Astrophys. J. 278, 137 (1984).
9. R. Krivonos, M. Revnivtsev, A. Lutovinov, et al., Astron. Astrophys. 475, 775 (2003).
10. R. Krivonos, S. Tsygankov, M. Revnivtsev, et al., Astron. Astrophys. (2010, in press); http://arxiv.org/abs/1006.4437.
11. N. Masetti, R. Landi, M. Pretorius, et al., Astron. Astrophys. 470, 331 (2007).
12. N. Masetti, P. Parisi, E. Palazzi, et al., Astron. Astrophys. (2010, in press); http://arxiv.org/abs/1006.4513.
13. J. Patterson, Publ. Astron. Soc. Pacif. 106, 209 (1994).
14. M. G. Revnivtsev, A. Yu. Knyazev, S. Yu. Sazonov, et al., Astron. Lett. 35, 35 (2009).
15. M. G. Revnivtsev, A. A. Lutovinov, V. F. Suleimanov, et al., Astron. Lett. 30, 772 (2004).
16. M. Revnivtsev, A. Lutovinov, E. Churazov, et al., Astron. Astrophys. 491, 209 (2008).
17. S. Sazonov,M. Revnivtsev, R. Burenin, et al., Astron. Astrophys. 487, 509 (2008).
18. V. Suleimanov, M. Revnivtsev, and H. Ritter, Astron. Astrophys. 435, 191 (2005).
19. J. Tomsick, S. Chaty, J. Rodriguez, et al., Astrophys. J. 685, 1143 (2008).
20. J. Tomsick, S. Chaty, J. Rodriguez, et al., Astrophys. J. 701, 811 (2009).
21. F. Verbunt, W. Bunk, H. Ritter, and E. Pfeffermann, Astron. Astrophys. 327, 602 (1997).
22. R. E. Williams and D. H. Ferguson, Astrophys. J. 257, 672 (1982).
23. C. Winkler,T. Courvoisier, G. Di Cocco, et al.,A stron. Astrophys. 411, L1 (2003).
erg s-1 cm-2

,

