Dense Molecular Gas Excitation at High Redshift:
Detection of HCO+(=43) Emission in the Cloverleaf Quasar
Abstract
We report the detection of HCO+(=43) emission in the Cloverleaf Quasar at =2.56, using the IRAM Plateau de Bure Interferometer. HCO+ emission is a star formation indicator similar to HCN, tracing dense molecular hydrogen gas (cm-3) within star-forming molecular clouds. We derive a lensing-corrected HCO+(=43) line luminosity of K km s-1 pc2, which corresponds to only 48% of the HCO+(=10) luminosity, and 4% of the CO(=32) luminosity. The HCO+ excitation thus is clearly subthermal in the =43 transition. Modeling of the HCO+ line radiative transfer suggests that the HCO+ emission emerges from a region with physical properties comparable to that exhibiting the CO line emission, but 2 higher gas density. This suggests that both HCO+ and CO lines trace the warm, dense molecular gas where star formation actively takes place. The HCO+ lines have only 2/3 the width of the CO lines, which may suggest that the densest gas is more spatially concentrated. In contrast to the =3.91 quasar APM 08279+5255, the dense gas excitation in the Cloverleaf is consistent with being purely collisional, rather than being enhanced by radiative processes. Thus, the physical properties of the dense gas component in the Cloverleaf are consistent with those in the nuclei of nearby starburst galaxies. This suggests that the conditions in the dense, star-forming gas in active galactic nucleus-starburst systems at early cosmic times like the Cloverleaf are primarily affected by the starburst itself, rather than the central active black hole.
Subject headings:
galaxies: active — galaxies: starburst — galaxies: formation — galaxies: high-redshift — cosmology: observations — radio lines: galaxies1. Introduction
Investigating the dense molecular interstellar medium (ISM) in distant galaxies is of fundamental importance for our general picture of galaxy formation and evolution in the early universe, as it is found in the regions where active star formation occurs. Due to the fact that CO exhibits the brightest emission lines of all molecules, it is a good tracer for molecular clouds and the diffuse, gaseous ISM; i.e., the total amount of potential fuel for star formation (see Solomon & Vanden Bout 2005 for a review). However, the low density required to excite CO ( cm-3) also means that it is not a specific tracer of the molecular cloud cores where star formation actively takes place. In contrast, recent studies have shown that high dipole moment molecules like HCO+ and HCN are substantially better tracers of cloud cores. This is due to the fact that such molecules trace much denser gas ( cm-3) than CO emission (e.g., Gao & Solomon 2004a, 2004b).
As they only trace the densest regions of the ISM (and are less abundant), emission from rotational transitions of dense gas tracers is typically by at least an order of magnitude fainter than emission from CO lines. Thus, studies of the dense ISM in high redshift galaxies are currently focused on only few, bright targets. Consequently, high- HCN and HCO+ emission was first detected in the Cloverleaf quasar (=2.56), the brightest known CO line emitter at the time (Solomon et al. 2003; Riechers et al. 2006). Both molecules were detected in the ground-state =10 transitions, which trace the full amount of dense gas. Despite a number of physical and chemical processes that affect HCN and HCO+ in different ways, their respective =10 lines show comparable strengths, indicating that the emission is likely optically thick.
To understand the physical conditions in the dense, star-forming molecular gas in more detail, it is necessary to study multiple rotational lines from dense gas tracers. Previous searches for HCO+(=43) and HCN(=43) line emission in the Cloverleaf quasar were unsuccessful (Wilner et al. 1995; Solomon et al. 2003; see also Barvainis et al. 1997). The limits indicate a comparatively low excitation of HCN, but are not constraining for HCO+, given the measured =10 line luminosities.
In this Letter, we report the detection of HCO+(=43) emission toward the Cloverleaf quasar (=2.56), using the IRAM Plateau de Bure Interferometer (PdBI). This enables us to investigate the dense molecular gas excitation in a high- galaxy, constraining the physical conditions for star formation out to the early universe. We use a concordance, flat CDM cosmology throughout, with =71 km s-1 Mpc-1, =0.27, and =0.73 (Spergel et al. 2003, 2007).
2. Observations
We observed the HCO+(=43) transition line (GHz) toward H1413+117 (the Cloverleaf quasar), using the PdBI. At the target redshift of =2.55784 (e.g., Barvainis et al. 1994; Weiß et al. 2003), the line is shifted to 100.267 GHz (2.99 mm). A total bandwidth of 580 MHz (1700 km s-1) was used to cover the HCO+(=43) line and the underlying 3 mm (rest-frame 840 m) continuum emission. Observations were carried out under acceptable to good 3 mm weather conditions during 10 tracks in D configuration between 2006 May 12 and August 20. The total integration time amounts to 70.2 hr using 4, 5, or 6 antennas, resulting in 10.8 hr 6 antenna-equivalent on-source time after discarding unusable visibility data. The nearby sources B1354+195 and B1502+106 (distance to the Cloverleaf: and ) were observed every 20 minutes for pointing, secondary amplitude and phase calibrations. For primary flux and bandpass calibration, several nearby calibrators (MWC349, CRL618, 3C84, 3C273, 3C279, 3C345, and 3C454.3) were observed during all runs, leading to a calibration that is accurate within 10–15%.
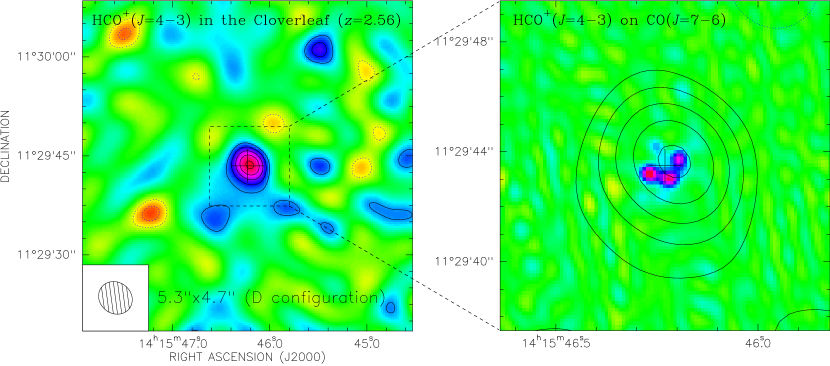
For data reduction and analysis, the IRAM GILDAS package was used. All data were mapped using the CLEAN algorithm and ‘natural’ weighting; this results in a synthesized beam of 5.3 ′′4.7 ′′ (40 kpc at = 2.56). The final rms is 0.31 mJy beam-1 over 95 MHz (corresponding to 284 km s-1), and 0.79 mJy beam-1 over 15 MHz (45 km s-1).
3. Results
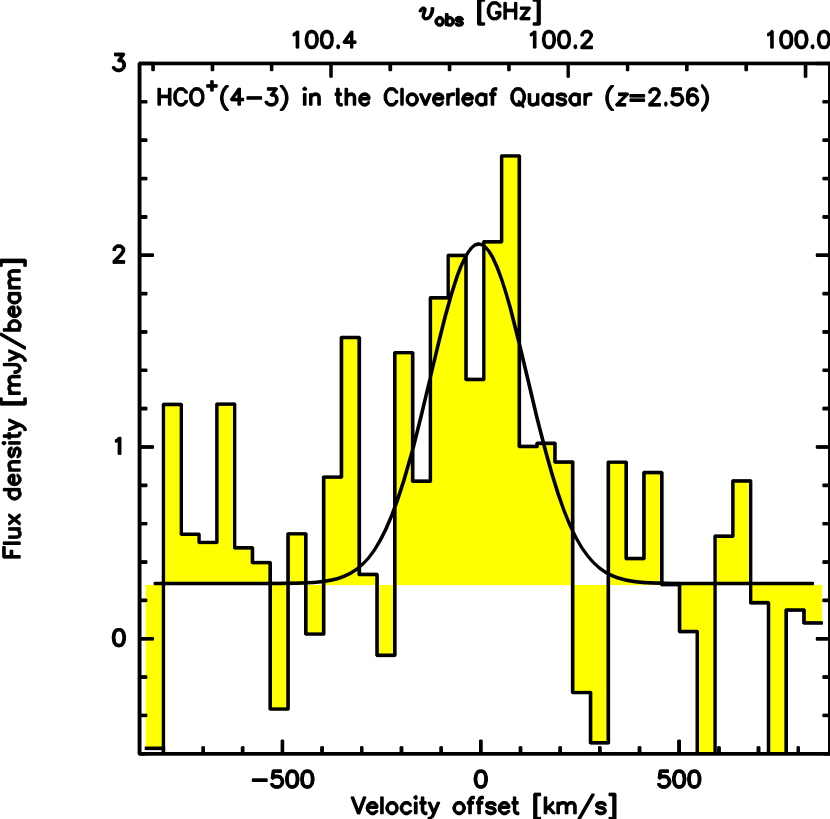
We have detected HCO+(=43) line emission toward the Cloverleaf quasar (=2.56) at 6 significance (Fig. 1). From Gaussian fitting to the line profile, we obtain a HCO+(=43) line peak strength of 1.770.35 mJy at a FWHM of 28879 km s-1, on top of 0.290.14 mJy continuum emission (consistent with 0.30.1 mJy as measured at 93 GHz and the dust spectral energy distribution; Henkel et al. 2010; Weiß et al. 2003). This corresponds to a velocity-integrated emission line strength of 0.540.09 Jy km s-1, and a line luminosity of K km s-1 pc2 (where =11 is the lensing magnification factor; Venturini & Solomon 2003), i.e., only 4% of the CO(=32) luminosity, and 35% of the CN(=32) luminosity (Weiß et al. 2003; Riechers et al. 2007a).
The line FWHM is only 70% of that of the CO(=32) line (Weiß et al. 2003). With this new constraint, we re-visited the HCO+(=10) line data by Riechers et al. (2006; taken with substantially narrower bandwidth), which already showed some evidence for a narrower line than CO. The HCO+(=10) data can be fitted well with a (beam-corrected) line peak strength of 0.2490.028 mJy at a FWHM of 26352 km s-1.111This width is also consistent with that of the HCN(=10) line (Solomon et al. 2003). This corresponds to a velocity-integrated emission line strength of 0.0690.008 Jy km s-1, and a line luminosity of K km s-1 pc2, which is consistent with the previously derived value (Riechers et al. 2006) within the errors. More importantly, this corresponds to a HCO+ =43/10 line brightness temperature ratio of =0.480.11, i.e., the HCO+(=43) line is clearly subthermally excited.222Or optically thin, but see Sect. 4. This is consistent with the previous limit of 4 (Wilner et al. 1995; Riechers et al. 2006). We also set a 3 lower limit of 0.59 on the HCO+/HCN =43 line ratio, consistent with the =10 line ratio of 0.8 within the errors (Riechers et al. 2006; HCN =43 limit from Solomon et al. 2003).
4. HCO+ and CO Line Excitation Modeling
Based on the HCO+ excitation ladder of the Cloverleaf, we can constrain the line radiative transfer of the dense molecular gas component through Large Velocity Gradient (LVG) models, treating the gas kinetic temperature and density as free parameters. To maximize the available observational constraints on these parameters, we here simultaneously model the HCO+ and CO excitation, and also require that our solutions are consistent with the dust spectral energy distribution of the Cloverleaf (Weiß et al. 2003).
Our models use the HCO+ and CO collision rates from Flower (1999, 2001). We adopt a HCO+ abundance per velocity gradient of [HCO+]/(( km s-1)-1, and [HCO+/CO]=10-4 (e.g., Wang et al. 2004). The HCO+ data are fit well by a spherical, single-component model with a kinetic temperature of =50 K, a gas density of =104.8 cm-3, and a CO disk filling factor of 22% (=785 pc, assuming =11; right panel in Fig. 3). In this model, the HCO+ =10 and 43 lines have optical depths of =3.1 and =25.4 and excitation temperatures of =36.7 K and =24.4 K. This suggests that the emission in both transitions is optically thick, and that the HCO+(=43) line, indeed, is subthermally excited.
The (literature) CO data are fit well by a spherical, single-component model with a kinetic temperature of =50 K, a gas density of =104.5 cm-3, and a 5.5 higher surface filling factor than HCO+ (left panel in Fig. 3). These parameters are compatible with the CO excitation analysis of Bradford et al. (2009). Our analysis thus suggests that the CO and HCO+ excitation in the Cloverleaf can be modeled simultaneously, with the same kinetic temperatures and only a factor of 2 difference in gas densities.
To explore the remaining uncertainties, we also attempted to fit the HCO+ data with and fixed to those of the CO model, but varying the relative molecular abundance. We find an acceptable solution when increasing the relative HCO+ abundance to [HCO+]/(( km s-1)-1, i.e., [HCO+/CO]=10-3.5, and the HCO+ surface filling factor to 24% (see dashed and dotted lines in Fig. 3).
Overall, the models suggest a relatively high median gas density in this galaxy, and that the CO and the HCO+ emission likely trace the same warm, dense molecular ISM phase, with HCO+ tracing the densest 15–20% of the gas. Given that the HCO+ lines have only 2/3 of the width of the CO lines, this may suggest that the emission region with the densest gas is more spatially concentrated than the overall CO emission, such as, e.g., in a nuclear starburst. Higher spatial resolution HCO+ observations are required to confirm this scenario, and to investigate potential differential lensing effects.

5. Discussion
We have detected bright, but subthermally excited HCO+(=43) emission toward the Cloverleaf quasar at =2.56. Based on excitation modeling, we find that the warm, dense gas traced by HCO+ appears to be associated with the warm gas phase traced by the CO lines, picking out its densest regions.
The HCO+ excitation in the Cloverleaf is consistent with that seen in the starburst nucleus of NGC 253, with HCO+ =43/10 ratios of =0.480.11 and 0.53 (Knudsen et al. 2007), respectively. Intriguingly, the Cloverleaf and the nucleus of NGC 253 also have comparable HCO+/HCN =10 line ratios of 0.8. The in the Cloverleaf is higher than that in the infrared-luminous galaxies NGC 6240 (0.210.06) and Arp 220 (0.330.12; Greve et al. 2009). However, this is likely due to the fact that the line ratios are averaged over virtually the entire molecular line emission regions, rather than just the nuclei. As shown by Iono et al. (2007; their Fig. 10), the in NGC 6240 scatters up to values of 0.6 within the HCO+-emitting region, indicating that the ratio is comparable to the Cloverleaf in the densest regions. Thus, it seems plausible that the dense gas excitation in the Cloverleaf is comparable to what is found in the nuclear regions of nearby starburst galaxies and luminous infrared galaxies.
The relatively high median gas density in the Cloverleaf suggested by the HCO+ and CO observations is also consistent with its location on the HCO+–far-infrared luminosity relation (Riechers et al. 2006) within the framework of the model description of Krumholz & Thompson (2007). In fact, it may be the most direct evidence that the increasing slope in dense gas-star formation relations observed toward the most luminous, high redshift systems (Gao et al. 2007; Riechers et al. 2007b) is indeed related to an elevated median gas density relative to lower-luminosity systems.
Besides APM 08279+5255 (=3.91), the Cloverleaf is only the second high- galaxy in which multiple transitions of a dense gas tracer were detected (e.g., Wagg et al. 2005; Garcia-Burillo et al. 2006; Weiß et al. 2007; Guelin et al. 2007; Riechers et al. 2009, 2010). Modeling of the HCN line ladder in APM 08279+5255 suggests that the emission in high- HCN transitions is substantially enhanced by radiative excitation through pumping of mid-infrared ro-vibrational lines (Weiß et al. 2007; Riechers et al. 2010). In contrast, the HCO+ excitation in the Cloverleaf is consistent with purely collisional excitation. Given the comparable critical densities of HCN and HCO+, this suggests that we have identified a clear difference in the dense gas excitation conditions between these two high- systems.
This investigation highlights the importance of studying the excitation of dense gas tracers to understand differences in the conditions for star formation in high redshift galaxies. Such studies will become routine with the advent of broad instantaneous bandwidth systems as part of future facilities such as the Atacama Large (sub-) Millimeter Array (ALMA), which will allow to frequently cover lines of multiple dense gas tracers as part of ‘standard’ high- CO observations.
References
- Alloin et al. (1997) Alloin, D., Guilloteau, S., Barvainis, R., Antonucci, R., & Tacconi, L., 1997, A&A, 321, 24
- Barvainis et al. (1994) Barvainis, R., Tacconi, L., Antonucci, R., Alloin, D., & Coleman, P. 1994, Nature, 371, 586
- Barvainis et al. (1997) Barvainis, R., Maloney, P., Antonucci, R., & Alloin, D. 1997, ApJ, 484, 695
- Bradford et al. (2009) Bradford, C. M., et al. 2009, ApJ, 705, 112
- Chabrier (2003) Chabrier, G. 2003, PASP, 115, 763
- Downes & Solomon (1998) Downes, D., & Solomon, P. M. 1998, ApJ, 507, 615
- Flower (1999) Flower, D. R. 1999, MNRAS, 305, 651
- Flower (2001) Flower, D. R. 2001, J. Phys. B: At. Mol. Opt. Phys., 34, 2731
- Gao & Solomon (2004a) Gao, Y., & Solomon, P. M. 2004a, ApJS, 152, 63
- Gao & Solomon (2004b) Gao, Y., & Solomon, P. M. 2004b, ApJ, 606, 271
- Gao et al. (2007) Gao, Y., Carilli, C. L., Solomon, P. M., & Vanden Bout, P. A. 2007, ApJ, 660, L93
- García-Burillo et al. (2006) García-Burillo, S., et al. 2006, ApJ, 645, L17
- Greve et al. (2009) Greve, T. R., Papadopoulos, P. P., Gao, Y., & Radford, S. J. E. 2009, ApJ, 692, 1432
- Guélin et al. (2007) Guélin, M., et al. 2007, A&A, 462, L45
- Henkel et al. (2010) Henkel, C., Downes, D., Weiß, A., Riechers, D., & Walter, F. 2010, A&A, 516, A111
- Iono et al. (2007) Iono, D., et al. 2007, ApJ, 659, 283
- Knudsen et al. (2007) Knudsen, K. K., Walter, F., Weiß, A., Bolatto, A., Riechers, D. A., & Menten, K. 2007, ApJ, 666, 156
- Krumholz & Thompson (2007) Krumholz, M. R., & Thompson, T. A. 2007, ApJ, 669, 289
- Riechers et al. (2006) Riechers, D. A., Walter, F., Carilli, C. L., Weiß, A., Bertoldi, F., Menten, K. M., Knudsen, K. K., & Cox, P. 2006, ApJ, 645, L13
- Riechers et al. (2007a) Riechers, D. A., Walter, F., Cox, P., Carilli, C. L., Weiß, A., Bertoldi, F., & Neri, R. 2007a, ApJ, 666, 778
- Riechers et al. (2007b) Riechers, D. A., Walter, F., Carilli, C. L., & Bertoldi, F. 2007b, ApJ, 671, L13
- Riechers et al. (2009) Riechers, D. A., Walter, F., Carilli, C. L., & Lewis, G. F. 2009, ApJ, 690, 463
- Riechers et al. (2010) Riechers, D. A., Weiß, A., Walter, F., & Wagg, J. 2010, ApJ, in press (arXiv:1010.2485)
- Solomon et al. (2003) Solomon, P., Vanden Bout, P., Carilli, C., & Guelin, M. 2003, Nature 426, 636
- Solomon & Vanden Bout (2005) Solomon, P. M., & Vanden Bout, P. A. 2005, ARA&A, 43, 677
- Spergel et al. (2003) Spergel, D. N., et al. 2003, ApJS, 148, 175
- Spergel et al. (2007) Spergel, D. N., et al. 2007, ApJS, 170, 377
- Tsuboi et al. (1999) Tsuboi, M., Miyazaki, A., Imaizumi, S., & Nakai, N. 1999, PASJ, 51, 479
- Venturini & Solomon (2003) Venturini, S., & Solomon, P. M. 2003, ApJ, 590, 740
- Wagg et al. (2005) Wagg, J., Wilner, D. J., Neri, R., Downes, D., & Wiklind, T. 2005, ApJ, 634, L13
- Wang et al. (2004) Wang, M., Henkel, C., Chin, Y.-N., Whiteoak, J. B., Hunt Cunningham, M., Mauersberger, R., & Muders, D. 2004, A&A, 422, 883
- Weiss et al. (2003) Weiß, A., Henkel, C., Downes, D., & Walter, F. 2003, A&A, 409, L41
- Weiß et al. (2007) Weiß, A., Downes, D., Neri, R., Walter, F., Henkel, C., Wilner, D. J., Wagg, J., & Wiklind, T. 2007, A&A, 467, 955
- Wilner et al. (1995) Wilner, D. J., Zhao, J.-H., & Ho, P. T. P. 1995, ApJ, 453, L91