The Orbit and Distance of WR 140
Abstract: A campaign of 35 epochs of milli-arcsecond resolution VLBA observations of the archetype colliding-wind WR+O star binary system WR 140 show the wind-collision region (WCR) as a bow-shaped arc of emission that rotates as the highly eccentric orbit progresses. The observations comprise 21 epochs from the 1993-2001 orbit, discussed by Dougherty et al. (2005), and 14 epochs from the 2001-2009 orbit, and span orbital phase 0.43 to 0.95. Assuming the WCR is symmetric about the line-of-centres of the two stars and “points” at the WR star, this rotation shows the O star moving from SE to E of the WR star between these orbital phases. Using IR interferometry observations from IOTA that resolve both stellar components at phase 0.297 in conjunction with orbital parameters derived from radial velocity variations, the VLBA observations constrain the inclination of the orbit plane as , the longitude of the ascending node as , and the orbit semi-major axis as mas. This leads to a distance estimate to WR 140 of kpc. Further refinements of the orbit and distance await more IR interferometric observations of the stellar components directly.
1 Introduction
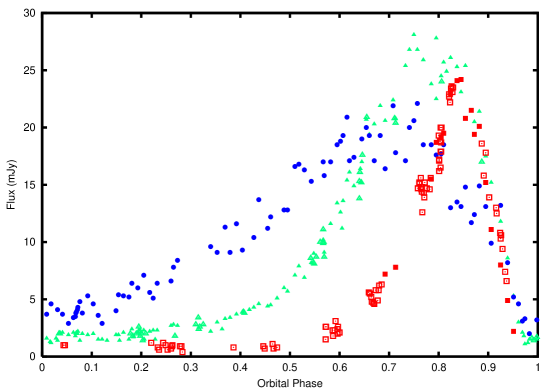
The 7.9-year period WR+O system WR 140 (HD 193793) is the archetype of CWB systems. It is comprised of a WC7 star and an O4-5 star in a highly elliptical orbit (), where the stellar separation varies between AU at periastron to AU at apastron. This highly eccentric orbit clearly modulates the dramatic variations observed in the emission from the system, from X-ray energies to radio wavelengths (Williams et al. 1990). Perhaps the most dramatic variations are observed at radio wavelengths, where there is a slow rise from a low state close to periastron of a few mJy, to a frequency-dependent peak in emission of 10’s of mJy between orbital phase 0.65 to 0.85, before a precipitous decline immediately prior to periastron (see Fig 1). A number of attempts to model these variations have been made (e.g. Williams et al. 1990, White & Becker, 1995) with limited success, though advances in our understanding of WCRs are being made (e.g. Pittard & Dougherty (2006); Pittard, these proceedings). Accurate orbital parameters are critical inputs to these models.
Many of the orbital parameters in WR 140, in particular the orbital period (), epoch of periastron passage (), eccentricity (), and the argument of periastron () have been established by others (see Marchenko et al. 2003 and references therein), and refined most recently in an extensive observing campaign during the 2009 periastron passage. However, the orbital inclination (), semi-major axis (), and the longitude of the ascending node () require the system to be resolved into a “visual” binary. The two stellar components in WR 140 have been resolved using the Infra-red Optical Telescope Array (IOTA) interferometer at a single epoch (Monnier et al. 2004). This single observation sets the scale and orientation of the orbit since it constrains potential families of solutions for . Further epochs of IOTA observations have been completed, but until analysis is complete, the VLBA observations of the WCR offer the only means to determine the orbit direction and constrain , and hence and .
An initial analysis of 21 epochs of VLBA observations taken between 1999 and 2000 (orbital phase 0.74 to 0.95) was described in Dougherty et al. (2005). The work presented in this paper is an amalgamation of those observations with an additional 14 observations obtained between 2004 to 2008, that extended the orbital phase coverage from 0.43 to 0.96. A re-analysis of the earlier observations with the new data leads to tighter constraints on the derived orbit parameters.
2 VLBA observations of WR 140
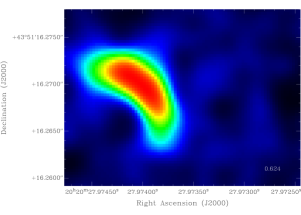
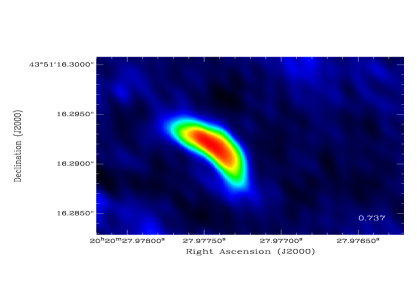
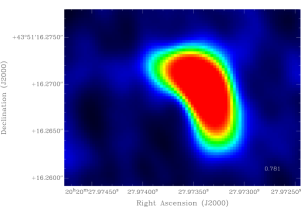
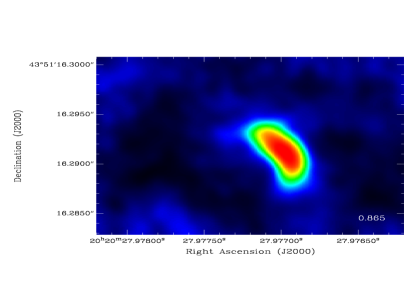
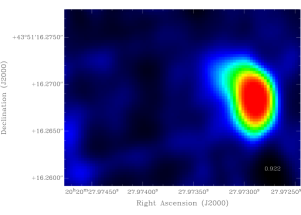
WR 140 was observed with the VLBA at 8.4 GHz at 35 epochs between orbital phase 0.43 and 0.97. A selection of images are shown in Fig. 2. The 8.4-GHz emission is clearly resolved, with a bow-shaped emission region observed at many epochs. This shape is anticipated for a WCR from model calculations (e.g. see Eichler & Usov 1993, Dougherty et al. 2003, Pittard et al. 2006). The WCR rotates from “pointing” NNW to W over the observed orbital phases. This rotation is key to determining the orbit of WR 140. Assuming the arc of emission is symmetric about the line-of-centres and points towards the WR star, the O star is to the SSE of the WCR at epoch 0.43, and approximately to the E at phase 0.96.

Deriving the Orbit
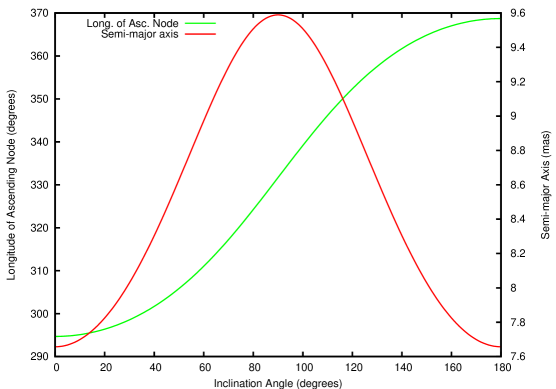
On June 17, 2003 Monnier et al. (2004) observed WR 140 to have a separation of mas at a position angle of degrees east of north. Using days, , and determined from analysis of observations during the 2009 periastron (Fahed et al. 2010), the observation at orbital phase 0.296 restricts potential sets of solutions for and to those shown in Fig. 3 for inclinations in the range .
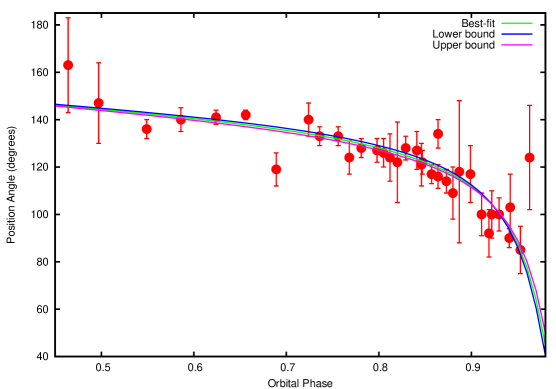
The change in the orientation of the WCR with orbital phase gives the inclination since each () solution family provides a unique set of position angles as a function of orbital phase. A weighted minimum measure between the observed position angle of the line of symmetry of the WCR, and by proxy the line-of-centres of the stars, as a function of orbit phase determined for different sets of () leads to a best-fit solution of and (Fig. 4). These values lead to a semi-major axis of mas.
Distance of WR 140
Stellar distance is one of the more difficult parameters to determine for stars. Marchenko et al. (2003) determined AU from radial velocity observations. From our estimate of , this gives AU. A semi-major of mas then gives a distance estimate of kpc, consistent with the previous estimate of kpc by Dougherty et al. (2005).
Summary
High-resolution radio observations of the WCR in WR140 have provided, to date, the only way to determine the direction and orientation of the orbit, starting from the scale of the orbit as deduced from IR interferometry and orbital parameters from optical spectroscopy. From this work it is possible to determine a precise, and hopefully accurate, distance to WR140.
WR140 is the best colliding-wind binary system for attempts to understand the underlying particle acceleration processes and physics in wind-collision regions, in large part due to the wealth of observational constraints. However, the orbit and distance are critical to modelling the WCR, and further refinements of these parameters await further IR interferometric observations that will resolve the stellar components directly.
Acknowledgments
We are grateful to Peredur for many useful discussions related to this work. The work has been supported by the National Research Council of Canada, and the University of Prince Edward Island Co-op programme. The observations presented here were obtained from the Very Long Baseline Array, operated by the National Radio Astronomy Observatory (NRAO).
References
Dougherty, S. M., Beasley, A. J., Claussen, M.J., Zauderer, B.A., Bolingbroke, N. J. 2005, ApJ, 623, 447
Dougherty, S. M., Pittard, J. M., Kasian, L., Coker, R. F., Williams, P. M., & Lloyd, H. M. 2003, A&A, 409, 217.
Eichler, D., & Usov, V. 1993, ApJ, 402, 271.
Fahed, R., et al. 2010, these proceedings.
Marchenko, S. V., et al. 2003, ApJ, 596, 1295.
Monnier, J. D., et al. 2004, ApJ, 602, L57.
Pittard, J. M., Dougherty, S. M., Coker, R. F., O’Connor, E. & Bolingbroke, N. J. 2006, A&A, 446, 1001.
Pittard, J. M. & Dougherty, S. M. 2006, MNRAS, 372, 801.
White, R. L., & Becker, R. H. 1995, ApJ, 451, 352.
Williams, P. M., van der Hucht, K. A., Pollock, A. M. T., Florkowski, D. R., van der Woerd, H., & Wamsteker, W. M. 1990, MNRAS, 243, 662.