Bayesian inference and model choice in a hidden stochastic two-compartment model of hematopoietic stem cell fate decisions
Abstract
Despite rapid advances in experimental cell biology, the in vivo behavior of hematopoietic stem cells (HSC) cannot be directly observed and measured. Previously we modeled feline hematopoiesis using a two-compartment hidden Markov process that had birth and emigration events in the first compartment. Here we perform Bayesian statistical inference on models which contain two additional events in the first compartment in order to determine if HSC fate decisions are linked to cell division or occur independently. Pareto Optimal Model Assessment approach is used to cross check the estimates from Bayesian inference. Our results show that HSC must divide symmetrically (i.e., produce two HSC daughter cells) in order to maintain hematopoiesis. We then demonstrate that the augmented model that adds asymmetric division events provides a better fit to the competitive transplantation data, and we thus provide evidence that HSC fate determination in vivo occurs both in association with cell division and at a separate point in time. Last we show that assuming each cat has a unique set of parameters leads to either a significant decrease or a nonsignificant increase in model fit, suggesting that the kinetic parameters for HSC are not unique attributes of individual animals, but shared within a species.
doi:
10.1214/09-AOAS269keywords:
., and T1Supported by the National Institutes of Health Grants R01-HL46598 and R01-HL082933.
1 The biology of hematopoiesis
Hematopoiesis is the process of blood cell production. More precisely, it is the process in which hematopoietic stem cells (HSCs) make fate decisions and through sequential divisions, differentiate into progenitor cells. These cells in turn differentiate into white blood cells, red blood cells or platelets. While a lot is known about how progenitor cells differentiate, since their behavior has been studied both in vivo and in vitro, relatively little is known about HSC. This is due to the fact that HSCs are difficult to isolate, as they do not have a completely unique physical or antigenic phenotype. In addition, in vivo, HSC decisions depend on input from neighboring cells and cytokines and not just their intrinsic cell programming. HSCs support the entire blood and immune system, and can reconstitute hematopoiesis after transplantation. Understanding their kinetics is of great importance. For example, this could lead to new treatments for leukemia and more effective clinical HSC transplantation procedures.
An HSC basically has to fulfill two directives, to self-renew and to differentiate. In addition, like all cells, an HSC eventually will die through apoptosis. An HSC self-renews by dividing symmetrically into two identical daughter cells, each of which becomes a new HSC. Since the normal function of an HSC requires input from cells and cytokines in its bone marrow microenvironment, termed niche, a newly born HSC will die unless it finds a niche in time. Biological data argue that there is a limited number of niches available in an organism and this helps maintain the number of HSC in a steady state in a normal adult [Abkowitz et al. (2002), Czechowicz et al. (2007)]. The pool of progenitor cells is replenished by the differentiation of HSC, which can happen in two ways conceptually. First, an HSC can be cued to commit to a specific progenitor fate. Alternatively, an HSC can divide into two cells, which are fated to become an HSC or a progenitor cell respectively at or right after the time of division. We call this “asymmetric division,” although from a mathematical perspective, one cannot distinguish a fate decision programmed at mitosis from a fate decision resulting from microenvironmental input at or immediately following cell division.
In Drosophila germ line cells, it is clear that the cell division event is indeed asymmetric, that is, fate depends on the spindle orientation relative to the Hub cell (niche) and results from the unequal distribution of intracellular regulators and extracellular (Hub-derived) signals between daughter cells during mitosis [reviewed in Knoblich (2008) and Yamashita and Fuller (2008)]. In the mammalian system, this is less certain, although studies of murine neuroprogenitors, muscle satellite cells and T cells (following contact with an antigen presenting cell) suggest this occurs [Knoblich (2008) and Chang et al. (2007)]. The elegant studies of Wu and colleagues [Wu et al. (2007)] show that murine HSC/progenitor cells, defined as immature by virtue of Notch transcription, divide asymmetrically in vitro. There is no in vivo evidence to suggest that asymmetric divisions happen, however, and importantly, observing asymmetric outcomes does not require that HSC division and fate determination are mechanistically linked [see discussion in Schroeder (2007)].
In order to get an idea of the contributions of the feline hematopoietic stem cells to the progenitor cells, a specific set of experiments was designed using female Safari cats. Safari cats are the offspring of matings between a domestic cat and the South American Geoffroy wild cat. Since these two breeds of cat have had long separate developments, they express an electrophoretically distinct phenotype of the X-chromosome-linked enzyme glucose-6-phosphate dehydrogenase (G6PD). During embryogenesis, since either the paternal or the maternal X-chromosome is inactivated, the female Safari cats have some somatic cells expressing the domestic-type G6PD (d G6PD) and other expressing the Geoffroy-type G6PD (G G6PD). The G6PD phenotype is retained after replication and differentiation, and it is functionally neutral. That is, the cells that express it do not have significant self-renewal or differentiation advantages. Therefore, it provides a binary marker or label of each cell and its offspring. For more details on the experiment, see Abkowitz et al. (1988, 1990, 1993).
Observing the percentage of progenitor cells expressing the d G6PD phenotype over a period of almost 6 years in normal female Safari cats (with observations taken approximately every 4 weeks) did not seem to provide much information about the HSC behavior. In fact, this percentage remained relatively constant during the six years of observation, suggesting that hematopoiesis is a polyclonal and stable process.
Since there might be more information in observing the hematopoiesis process when it is supported by a much smaller number of stem cells, a number of female Safari cats were irradiated in order to kill their bone marrow (where HSCs reside in adults) and a small number of bone marrow cells, collected prior to the radiation, were transplanted back. Since large animals have relatively few HSCs compared to other cells in the marrow, at the start of the experiment the transplanted cats are likely to contain a very small number of HSCs. For this reason the process modeling the HSC behavior should have a discrete state-space rather than a continuous one. The behavior of the binary label (d G6PD versus G G6PD) within the progenitor cells was then monitored in samples taken every two to six weeks. Under this setting, the percentage of labeled cells is more variable over time. For example, some cats showed wide clonal fluctuations during the first year or so and then stabilized, suggesting that initial hematopoiesis after the transplantation was supported by only one or two clones.
2 A stochastic model of hematopoiesis
We model the hematopoiesis as a two-compartment model. The first compartment contains the HSC, while the second contains the clones (i.e., the entire production) of committed stem cells. In the first compartment we allow stochastic decisions to divide, specialize or die, with fates depending on the type of event. Thus, an HSC follows a birth (symmetric division with rate ; when the maximum number of niches is reached, one daughter cell dies immediately), death (apoptosis at rate ) and emigration (through commitment with rate or through asymmetric division with rate ). The second compartment gets input from committed stem cells, and the duration of productive life of a clone is modeled exponentially (clonal death with rate ). Figure 1 is a schematic description of the stochastic model. Table 1 lists all the stochastic events.

| Name | Short name | Rate parameter |
|---|---|---|
| Symmetric division | S | |
| Commitment | C | |
| Clonal death | D | |
| Asymmetric division | As | |
| Apoptosis | Ap |
In this paper we will be studying several submodels of the one shown in Figure 1 and a convention is adopted to name each model by concatenating the short names of the stochastic events it contains. For example, a model containing the symmetric division event, the commitment event and the clonal death event is called a SCD model; add the asymmetric event and the apoptosis event and we get the full model SCDAsAp.
It follows from the description of the experiment above that the total number of cells both in compartments one and two in Figure 1 can be seen as the sum of two independent and identically distributed population processes that differ only in a label: d G6PD or G G6PD. In short, the population process is two-dimensional in both compartments. One dimension is the population of cells expressing the d phenotype, the other is the population of cells expressing the G phenotype.
Denote the rate parameters collectively as . Denote by the set of events between time 0 and time or, equivalently, the number of cells over time in that time span. We call the path or state. Suppose is composed of events, which divide the time span into intervals denoted by . The probability density of given the rate parameters is
where and are the numbers of cells/clones (either domestic or Geoffroy) in the first and second compartments, respectively, at the time of the th event ( and are the numbers at time 0), , , , or depending on whether the th event is a symmetric division, a commitment, an apoptosis, an asymmetric division event in the first compartment or a death event in the second compartment. Note that and are not observed. We choose and to be 10 and 5, respectively (either domestic or Geoffroy) via a combination of prior belief and sensitivity study [Golinelli, Guttorp and Abkowitz (2006)].
In order to relate this model of the unobserved HSCs and their progenitors to the actual observations, we assume that each clone contributes equally to hematopoiesis, and sample certain types of cells (BFU-E plus CFU-GM). By the assumption made, the number of d-labeled cells in the samples should be binomially distributed with success probability reflecting the proportion of d HSC in the second compartment. Specifically, denoting the time of the th observation, the number of progenitor cells in the sample at time , and the numbers of d-type and G-type clones in the second compartment at time , the distribution of the number of d-type cells is
3 Some history
From a statistical point of view, parameter estimation needs to involve the likelihood function. In the first set of papers in the long-standing collaboration between Guttorp and Abkowitz [Abkowitz et al. (1990), Guttorp, Newton and Abkowitz (1990)] we were able to perform a complete likelihood analysis, with a nonstandard shape of the likelihood due to the initial number of transplanted HSC being a parameter. There were serious numerical difficulties in evaluating the likelihood, and a Markov chain Monte Carlo approach to inference with varying state space was developed to do a Bayesian analysis of the early cat transplant data [Newton, Guttorp and Abkowitz (1992)].
When additional cat data proved this early model a poor fit, we developed the first version of the current model, which initially was analyzed using simulation tools. Using some features of the observed data, we developed objective criteria to assess simulated paths. When a set of simulated paths failed one or more of the criteria, those parameter values were deemed infeasible. In essence, we were using the multiple decision tools of Pareto Optimization [Vincent and Grantham (1981)] and the Pareto Optimal Model Assessment approach by Reynolds and Ford (1999) to determine possible parameter values, with an ad hoc approach to find “optimal” parameter values.
A statistical approach, using estimating equations, was developed by Catlin in her dissertation [Catlin (1997)] and applied to the cat data [Catlin, Abkowitz and Guttorp (2001)], yielding parameter estimates with a tighter range than those obtained from the Pareto optimization. Golinelli (2000) studied a simplified version of the model and developed tools for calculating the posterior distribution using Markov chain Monte Carlo methods. It was computationally infeasible at the time to run sufficient numbers of MCMC iterations for the convergence of the algorithm. With improved computing facilities and a faster algorithm, Golinelli, Guttorp and Abkowitz (2006) then calculated the posterior distributions for one of the first transplanted cats, as well as that using all the cats. These distributions agree with and thus confirm our previous simulation-based work, and are more precise than the alternative method developed by Catlin, Abkowitz and Guttorp (2001).
In this paper we extend the Bayesian inference machinery developed in Golinelli, Guttorp and Abkowitz (2006) for the SCD model to work with other models. Basically we draw from the posterior distribution by using a Gibbs sampler that alternates between updates of (parameter update) and (state update). The parameter update is rather easy with the choice of gamma or uniform prior because we can write down the conditional distribution of analytically. The state update is achieved by a Reversible Jump Metropolis–Hastings algorithm [Robert and Casella (2004)]. Details are given in the Appendix.
The increased complexity in both the parameter space and the state space requires that we run more MCMC iterations than before and the time to run it is getting close to being prohibitive. In order to improve the performance, we allow the state update for each cat to run in its own thread, thus speeding up state updates, the more time-consuming part of the algorithm. The program was run on a custom-built high-performance workstation. This allows us to run more complicated models, as well as simultaneously analyze all the data from the transplanted cats. In particular, we are able to fit various refined models (Sections 4 and 5) and assess the hypothesis that all cats have the same parameter values (Section 6). We still use the Pareto Optimal Model Assessment approach to rule out certain models (Section 4).
4 Essentialness of apoptosis, symmetric division and commitment events
Based on scientific evidence we know that apoptosis does happen to all somatic cells. Golinelli, Guttorp and Abkowitz (2006) chose to leave out this event because simulation studies done in Abkowitz, Catlin and Guttorp (1996) indicated that apoptosis was not essential in reconstructing our experimental observations and because of the computational challenge in implementing it. With the recent progress in software and hardware, we attempt reversible jump MCMC for the SCDAp model. The posterior means for are 0.084, 0.00019, 0.038, 0.0024, separately. To find out whether the SCDAp model provides a better fit to the data than the SCD model, we estimate Bayes factors. To this end, we estimate the integrated likelihood under each model with a stabilized harmonic mean estimator [Raftery et al. (2007)]
where is any subset of parameters in model , is one draw from the posterior distribution of , is the density of the data under model with all parameters other than integrated out, and is the number of draws used to calculate the harmonic mean. Depending on the choice of , the estimator can have large or small variance. In our model, if we choose to be the path, then the estimator has very large variance (data not shown). But if we let be either , or , then , and all have much smaller variance and are similar to each other (Table 2). The Bayes factor for comparing the SCDAp model and the SCD model, , indicates that the SCD model is strongly preferred over the SCDAp model for describing this data set. Since SCD is a submodel of SCDAp, this result means that without the presence of the apoptosis event, the SCD model does a good job of describing the data set. Adding the apoptosis event results in a more complex model, which is penalized by the Bayes factor approach. This result is consistent with Abkowitz, Catlin and Guttorp (1996) which shows by the Pareto Optimal Model Assessment approach that the data contain little information about the apoptosis rate.
| Models | BF | ||||
|---|---|---|---|---|---|
| SCD | 682.15 | 647.27 | 649.24 | 646.35 | 1.0 |
| SCDAp | 692.04 | 659.28 | 662.61 | 660.09 | 0.00 |
| CDAsAp | 673.11 | 645.84 | 649.01 | 647.41 | 1.2 |
| SDAsAp | 689.72 | 668.17 | 672.57 | 676.71 | 0.00 |
| SCDAs | 670.34 | 644.59 | 644.30 | 645.16 | 19 |
Since asymmetric division can be viewed as combining symmetric division and commitment in one step, questions arise as to whether it is possible to leave out either symmetric division or commitment in the presence of asymmetric division. To check the essentialness of symmetric division, we performed a Bayesian analysis of the CDAsAp model using a Gamma prior. The Bayes factor comparing the CDAsAp model with the SCD model is (Table 2). This Bayes factor is nonconclusive. We simulate 50 virtual cats from the CDAsAp model using the means of the posterior distributions of the rate parameters (, , , ). We then assess each virtual cat with the five assessment criteria developed in Abkowitz, Catlin and Guttorp (1996). The distributions of each of the first four criteria in the observed and in the virtual cats are compared using Kolmogorov–Smirnov tests and values are 0.00, 0.000, 0.000 and 0.000. The die-out rate of the virtual cats is 100%. We also simulate virtual cats from six randomly chosen sets of parameters from the posterior distributions. While the first four tests produce variable values, the die-out rates are all higher than 96%. This strongly suggests that symmetric division is required to explain the data, that is, the hematopoietic reserve (compartment 1) cannot regenerate and cannot maintain continued hematopoiesis unless HSC symmetrically divide.
Similarly, we did a Bayesian analysis of the SDAsAp model using a Gamma prior. The Bayes factor comparing the SDAsAp model with the SCD model is (Table 2), suggesting that commitment is required to explain the data. We simulate 50 virtual cats from the SDAsAp model using the means of the posterior distributions of the rate parameters (, , , ). Comparison of the first four criteria between the virtual cats and the observed cats results in the values of 0.073, 0.005, 0.000 and 0.75. The die-out rate of the virtual cats is 0%. We also simulate virtual cats from six randomly chosen sets of parameters from the posterior distributions. The values from testing the third criterion, the relative amount of variation in the d-type progenitor percentage immediately following transplantation [Abkowitz, Catlin and Guttorp (1996)], are all 0.000. This further supports the notion that commitment is essential to HSC kinetics. The maintenance of hematopoiesis by a persisting cohort of progenitor cells is not compatible with experimental observations.
5 Bayesian inference for SCDAs model
Table 3 reports the means and 95% HPD credible intervals of the posterior distributions of the parameters for the SCDAs model. Those for the SCD model are reported as well for comparison purpose. For the SCDAs model, the best estimates for , , and are 1 per 11 weeks, 1 per 13 weeks, 1 per 5.2 weeks, and 1 per 13 weeks, respectively. The estimated symmetric division rates and commitment rates are largely similar between the two models, while the clonal death rate in the SCDAs model is a bit larger than that in the SCD model. This makes sense because in the SCDAs model, in addition to commitment events, asymmetric division events also contribute to the increase in the number of clones in the second compartment, thus requiring an increase in the death rate to maintain a steady state.
| Symm division | Commitment | Clonal death | Asym. division | |
|---|---|---|---|---|
| SCDAs | 0.093 (0.044, 0.141) | 0.079 (0.036, 0.125) | 0.193 (0.118, 0.271) | 0.078 (0.009, 0.159) |
| SCD | 0.094 (0.052, 0.148) | 0.079 (0.038, 0.137) | 0.139 (0.081, 0.209) |
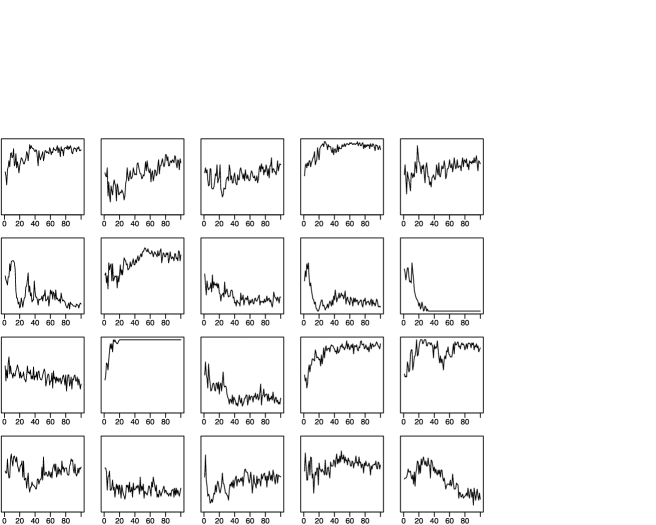
The Pareto Optimal Model Assessment approach was previously used in Abkowitz et al. (1988) to find the acceptable range of the parameters in the SCDAp model. The same approach can also be used to validate the parameter estimates obtained from Bayesian inference. Thus, we simulate 50 virtual cats using the means of the posterior distributions of parameters for the SCDAs model. Figure 2 plots 20 paths. Comparison of the first four criteria between the virtual cats and the observed cats results in the values of 0.074, 0.59, 0.34 and 0.41. The last criterion, the die-out rate, of the simulated cats is 14%. While no die-outs were observed among the six observed cats, this percentage is still less than 16.
In this Bayesian analysis, we have to specify priors for the parameters. Although there is some information guiding the choice of priors, we want to check the sensitivity of the posterior distributions on prior choice. To that end, we run MCMC with two priors. Both priors assume that all parameters are independently and identically distributed. The “Gamma” priors let each parameter be distributed as a Gamma distribution with shape parameter 5 and rate parameter 50. The “Uniform” prior lets each parameter be distributed as a uniform distribution between 0 and 0.5. While the SCD model is fairly insensitive to the choice of priors [Golinelli, Guttorp and Abkowitz (2006)], the SCDAs model is quite sensitive, particularly for clonal death rate and asymmetric division rate (Figure 3). For these two rates, uniform priors lead to larger posterior means. Furthermore, there appears to be little detailed information about asymmetric division rate.

Both SCDAs and SCD are biologically reasonable models of hematopoiesis. Do the data at hand provide any evidence of favoring one versus the other? The Bayes factor comparing the SDAsAp model with the SCD model is (Table 2), providing moderate evidence that describes the data better than . Other than the Bayes factor approach, we could potentially address this problem by a mixture model approach, treating the model indicator as a random variable and putting a Bernoulli(0.5) prior on it. We try to construct a reversible jump MCMC to sample the posterior joint distribution of , parameters and path. Unfortunately, due to the large dimensionality of the path space, it seems very difficult to come up with a proposal distribution for an RJMCMC algorithm that works.
6 Homogeneity of the cats
As we mentioned before, Golinelli, Guttorp and Abkowitz (2006) showed that the posterior distributions of the rate parameters were fairly insensitive to the choice of priors when all six cats were analyzed together. Golinelli, Guttorp and Abkowitz (2006) also showed that when individual cats were analyzed separately, the posterior distributions were quite sensitive to the choice of priors. This prompts us to test the modeling assumption that the rate parameters are the same for all cats. In order to test this assumption, we fit each cat separately with the SCDAs model and the SCD model (Figure 4 left and right) using the Gamma prior and compare the 95% posterior credible intervals of the rate parameters. It appears that both and are quite similar across cats for both the SCDAs model and the SCD model. In both models, shows a bigger variation, but still all the credible intervals for individual cats overlap with the credible interval for all cats together. of the SCDAs model are also quite similar across cats.

Fitting each cat separately is equivalent to fitting a model in which each cat is allowed to have its own set of parameters (the heterogeneous model). Viewed this way, we can use the Bayes factor approach to compare pairs of models where each pair differs in how each cat’s parameters are treated. The Bayes factor comparing the SCD model in which each cat is allowed to have its own set of parameters and the SCD model in which all cats have the same set of parameters is . For the SCDAs model, this comparison yields a Bayes factor of . This tells us that in the smaller SCD model, the heterogeneous model provides a better fit to the data, while in the bigger model SCDAs, the heterogeneous model results in a worse fit.
7 Discussion
In this paper we use a number of statistical inference methods to answer some important questions related to hematopoiesis. It is necessary for us to model hematopoiesis as a continuous time Markov process because samples are collected from unevenly-spaced time intervals. As a result, the sample space that our Gibbs sampler has to explore is very large. We check the convergence by visual inspection of the trace plots and by cusum plots [Yu (1995)].
Previously Golinelli, Guttorp and Abkowitz (2006) have shown that in the SCD model the amount of information the data contain are different from different rate parameters. More information is available for the symmetric division rate and the commitment rate than for the clonal death rate. We show here that in the SCDAs model, the same is true. Furthermore, the amount of information for the asymmetric division rate is similar to that for the clonal death rate. In other words, these two parameters are not estimated very precisely.
The data we analyze in this paper are observations made up to 100 weeks post-transplantation. Data from 100 weeks to 300 weeks post-transplantation are also available. We choose to limit the analysis to 100 weeks data out of consideration of the underlying physiological process. In the initial period after transplantation, the number of HSC cells grow exponentially until reaching the number of niches available. After that, following a symmetric division event, one of the daughter cells may not have a niche available to it and end up dying [Schofield (1978)] or specializing (differentiating). We call this the steady state. In the steady state, the number of HSC cells is bounded by the number of niches available and the amount of information for the rate parameters is limited. Since this mechanism operates even in the SCD model, there is in effect a modest amount of asymmetric division even in this case.
The model has been applied to other animals [Abkowitz et al. (2000), Shepherd et al. (2007)] with results that indicate that the kinetics ofhematopoiesis varies substantially between animals. There are some surprising invariants between species, such as an indication that the maximum number of stem cells is similar for all animals, that the ratio of to remains constant [Abkowitz et al. (2002)], and that there is no evidence that the clone exhaustion parameter differs between species, although our results indicate substantial uncertainty about this latter parameter. These findings have been used to deduce parameter values for humans [Shepherd et al. (2004), Catlin et al. (2009)].
There is independent evidence that the parameter values obtained in our analyses are reasonable. Specifically, observations of telomere shortening in granulocytes from cats with aging can be used to estimate the cumulative numbers of HSC divisions at a point in time [Shepherd et al. (2007)]. While the estimates in this paper are based on a stochastic model using only symmetric division, similar calculations indicate that even though the fitted values for the SCDAs model will be about 185 divisions per lifetime, it is quite consistent with the other animal models in the cited paper.
Recently there has been progress in studies of in vitro asymmetric fate determination. Wu et al. (2007) for the first time demonstrated that hematopoietic stem/progenitor cells undergo both symmetric and asymmetric divisions. The study we have done in this paper is consistent with the occurrence of asymmetric division in vivo and further provides an estimate of the rate at which it happens.
Appendix
The state update is carried out using a Metropolis–Hastings–Green algorithm which is a slight generalization and optimization of that reported in Golinelli, Guttorp and Abkowitz (2006). In this appendix we only lay out what is different and ask the readers to refer to Golinelli, Guttorp and Abkowitz (2006) for more details. Denote by the types of events in the model we are interested in, by the number of events in the current path, and by the time span during which data are collected. Let be a point from the probability simplex. The proposal probabilities for the three moves defined in Golinelli, Guttorp and Abkowitz (2006) are as follows:
-
1.
Deletion move: ;
-
2.
Insertion move: ;
-
3.
Shuffle move: .
In calculating the acceptance probability
the Jacobian is 1 for all models investigated in this paper since the diffeomorphisms are all identity relations. For speed and ease of computation, we factor the log prior ratio into three parts:
-
•
The first part is , where denotes the number of cells in the first compartment right before the th event and denotes the number of clones in the second compartment right before the th event. if and only if the th event is not a Death event.
-
•
The second part is , where , , , and are the numbers of symmetric division, commitment, clonal death, asymmetric division and apoptosis events, separately. When a model lacks a certain event, simply drop the corresponding term. After simplification, this part is just , where , or for insertion, deletion and shuffle moves, respectively, and is the rate parameter corresponding to the event being considered in the proposal.
-
•
The third part is , where and are the total time lived by the population in the first and second compartment, respectively. Again, when a model lacks a certain event, simply drop the corresponding term.
The likelihood ratio is calculated similarly for all models. The proposal ratio is for the insertion move, for the deletion move, and 0 for the shuffle move.
Acknowledgments
The authors thank the Editor, Associate Editor and referees for helpful comments.
References
- Abkowitz, Catlin and Guttorp (1996) Abkowitz, J., Catlin, S. and Guttorp, P. (1996). Evidence that hematopoiesis may be a stochastic process in vivo. Nature Medicine 2 190–197.
- Abkowitz et al. (2002) Abkowitz, J., Catlin, S., McCallie, M. and Guttorp, P. (2002). Evidence that the number of hematopoietic stem cells per animal is conserved in mammals. Blood 100 2665–2667.
- Abkowitz et al. (2000) Abkowitz, J., Golinelli, D., Harrison, D. and Guttorp, P. (2000). In vivo kinetics of murine hemopoietic stem cells. Blood 96 3399–3405.
- Abkowitz et al. (1990) Abkowitz, J., Linenberger, M., Newton, M., Shelton, G., Ott, R. and Guttorp, P. (1990). Evidence for the maintenance of hematopoiesis in a large animal by the sequential activation of stem-cell clones. Proc. Natl. Acad. Sci. USA 87 9062–9066.
- Abkowitz et al. (1993) Abkowitz, J., Linenberger, M., Persik, M., Newton, M. and Guttorp, P. (1993). Behavior of feline hematopoietic stem cells years after busulfan exposure. Blood 82 2096–2103.
- Abkowitz et al. (1988) Abkowitz, J., Ott, R., Holly, R. and Adamson, J. (1988). Clonal evolution following chemotherapy-induced stem cell depletion in cats heterozygous for glucose-6-phosphate dehydrogenase. Blood 71 1687–1692.
- Catlin (1997) Catlin, S. (1997). Statistical inference for partially observed Markov population processes. Ph.D. dissertation, Univ. Washington.
- Catlin, Abkowitz and Guttorp (2001) Catlin, S., Abkowitz, J. and Guttorp, P. (2001). Statistical inference in a two-compartment model for hematopoiesis. Biometrics 57 546–553. \MR1855690
- Catlin et al. (2009) Catlin, S., Busque, L., Gale, R., Guttorp, P. and Abkowitz, J. (2009). Estimating the replication rate of human hematopoietic stem cells in vivo. Submitted.
- Chang et al. (2007) Chang, J., Palanivel, V., Kinjyo, I., Schambach, F., Intlekofer, A., Banerjee, A., Longworth, S., Vinup, K., Mrass, P., Oliaro, J., Killeen, N., Orange, J., Russell, S., Weninger, W. and Reiner, S. (2007). Asymmetric lymphocyte division in the initiation of adaptive immune responses. Science 315 1687–1691.
- Czechowicz et al. (2007) Czechowicz, A., Kraft, D., Weissman, I. and Bhattacharya, D. (2007). Efficient transplantation via antibody-based clearance of hematopoietic stem cell niches. Science 318 1296–1299.
- Golinelli (2000) Golinelli, D. (2000). Bayesian inference in hidden stochastic population processes. Ph.D. dissertation, Univ. Washington.
- Golinelli, Guttorp and Abkowitz (2006) Golinelli, D., Guttorp, P. and Abkowitz, J. (2006). Bayesian inference in a hidden stochastic two-compartment model for feline hematopoiesis. Mathematical Medicine and Biology 23 153–172.
- Guttorp, Newton and Abkowitz (1990) Guttorp, P., Newton, M. and Abkowitz, J. (1990). A stochastic model for haematopoiesis in cats. Mathematical Medicine and Biology 7 125–143.
- Knoblich (2008) Knoblich, J. (2008). Mechanisms of asymmetric stem cell division. Cell 132 583–597.
- Newton, Guttorp and Abkowitz (1992) Newton, M., Guttorp, P. and Abkowitz, J. (1992). Bayesian inference by simulation in a stochastic model from hematology. In Proceedings of the 24th Symposium on the Interface: Computing Science and Statistics 449–455. Interface Foundation of North America, Fairfax Station, VA.
- Raftery et al. (2007) Raftery, A., Newton, M., Satagopan, J. and Krivitsky, P. (2007). Estimating the integrated likelihood via posterior simulation using the harmonic mean identity. Bayesian Statistics 8 (J. M. Bernardo, M. J. Bayarri and J. O. Berger, eds.) 371–416. Oxford Univ. Press, Oxford. \MR2433201
- Reynolds and Ford (1999) Reynolds, J. and Ford, E. (1999). Multi-criteria assessment of ecological process models. Ecology 80 538–553.
- Robert and Casella (2004) Robert, C. and Casella, G. (2004). Monte Carlo Statistical Methods. Springer, New York. \MR2080278
- Schofield (1978) Schofield, R. (1978). The relationship between the spleen colony-forming cell and the haemopoietic stem cell. Blood Cells 4 7–25.
- Schroeder (2007) Schroeder, T. (2007). Asymmetric cell division in normal and malignant hematopoietic precursor cells. Cell Stem Cell 1 479–481.
- Shepherd et al. (2004) Shepherd, B., Guttorp, P., Lansdorp, P. and Abkowitz, J. (2004). Estimating human hematopoietic stem cell kinetics using granulocyte telomere lengths. Exp. Hematol. 32 1040–1050.
- Shepherd et al. (2007) Shepherd, B., Kiem, H., Lansdorp, P., Dunbar, C., Aubert, G., LaRochelle, A., Seggewiss, R., Guttorp, P. and Abkowitz, J. (2007). Hematopoietic stem-cell behavior in nonhuman primates. Blood 110 1806–1813.
- Vincent and Grantham (1981) Vincent, T. and Grantham, W. (1981). Optimality in parametric systems. Wiley, New York. \MR0628316
- Wu et al. (2007) Wu, M., Kwon, H., Rattis, F., Blum, J., Zhao, C., Ashkenazi, R., Jackson, T., Gaiano, N., Oliver, T. and Reya, T. (2007). Imaging hematopoietic precursor division in real time. Cell Stem Cell 1 541–554.
- Yamashita and Fuller (2008) Yamashita, Y. and Fuller, M. (2008). Asymmetric centrosome behavior and the mechanisms of stem cell division. J. Cell Biol. 180 261–266.
- Yu (1995) Yu, B. (1995). Comment: Extracting more diagnostic information from a single run using the cusum path plot. Statist. Sci. 10 54–58.