Interpreting the Evolution of the Size – Luminosity Relation for Disk Galaxies from Redshift 1 to the Present
Abstract
A sample of very high resolution cosmological disk galaxy simulations is used to investigate the evolution of galaxy disk sizes back to redshift 1 within the CDM cosmology. Artificial images in the rest frame band are generated, allowing for a measurement of disk scale lengths using surface brightness profiles as observations would, and avoiding any assumption that light must follow mass as previous models have assumed. We demonstrate that these simulated disks are an excellent match to the observed magnitude – size relation for both local disks, and for disks at =1 in the magnitude/mass range of overlap. We disentangle the evolution seen in the population as a whole from the evolution of individual disk galaxies. In agreement with observations, our simulated disks undergo roughly 1.5 magnitudes/arcsec2 of surface brightness dimming since =1. We find evidence that evolution in the magnitude – size plane varies by mass, such that galaxies with M∗ 109 M☉ undergo more evolution in size than luminosity, while dwarf galaxies tend to evolve potentially more in luminosity. The disks grow in such a way as to stay on roughly the same stellar mass – size relation with time. Finally, due to an evolving stellar mass – SFR relation, a galaxy at a given stellar mass (or size) at =1 will reside in a more massive halo and have a higher SFR, and thus a higher luminosity, than a counterpart of the same stellar mass at =0.
Subject headings:
galaxies: evolution — galaxies: formation — methods: N-Body simulations1. Introduction
Recent observational surveys (e.g., COSMOS, GOODS, GEMS, SINGS, SDSS, Scoville et al., 2007; Giavalisco et al., 2004; Rix et al., 2004; Kennicutt et al., 2003; York et al., 2000) have allowed us for the first time to statistically explore issues of galaxy formation. One of the immediate challenges to disk formation theory that is presented by these observations comes in the form of evidence that there has been little change in the sizes of disk galaxies since =1, despite an expectation that disks should be growing in size over this time. Observations tell us that there exist large disks by =1 (before the universe was even half of its present age), and suggesting that these disks must be assembled prior to this epoch (e.g., Vogt et al., 1996; Roche et al., 1998; Lilly et al., 1998; Simard et al., 1999; Ravindranath et al., 2004; Ferguson et al., 2004; Trujillo & Aguerri, 2004; Barden et al., 2005; Sargent et al., 2007; Melbourne et al., 2007; Kanwar et al., 2008). Recent observations lend strong support to the existence of disks back to even higher redshifts (Labbé et al., 2003; Förster Schreiber et al., 2006; Shapiro et al., 2008; Stark et al., 2008; Wright et al., 2009; Jones et al., 2009), and for disk assembly at even higher redshifts in the form of clump-chain galaxies in the Hubble Ultra Deep Field (Elmegreen et al., 2005, 2007).
Results from large surveys suggest that there has been only weak evolution in disk sizes since =1. There is no evidence that the size function of disks has evolved back to =1 (Lilly et al., 1998; Ravindranath et al., 2004; Kanwar et al., 2008). Kanwar et al. (2008) found that the shape of the size function did not evolve with redshift, though the normalization (or amplitude) did. This can be interpreted in two ways. First, the normalization will vary if the number density of disks varies with time. However, observations suggest that the number density of disks is constant to =1 (Lilly et al., 1998; Sargent et al., 2007). Second, if it is assumed that galaxies dim with time (e.g., due to a passively evolving stellar population or decline in star formation rate), a 1 to 1.5 magnitude dimming since =1 could explain the change in normalization, while keeping the size distribution of disks constant (Kanwar et al., 2008). Hence, there is no immediate evidence for a change in the sizes of galaxy disks with time.
Studies of the evolution in the magnitude – size relationship for disk galaxies back to =1 have found similar results. Importantly, these studies must use surface brightness evolution to interpret evolution within the magnitude – size plane. This is not straightforward, as an increase in disk scale lengths at a fixed magnitude between =1 and =0 can be mimicked by a decrease in luminosity at a fixed size (Trujillo & Aguerri, 2004). Selection effects are difficult to disentangle, and studies that require high and low samples to adhere to the same selection biases have found that large disks are consistent with no evolution in surface brightness (Simard et al., 1999; Ravindranath et al., 2004). Later studies concluded that this work was too restrictive, and that a careful treatment of completeness as a function of redshift supports surface brightness dimming over time (Schade et al., 1996; Roche et al., 1998; Lilly et al., 1998; Bouwens & Silk, 2002; Ravindranath et al., 2004; Trujillo & Pohlen, 2005; Barden et al., 2005; Melbourne et al., 2007; Kanwar et al., 2008). Most studies conclude that pure size evolution at a fixed magnitude is ruled out (Melbourne et al., 2007). Instead, the observed surface brightness evolution is best explained by luminosity dimming, with the amount of dimming dependent on galaxy size so that lower mass galaxies have undergone more dimming since =1 than massive galaxies (Melbourne et al., 2007; Kanwar et al., 2008). However, some amount of size evolution can’t be ruled out, and at least weak size evolution is favored (Reshetnikov et al., 2003; Barden et al., 2005; Trujillo & Pohlen, 2005).
While magnitude is assumed to scale with the mass of a galaxy, it is obvious from the above discussion that magnitude at a given mass is not necessarily constant in time. The more fundamental relation is between size and stellar mass. Magnitude at a given stellar mass is likely to increase back to =1 due to the fact that there is an evolving star formation rate (SFR) – mass relation (Gavazzi & Scodeggio, 1996; Boselli et al., 2001; Kauffmann et al., 2003; Brinchmann et al., 2004; Feulner et al., 2005; Erb et al., 2006; Salim et al., 2007; Noeske et al., 2007b, a; Elbaz et al., 2007; Daddi et al., 2007; Schiminovich et al., 2007; Cowie & Barger, 2008; Pannella et al., 2009; Damen et al., 2009b, a; Dunne et al., 2009; Rodighiero et al., 2010; Oliver et al., 2010; Mannucci et al., 2010; Lara-López et al., 2010). Barden et al. (2005) examined the stellar mass – size relation for disk dominated galaxies back to =1, and found weak or no evolution. This result can be interpreted in two ways. First, given the change of 1 magnitude of surface brightness dimming in the same population, the result is consistent with a passively evolving stellar population at a given mass, with no growth of galaxy disks. Second, it could imply that galaxies are growing, but that they must grow in such a way as to evolve along the stellar mass – size relation with time.
On the other hand, galaxy disk formation theory predicts that the sizes of disks, both individual and as a population, should be growing since =1. In the standard picture, gas in a halo conserves its specific angular momentum (equal to that of the dark matter) as it cools to form a centrifugally supported disk that grows from the inside out (White & Rees, 1978; Fall & Efstathiou, 1980). In the simplest model, in which the density profile of galaxies is modeled as a singular isothermal sphere (SIS), the radius of the resulting disk is proportional to the parent halo virial radius, which grows inversely with the Hubble parameter, . For a concordance CDM cosmology (Komatsu et al., 2008, 2010), this relation predicts that disks at =1 should be nearly a factor of two smaller than their =0 counterparts at the same circular velocity, (Mo et al., 1998; Mao et al., 1998; van den Bosch, 1998).
Somerville et al. (2008) adopted more reasonable assumptions to update the simple theoretical model that suggests that galaxy disks should grow by nearly a factor of two since =1, primarily by adopting NFW density profiles rather than SIS profiles. Unlike the SIS model, the concentrations of NFW profiles were lower in the past. Combined with disk stability arguments (Efstathiou et al., 1982), this model predicts a much weaker evolution in disk sizes (15%-20%) at a fixed stellar mass, consistent with the Barden et al. (2005) results. These semi-analytic models (SAMs) do not follow the evolution of individual disk galaxies with time. Rather, they examine an instantaneous population of disks. Clearly, this is the type of information derived from observations, but it prevents an interpretation of the evolution in individual disk galaxies based on observations of the population as a whole. Firmani & Avila-Reese (2009) instead follow the evolution of individual disks in their SAM, and demonstrate that disks tend to grow along the stellar mass – size relation, with only weak evolution, consistent with the results of Barden et al. (2005).
The analytic models discussed above (e.g., Mo et al., 1998; Somerville et al., 2008; Firmani & Avila-Reese, 2009) have until recently been the only available theoretical tool with which to investigate the evolution of galactic disk sizes (though see Brook et al., 2006). Simulations, with their ability to capture complex gas processes in mergers and subsequent SF, should be an ideal tool that allow a better trace of the distribution of stellar light, while SAMs must assume that light follows mass. However, simulations of disk galaxy formation in a CDM context have historically produced unrealistic disks that are too compact (dense), too small overall, and rotating too fast at a given radius (e.g., Steinmetz & Navarro, 1999; Navarro & Steinmetz, 2000; Eke et al., 2001; Abadi et al., 2003; Governato et al., 2004). This failure has been named the “angular momentum catastrophe.” This catastrophe has been largely associated with the overcooling problem, in which baryons cool too quickly at early times and become very dense and concentrated at the center of halos before merging. These halos then experience dynamical friction in subsequent mergers, and the resulting disks show the classic signs of the angular momentum catastrophe (Navarro & Benz, 1991; Navarro & White, 1994; Katz et al., 1994; Maller & Dekel, 2002). Thus, feedback mechanisms at early times have historically been invoked to prevent overcooling with moderate success (Dekel & Silk, 1986; Sommer-Larsen et al., 1999; Thacker & Couchman, 2000, 2001; Sommer-Larsen et al., 2003; Robertson et al., 2004; Okamoto et al., 2005; D’Onghia et al., 2006; Kereš et al., 2009; Sales et al., 2010) but additional artificial exchange of angular momentum can still occur between baryons and dark matter in SPH simulations with low numerical resolution (Governato et al., 2004; Naab et al., 2007; Governato et al., 2007; Kaufmann et al., 2007; Mayer et al., 2008; Piontek & Steinmetz, 2009; Sales et al., 2010). Hence, to avoid the angular momentum catastrophe and produce realistic disks, simulations must have both a physically motivated feedback prescription, and very high numerical (mass and force) resolution (Scannapieco et al., 2008, 2009; Zavala et al., 2008; Ceverino & Klypin, 2009).
The simulations used in this study are part of a suite of very high numerical resolution disk galaxy simulations that incorporate a star formation (SF) and supernova (SN) feedback scheme that has been shown to overcome many of the past problems of disk galaxy simulations to successfully match a number of observed properties of galaxies (as discussed further below, and shown by the results of this paper).
In this paper, we use simulations of individual disk galaxies to follow their evolution in the magnitude – size plane and the stellar mass – size plane. We attempt to mimic the observations of these galaxies in a manner similar to the observed population, generating mock surface brightness images to measure disk scale lengths, avoiding the assumption that light must follow mass. We demonstrate that the simulated galaxies have properties similar to real galaxies. In §2 we describe our small sample of very high resolution simulated disk galaxies that span a representative range of masses, merger histories, and spin values. We show that our limited sample is in excellent agreement with the population of galaxies surveyed at both =0 (§3) and =1 (§4). In §5, we disentangle the evolution of individual galaxies from the evolution seen in the population as a whole. We conclude in §6.
2. Simulations & Analysis
2.1. The Simulations
These simulations were run with the N-Body + Smoothed Particle Hydrodynamics (SPH) code Gasoline (Stadel, 2001; Wadsley et al., 2004) in a fully cosmological CDM context using WMAP year 3 parameters111The choice of WMAP3 cosmology over WMAP7 cosmology has no impact on the results presented here. (, =0.74, , =0.77, n=0.96). The galaxies were originally selected from either a 25Mpc or 50Mpc (depending on their mass) N-Body simulation with uniform mass resolution throughout, and then resimulated at higher resolution with baryons using the volume renormalization technique (Katz & White, 1993; Navarro & White, 1994). This technique allows for significantly higher resolution on the central galaxy while also capturing the effect of large scale torques that are thought to deliver angular momentum to the galaxy (White, 1984; Barnes & Efstathiou, 1987).
The SF/SN scheme used in these simulations has been shown to effectively regulate star formation efficiency as a function of halo mass, resulting in a stellar mass – metallicity relationship for the simulated galaxies that is in excellent agreement with observations both locally and at high (Brooks et al., 2007; Maiolino et al., 2008). This regulation of star formation also leads to realistic trends in gas fractions, with our lowest mass galaxies being the most gas rich (Brooks et al., 2007), reproducing the observed incidence rate of Damped Lyman systems (QSO-DLAs) at = 3 (Pontzen et al., 2008), and the column densities of both QSO-DLAs and GRB-DLAs at = 3 (Pontzen et al., 2008, 2010). Of critical importance for the present study is the fact that these simulated disks maintain sufficient angular momentum to match the observed Tully-Fisher relationship (Governato et al., 2008, 2009) and produce galaxies with realistic disk sizes, as shown below.
The full details of our physically motivated SN feedback implementation were originally presented in Stinson et al. (2006). Briefly, the SF prescription ensures that the SFR density is a function of gas density according to the observed slope of the Kennicutt-Schmidt law, and a SF efficiency parameter, , sets the normalization of this relation. Each star particle represents a simple stellar population, born with a Kroupa initial mass function (Kroupa et al., 1993). As massive stars go SN, energy and metals are deposited into the nearest neighbor gas particles. The SN feedback recipe calculates the radius affected, and turns off cooling in those affected neighboring gas particles until the end of the snowplow phase as described by the Sedov-Taylor solution (McKee & Ostriker, 1977). The amount of energy deposited amongst those neighbors is 0.41051 ergs, as was adopted in all of our previous work mentioned above. Additionally, we include a uniform UV cosmic background following an updated model of Haardt & Madau (1996).
Governato et al. (2010) demonstrated that when force resolutions 100pc can be achieved, high density peaks that mimic SF regions in giant molecular clouds can be resolved with several hundreds of gas particles in 106 M☉ clumps (see also Booth et al., 2007; Ceverino & Klypin, 2009). This allows for the adoption of a realistic density threshold for SF (100 amu/cm3, Robertson & Kravtsov, 2008; Tasker & Bryan, 2008; Saitoh et al., 2008). To match the Kennicutt-Schmidt law, the high density SF threshold must be offset by a slightly higher value of = 0.1. This prescription leads to enhanced gas outflows that remove low angular momentum gas from the central regions of the galaxy (Governato et al., 2010, Brook et al., in prep.). At low masses, this creates a bulgeless disk with a linearly rising rotation curve, comparable to those observed (Oh et al., in prep; van den Bosch et al., 2001; de Blok et al., 2008). The low mass galaxies used in this paper, drawn from a 25Mpc volume, can achieve force resolutions 100pc. Hence, these simulations adopt the more realistic feedback prescription with high density SF and = 0.1. However, the more massive galaxies presented here are drawn from 50Mpc volumes, making it computational expensive to achieve similar force resolutions in a reasonable time. Hence, these simulated galaxies cannot resolve the high density SF peaks easily, and a lower SF density threshold must be adopted, 0.1 amu/cm3, with a lower = 0.05. These latter values have been adopted in all of our previous work on MW mass galaxies (Brooks et al., 2007; Governato et al., 2007; Brooks et al., 2009; Governato et al., 2009; Pontzen et al., 2008, 2010), and are a compromise that allow realistic disks to form, but are inefficient at driving gas outflows. Thus, low angular momentum material that might be lost from the central regions is maintained, helping lead to the creation of large bulges in the MW mass galaxies (see also van den Bosch et al., 2001; Bullock et al., 2001; van den Bosch et al., 2002; Maller & Dekel, 2002; van den Bosch et al., 2003; D’Onghia & Burkert, 2004; Dutton, 2009). Additionally, the creation of these large bulges can be due to missing physics. In particular, AGN feedback has not yet been added to these simulations, and is potentially a key mechanism to help create realistic bulges. Due to our small sample size, it is difficult to quantify if our bulges are substantially different from observed bulges in the same galaxy mass range.
The simulated galaxies used in this work were selected to span a range of spin values and merger histories, with the last major merger redshift as low at 0.8. Properties of these simulations are listed in Table 1.
| simulation | Mvir | M∗ | M | M | zlmm | N within Rvir | |||
|---|---|---|---|---|---|---|---|---|---|
| M☉ | M☉ | M☉ | M☉ | pc | dm+star+gas | ||||
| (1) | (2) | (3) | (4) | (5) | (6) | (7) | (8) | (9) | (10) |
| h516 | 3.91010 | 2.6108 | 1.6104 | 3.3103 | 0.05 | 0.05 | 1.2 | 87 | 3.5106 |
| h799 | 2.21010 | 1.3108 | 1.6104 | 3.3103 | 0.04 | 0.05 | 3.0 | 87 | 1.9106 |
| h603 | 3.81011 | 3.11010 | 3.0105 | 6.3104 | 0.06 | 0.11 | 1.1 | 231 | 3.8106 |
| h986 | 2.11011 | 2.21010 | 3.0105 | 6.3104 | 0.04 | 0.07 | 0.8 | 231 | 2.4106 |
| h239 | 8.51011 | 7.81010 | 1.2106 | 2.1105 | 0.03 | 0.05 | 1.1 | 347 | 2.8106 |
| h258 | 8.01011 | 7.41010 | 1.2106 | 2.1105 | 0.04 | 0.07 | 0.8 | 347 | 2.8106 |
| h277 | 7.11011 | 6.91010 | 1.2106 | 2.1105 | 0.03 | 0.04 | 3.0 | 347 | 2.3106 |
| h285 | 8.71011 | 8.11010 | 1.2106 | 2.1105 | 0.02 | 0.05 | 1.9 | 347 | 3.0106 |
Note. — Properties of the galaxies as drawn from the simulations. Columns (2) and (3) list the virial mass and total stellar mass of the halos at =0. Columns (4) and (5) list the mass resolution of individual dark matter and star particles, respectively. Column (6), , is the dimensionless spin parameter, la Bullock et al. (2001), for the entire halo. Column (7) lists the spin parameter for all gas within the halo. The last major merger (lmm) redshift in column (8) is defined at the time when the cores merge of two galaxies initially 3:1 in halo mass. Column (9), , is the spline gravitational force softening. The final column (10) lists the total number of particles within the virial radius of the halo at =0.
2.2. Deriving Disk Scale Lengths
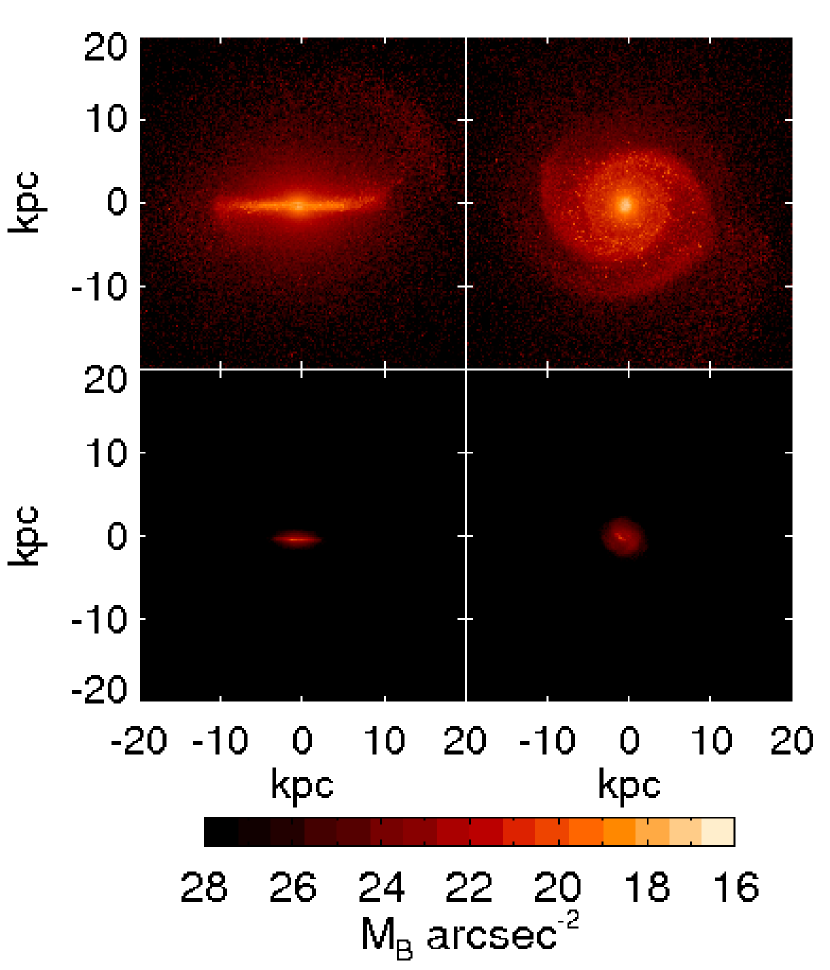
All of our simulations are of field galaxies that do not undergo major mergers below 0.5, making them disk dominated at redshift zero. In order to compare our simulated disk scale lengths to observational results in as realistic a way as possible, we wish to fit the light profile rather than the underlying mass profile. We create artificial surface brightness images of our simulated galaxies using Sunrise (Jonsson, 2006; Jonsson et al., 2010), a Monte Carlo radiative transfer program that produces a spectral energy distribution (SED) for each resolution element of the simulations. This is done by identifying the age and metallicity of each star particle, which are then convolved with the Starburst99 stellar population synthesis models (Leitherer et al., 1999; Vázquez & Leitherer, 2005) to produce an SED. Sunrise assumes dust tracks with the metallicity of the gas particles, and performs ray tracing from each star particle to compute the observed SED including absorption and scattering. From this, we generate mock images in chosen filter bands. Figure 1 shows artificial edge-on and face-on band images, including dust reprocessing, for two different mass galaxies.
Most of the observational surveys that have investigated the evolution of disk sizes worked in the rest frame band across redshifts. To compare to these results as a function of redshift, we have generated face on band surface brightness images at =0.5 and =1 that include the effects of surface brightness dimming, and using rest frame face on band surface brightness images for the =0 galaxies. Two of our disk galaxies are undergoing a major, disruptive merger at =1. For these galaxies, we created face on images for the most massive progenitor at a time just prior to the merger (=1.25) while the disk was still rather undisturbed.
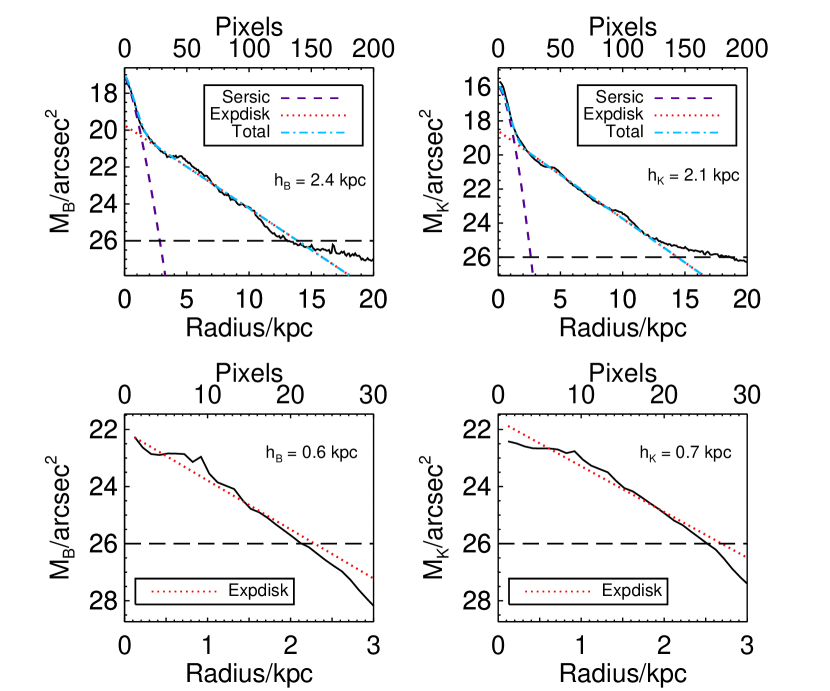
The face on Sunrise images were fit with a Sersic bulge component and an exponential disk component using the publicly available 2D surface brightness fitting code Galfit (Peng et al., 2002). Additionally, bars exist in both h603 and h986 at =1 that were fit by a third component, reducing the B/D ratio of these galaxies at this step. The Galfit results were checked against a 1D, radially averaged fit generated from the same images, and found to be in good agreement. To mimic observations, the fits were required to be a good match down to a limiting surface brightness value of 26 mag/arcsec2 (hence the importance of using surface brightness dimmed images at =1). Example fits are shown in Fig. 2 for the same galaxies shown in Fig. 1, with band fits shown simply for a comparison of the band results to those at a longer wavelength. We verified that using redshifted, surface brightness dimmed Sunrise images in the band at higher z yielded similar disk scale lengths as the rest frame band.
As can be seen in Table 1, a couple of these galaxies have undergone major mergers since =1, while some galaxies have had a very quiescent history. We note that at =1, two of our galaxies (h239 and h285) had no component that could be well fit by an exponential. This may be due to mergers that occur in these galaxies near this time. Galaxy h239 has the most active merger history of our simulated galaxies, with continual mergers (both major and minor) until 0.5. Galaxy h285 begins to accrete a satellite with 1/7 of the stellar mass of the main halo at =1.25. However, the core of this satellite does not merge with the main halo until 0.8. In both cases, we searched in 250 Myr periods from 0.75 1.25 to identify a step with a possible exponential disk, but none could be found. Hence, those steps have been excluded from the high redshift analysis below.

Scannapieco et al. (2010) demonstrated that measuring disk scale lengths based on light rather than a kinematic decomposition could dramatically increase the resulting disk-to-total, D/T, ratio of their simulated galaxies, making measurement technique a potentially important reconciler between observations and simulations. In Fig. 3 we plot the =0 surface mass density as a function of radius for both the stars (solid line) and the gas (dashed line) in the simulated galaxies. Also shown as the dotted line is the exponential fit derived in the band for these simulations (listed in Table 1). In a future paper (McCleary et al., in prep), we will explore in detail the differences between mass/kinematic results and light results (e.g., scale lengths, bulge-to-disk ratios, the role of dust and inclination, etc.). Here, however, we note that an initial comparison of mass versus light exponential scale lengths demonstrates a less dramatic difference in our simulations than in Scannapieco et al. (2010). As seen in Fig. 3, the band scale length is generally a good match to the stellar surface mass density. For a quantitative comparison, scale lengths were derived for the stellar mass over the same region that the disk dominates the light profile. The two methods were found to agree to within 10% for 75% of the galaxies. Variation in the techniques appears to be mostly attributable to varying mass-to-light ratios (McCleary et al., in prep).
The bulge/disk decompositions were performed on the dust extinguished Sunrise results. However, disk scale lengths and central surface brightnesses were found to be identical in both the face on Sunrise images with and without dust reprocessing, while the central bulge component was dust extinguished. Thus, using the dust extinguished versus non dust extinguished decomposition has no effect on the results for the disk analysis presented below. It is generally expected that dust should have some effect on both the central surface brightness and the scale length of the disk component, even for face on orientations (Calzetti, 2001; Graham & Worley, 2008). We speculate that our more massive galaxies have little/no effect from dust due to the fact that they are also more gas poor than observed galaxies (because they use up gas forming too many stars, discussed in more detail in Section 5.2). Our low mass galaxies are gas rich, in agreement with observed galaxies in this mass range (Governato et al., 2010; Geha et al., 2006), but metal poor (Brooks et al., 2007), making dust negligible.
It is important to note that the following analysis purposely focuses on the evolution of the disk alone. That is, the discussion below of how properties evolve with time neglects the bulge component of the galaxy. This is done for three reasons. First, as discussed above, our MW-mass galaxies tend to have larger bulges than observed. This is a problem that has historically plagued MW-mass simulated disks (e.g., Abadi et al., 2003; Scannapieco et al., 2009), and is likely due to the inability to correctly model SF and feedback at the necessary high resolutions to drive loss of low angular momentum gas, and due to missing physics such as AGN feedback. Hence, while the disks of our simulated galaxies appear to be in good agreement with observed disks (as presented below), the growth of the bulge in these massive galaxies is probably not modeled correctly. Second, observations of the evolution of disk galaxies in the magnitude – size plane have either a) selected galaxies that can be fit with a small pure Sersic index, , so that they are disk dominated, or b) done a bulge/disk decomposition. In either case, the results we wish to compare to are concerned with disks only. Finally, our goal here is to examine the growth of disks using these simulations, not bulges or spheroidal components.
“Observable” properties of the simulated galaxies are listed in Table 2. Total magnitudes in each band are derived from Sunrise, with each galaxy being integrated out to roughly 50 comoving kpc (i.e., essentially all of the flux from the simulated galaxy is contained). Table 2 also lists the =0 stellar mass derived for the entire galaxy (disk + spheroid) based on Sunrise colors using the k_sdss_bell routine in the kcorrect package (Blanton & Roweis, 2007). A comparison to Table 1 shows that the simulated stellar masses are generally 40% larger than those derived from the photometric results. A more detailed comparison will be presented in McCleary et al., (in prep). In Table 2 we list the bulge-to-disk ratios (B/D) despite the caveat mentioned above regarding large bulges in our higher mass galaxies. Disk scale lengths in the band at =0 are given in Table 2, while the band scale lengths used in the following plots are given in Table 3. As seen in observational studies (de Jong, 1996a; MacArthur et al., 2003), the band scale lengths tend to be longer than the band scale lengths, at least for the six most massive galaxies (with the two dwarf galaxies exhibiting different behavior). It has been debated whether this trend for disk scale lengths to be longer at shorter wavelengths is due to dust effects or age gradients (de Jong, 1996b). As noted above, dust plays no role in our face on disk fits, meaning that this trend in the simulations is due entirely to age and metallicity gradients.
| simulation | Mi | MB | B/Di | B/DB | M | hi | V2.2 | |
|---|---|---|---|---|---|---|---|---|
| M☉ | kpc | km/s | ||||||
| (1) | (2) | (3) | (4) | (5) | (6) | (7) | (8) | (9) |
| h516 | -16.8 | -15.9 | 0.08 | 0.14 | 0.53 | 3.4108 | 1.0 | 51 |
| h799 | -16.2 | -15.6 | 0.00 | 0.00 | 0.37 | 1.1108 | 0.7 | 43 |
| h603 | -21.3 | -20.5 | 1.25 | 0.72 | 0.52 | 2.21010 | 4.0 | 143 |
| h986 | -21.1 | -20.3 | 0.63 | 0.38 | 0.45 | 1.31010 | 2.8 | 137 |
| h239 | -22.5 | -21.8 | 0.35 | 0.16 | 0.41 | 4.21010 | 2.5 | 246 |
| h258 | -22.4 | -21.5 | 0.86 | 0.45 | 0.50 | 5.31010 | 5.3 | 204 |
| h277 | -22.1 | -21.2 | 0.63 | 0.42 | 0.52 | 4.31010 | 2.3 | 250 |
| h285 | -22.3 | -21.3 | 1.33 | 0.78 | 0.55 | 5.61010 | 4.5 | 203 |
Note. — Magnitude and color results are dust free measurements for the entire galaxy (disk and spheroidal components) at =0. B/D ratios include the effect of dust extinction (see discussion in Section 2.2). The stellar masses listed in column (7) are derived using k_sdss_bell in the kcorrect package (Blanton & Roweis, 2007) from SDSS colors provided by Sunrise. Rotation curve velocities are measured at 2.2 band disk scale lengths.
3. The Fundamental Plane for Disk Galaxies
Size, magnitude (or mass), and rotational velocity make up a fundamental plane for disk galaxies (Pizagno et al., 2005; Gnedin et al., 2007; Courteau et al., 2007). Governato et al. (2009, see their figure 5) demonstrated that these simulated galaxies lie on the observed magnitude – velocity relation for disk galaxies (also known as the Tully-Fisher relation). In this paper we derive disk scale lengths in order to extend this analysis, and show that our galaxies are also a good match to the observed magnitude – size and velocity – size relations as well. All of our galaxies have sizes and velocities (Table 2) that agree well with the observed velocity – size trend (Courteau et al., 2007). Two of the more massive galaxies have slightly high velocities for their size (h239 and h277), but still lie within the 2 scatter of observed galaxies.
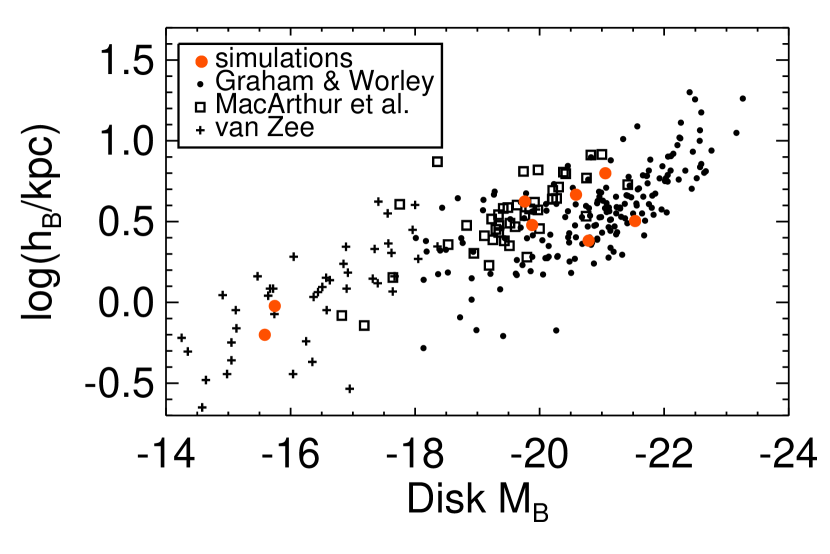
The band disk magnitudes, MB, and scale lengths, hB, of our simulated galaxies at =0 are shown in Fig. 4. The simulated galaxies (red circles) are compared to three observational samples, MacArthur et al. (2003) and Graham & Worley (2008) at the massive end, and van Zee (2000) at the low mass end. The Graham & Worley (2008) data have adopted a dust correction based on Driver et al. (2008), while the MacArthur et al. (2003) data are dust corrected based on inclination, following equations 1, 2, and 7 listed in Graham & Worley (2008). Again, possibly due to low gas (and therefore dust) content, the six more massive galaxies shown here are free of dust effects. As such, they should be compared to dust corrected observational data. At the low mass end, however, van Zee (2000) makes no internal dust corrections, as the low metallicities of the dwarf galaxies in her sample are expected to lead to little effect from dust.222Note that there appears to be a slight offset between the dwarf galaxy sample and the higher mass sample. This break has been observed previously, and suggests a structural difference between dwarf and larger disk galaxies (Schombert, 2006). Clearly, the disk sizes of the simulated galaxies are in good agreement with observed disk sizes.
We use the band scale lengths of the observational samples in Fig. 4, which can be compared to the band results at =1 in the next section since the band is redshifted into the band at =1. However, the magnitude – size (and stellar mass – size) relation has been measured in multiple bands for a large sample of SDSS galaxies (Shen et al., 2003; Fathi et al., 2010). The SDSS results are consistent with the results plotted in Fig. 4, though we purposely select observational samples that have done a bulge/disk decomposition and fit a pure exponential to the disk surface brightness fit, in order to isolate the evolution of the disk and eliminate any contamination from a central spheroid.
As discussed in the Introduction, historically it has been a challenge for cosmological disk galaxy simulations to match the observed fundamental relations for galaxy disks (e.g., Navarro & Steinmetz, 2000). The failure to reproduce observed trends is the result of the angular momentum catastrophe, exacerbated by the fact that previous studies followed mass/kinematic results rather than light profiles.
Our success at matching the observed disk scaling relations is a result of the fact that our disk baryons maintain angular momentum through time, due to an increased resolution and a physically motivated feedback mechanism (see Brooks, 2010, for a review of how each of these processes contribute to the formation of realistic disks). A number of works have attempted to isolate the separate role of resolution and feedback (e.g., Governato et al., 2004; Kaufmann et al., 2007; Naab et al., 2007; Piontek & Steinmetz, 2009). In N-Body + SPH simulations, dark matter particles are typically an order of magnitude more massive than the gas particles, leading to an exchange of kinetic energy in two body interactions that kinematically heats the disk, randomizing velocity vectors, and potentially turning a disk component into a spheroid (Steinmetz & White, 1997; Mayer et al., 2008). This effect can be reduced at higher mass resolutions that lower the discrepancy in particle masses. Kaufmann et al. (2007) used controlled (non-cosmological) N-Body+SPH simulations to evaluate the amount of angular momentum that can be lost purely due to resolution. They concluded that 106 particles within the virial radius are necessary for a disk galaxy to maintain roughly 90% of its original angular momentum.
Yet even if resolution can be increased to the point of maximum angular momentum retention, disks will still suffer dramatic angular momentum loss compared to observed disk galaxies if energy feedback is neglected. Feedback prevents rapid, early cooling of gas particles (the overcooling problem discussed in the Introduction; see references therein). Heating and expansion of the gas creates a hot reservoir, allowing the gas to cool at later times after the era of rapid mergers, and preventing angular momentum loss via dynamical friction in mergers (e.g., Maller & Dekel, 2002). Additionally, by preventing overcooling, feedback prevents gas from rapidly turning into collisionless star particles. Without feedback, halos of all masses are equally efficient at converting gas into stars (Brooks et al., 2007), producing galaxies that are too gas poor compared to = 0 disk galaxies. Because feedback regulates star formation, it allows for gas reservoirs to develop that allow disks to survive to the present day (Hopkins et al., 2009; Governato et al., 2009; Moster et al., 2010a). The existence of large, thin disks at the present day thus requires feedback.
Not all SN feedback schemes lead to disk galaxies that satisfy observed constraints such as the Tully-Fisher relation, size – velocity or size – luminosity relations, or the stellar mass – metallicity relation. Because the nearest neighbor gas particles surrounding SNe are dense and cold, a simple energy deposition will quickly be radiated away and not affect the simulation (e.g., Katz, 1992; Steinmetz & Navarro, 1999). Two main schemes have been adopted to overcome this problem. In the first, a multiphase model of the ISM is implemented with a hot gas reservoir inside each gas particle (Hultman & Pharasyn, 1999; Marri & White, 2003; Springel & Hernquist, 2003; Scannapieco et al., 2006; Harfst et al., 2006), overcoming the problem of thermal energy being spread over the entire particle mass, and preventing the hot gas particles from being artificially influenced by their cold gas nearest neighbors. In the second, cooling is turned off in the gas particles near a SN explosion in order to mimic the sub-resolution adiabatic expansion of the SN (Thacker & Couchman, 2000, 2001). The “blastwave” scheme adopted here also turns off cooling in nearest neighbor particles, but attempts to model this based on what is known about actual SNe, determining the radius of each SN remnant based on the analytic blastwave solution for a SN remnant (McKee & Ostriker, 1977; Stinson et al., 2006), and cooling is only turned off for those particles within the blast radius. Because many SNe typically contribute feedback within a dense star forming region, the thermal energy from all of these SNe can combine to create a larger blast radius. The differences in the resulting disk between a simple energy deposition (“thermal” feedback) and the blastwave model have been examined in Mayer et al. (2008) and Governato et al. (2008). As examined by these previous works, the adoption of the “blastwave” feedback model, combined with high resolution (all simulations presented here have more than 106 particles within the virial radius at = 0, see Table 1), overcome past problems with cosmological disk galaxy simulations and allow for the present study.
4. Evolution of the Magnitude – Size Relation
Having established that these simulated disk galaxies match observed disk scaling relations at =0, we now use them to investigate the degeneracy in the magnitude – size evolution with time. First, we establish that the simulations also match the available observational data at =1.
4.1. Evolution as a Population
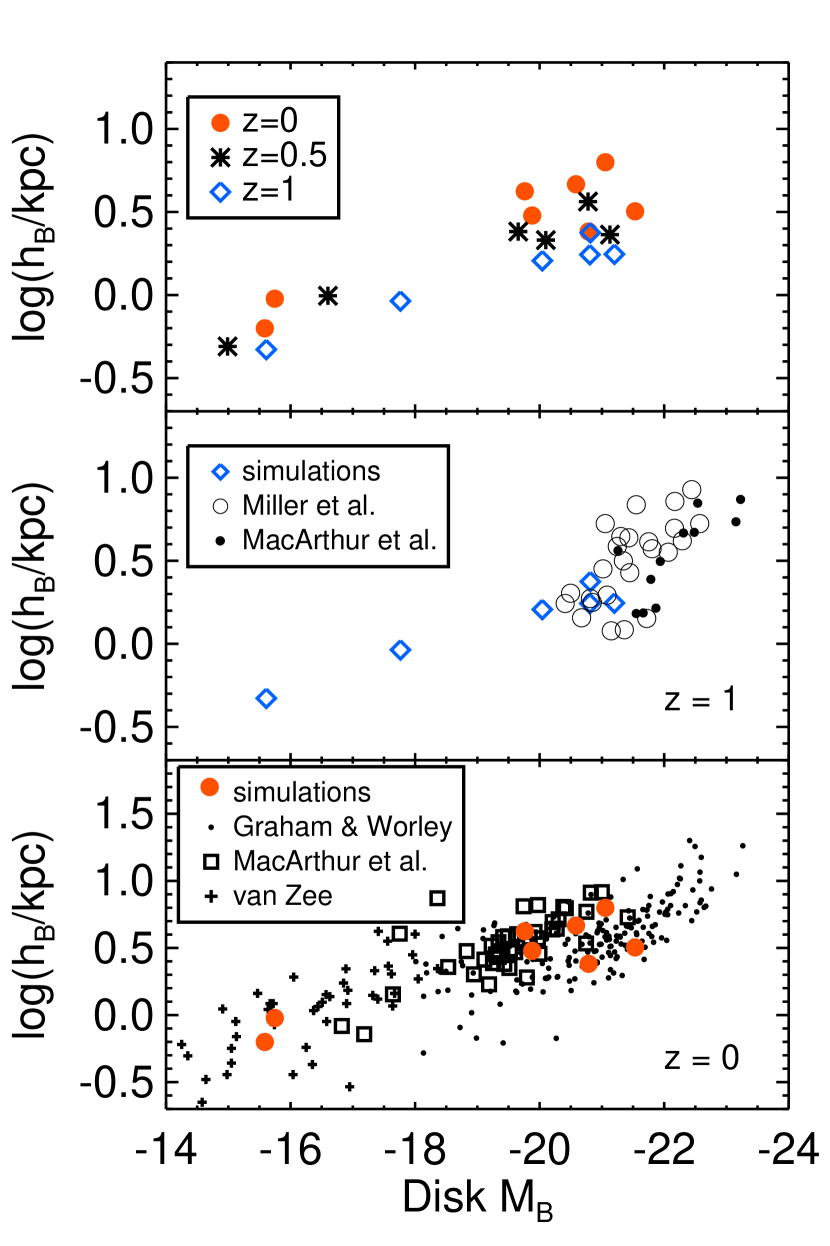
The evolution of the magnitude – size relation for these simulated galaxies is shown in Fig. 5. The top panel shows the simulation results at =0, 0.5, and 1. It is evident that the magnitude – size relation for these galaxies is evolving in time, dimming in surface brightness since =1. Despite the fact that these are individual galaxies being followed in time, the snapshot of the population of disks at each redshift is consistent with the observations. This is evident in the bottom two panels. The middle panel compares the simulated disk scale lengths at =1 to the decomposed band disk scale lengths of galaxies at 0.9 1.2 from MacArthur et al. (2008) and Miller et al. (in prep). No dust corrections are applied to the observational =1 data, as these galaxies are expected to be low metallicity where corrections are uncertain and often ignored (Dutton et al., 2010b). Any realistic dust corrections are likely to be tiny, and not affect the results. The bottom panel is a reproduction of Fig. 4, shown again for easy comparison of the results across redshifts. While observational biases allow for a direct comparison only at the massive end at =1, the disk sizes of the simulated galaxies are in good agreement with observed disk sizes, as a function of redshift. We note that observational data that used a single Sersic component fit (e.g., Barden et al., 2005) are also in good agreement with the =1 data presented here (and lie in the same magnitude range), despite the lack of a bulge/disk decomposition. For clarity, we show only the decomposed data in Fig. 5.
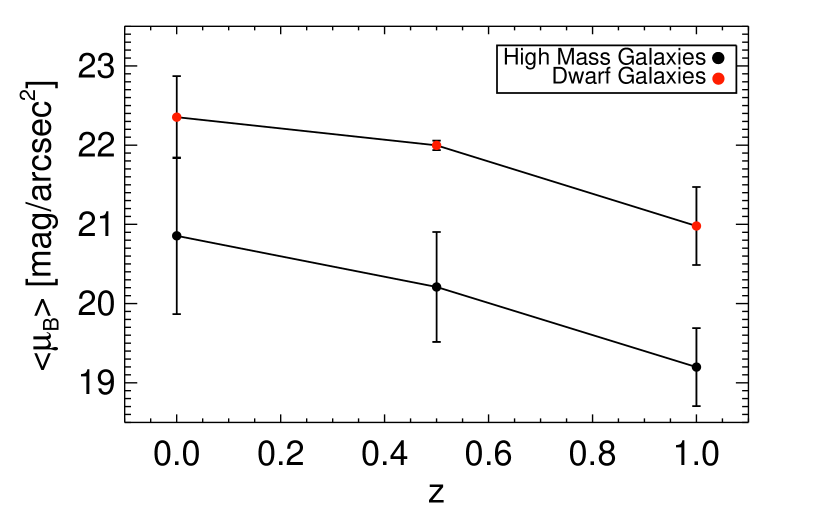
The top panel of Fig. 5 shows that there has been apparent dimming of the surface brightness of the simulated population since =1. Fig. 6 quantifies this evolution, showing the change in the surface brightness, , of the simulated galaxy disks. We have defined such that
| (1) |
Data points in Fig. 6 at =0, 0.5 and 1 are for the mean for the population at that time, and error bars reflect the standard deviation of the sample. Because our two dwarf galaxies are too faint to be generally observable at =1, Fig. 6 shows the evolution of these two galaxies separately from the higher mass galaxies. However, the evolution is roughly similar in both mass ranges, with about 1.5 magnitudes in surface brightness dimming between =1 and =0. A dimming of 1.5 magnitudes is consistent with observational studies that have examined the surface brightness evolution of disk dominated galaxies (e.g., Simard et al., 1999; Ravindranath et al., 2004; Trujillo & Aguerri, 2004; Barden et al., 2005; Melbourne et al., 2007; Kanwar et al., 2008).
4.2. Evolution of Individual Galaxies
| simulation | MB | MB | hB | hB | M∗ | M∗ | ||
|---|---|---|---|---|---|---|---|---|
| mag/” | mag/” | mag | mag | kpc | =0/=1 | M☉ | =0/=1 | |
| =0 | to =1 | =0 | to =1 | =0 | =0 | |||
| (1) | (2) | (3) | (4) | (5) | (6) | (7) | (8) | (9) |
| h516 | 22.7 | 1.5 | -15.7 | 2.0 | 0.95 | 1.0 | 4.3108 | 1.69 |
| h799 | 22.1 | 0.7 | -15.6 | 0.0 | 0.6 | 1.3 | 1.8108 | 1.32 |
| h603 | 22.5 | 2.8 | -19.8 | 1.0 | 4.2 | 2.4 | 1.31010 | 2.78 |
| h986 | 21.2 | 1.0 | -19.9 | 0.2 | 3.0 | 1.9 | 1.01010 | 3.22 |
| h239aaMeasured at z=1.25; undergoing major merger at z=1. | 19.3 | N/A | -21.5 | N/A | 3.2 | N/A | 9.0109 | 10.17 |
| h258aaMeasured at z=1.25; undergoing major merger at z=1. | 21.3 | 1.6 | -21.1 | -0.2 | 6.3 | 2.7 | 3.21010 | 2.53 |
| h277 | 19.7 | 0.6 | -20.8 | 0.4 | 2.4 | 1.4 | 1.91010 | 1.95 |
| h285 | 21.4 | N/A | -20.6 | N/A | 4.6 | N/A | 2.01010 | 3.07 |
Note. — For columns (3) and (5) ( and MB), positive values represent dimming between =1 and =0. A negative value means that the galaxy disk is brighter at =0. Note that values listed in this table are for the disk only, while those in Table 2 are for the entire galaxy (disk and spheroid). h239 and h285 do not have exponential disks at =1. The stellar disk masses have been measured directly from the star particles in the simulations, based on a kinematic disk decomposition. See Section 5 for details.
The previous section examined the population of simulated disks in terms of surface brightness evolution. We now decompose the surface brightness trends into luminosity and size evolution, and demonstrate how individual galaxies evolve in each property with time. Table 3 quantifies the changes in the disk band central surface brightness (, as opposed to plotted in Fig. 6), size, and magnitude for each of our simulated galaxies.
4.2.1 Luminosity Dimming since = 1
It is widely expected that galaxies should undergo dimming since =1, due to declining star formation rates. The key question is how much galaxies dim. It is already apparent from Fig. 5 that our more massive galaxies are undergoing growth in size between =1 and =0, meaning that the change in surface brightness of 1.5 magnitudes over this time cannot be entirely due to luminosity dimming at a fixed size. The changes in size and magnitude that are quantified in Table 3 are also visualized in Fig. 7. Now it can be seen that there is in fact a dependency on mass in the evolution of the galaxies. Our more massive galaxies are growing in size and generally undergoing only a small amount of dimming in total magnitude; some are even getting brighter with time. Meanwhile, there is little change in the scale length of our lowest mass galaxies, but their evolution in luminosity is erratic (for this sample of two galaxies) due to their bursting star formation histories.
The luminosity evolution of the low mass dwarf galaxies is tied up with their particular star formation histories. While h799 is quiescent between =1 and =0.5 so that it dims, it undergoes another burst of SF at low , increasing its magnitude. On the other hand, h516 stays relatively quiescent between =1 and =0, so that it undergoes significant luminosity dimming (of 2.0 magnitudes). This large amount of dimming may at first seem to be at odds with the fact that low mass galaxies are generally undergoing more SF today than they were in the past (this is discussed further in Section 5, and is one form of galaxy “downsizing”). However, this extreme dimming for low mass galaxies has been seen in observational results as well (Melbourne et al., 2007; Kanwar et al., 2008). Melbourne et al. (2007) concluded that small galaxies (those with half light radii333 The half light radius is a factor 1.68 times larger than the disk scale length for an exponential disk. 2 kpc) have undergone roughly 2.5 magnitudes of dimming since =1. Given the bursty SF nature of the two low mass dwarfs we have in our sample, it is not possible to compare statistically to the observations, but there is nothing to suggest that our simulated dwarfs are inconsistent with the Melbourne et al. (2007) results.
At the higher mass end, Melbourne et al. (2007) find 1.5 mag of dimming since =1 for galaxies with half light radii 3 kpc (disk scale lengths 1.8 kpc), if the strictest interpretation is made that all surface brightness evolution is in luminosity rather than size. Clearly, this is not true for our high mass galaxies, which are growing with time.
If galaxies are growing with time, then comparing galaxies that are a given size (e.g., 3 kpc) at =0 with galaxies that are of similar size at =1 means that similar galaxies are not being compared. Those =0 galaxies will have been smaller at =1, and it is unknown from our simulation results what size galaxies with scale lengths larger than 2.5 kpc at =1 will have evolved to by =0. In summary, if galaxies are growing since =1, this will mimic a larger change in luminosity on the magnitude – size relation than actually occurs (Trujillo & Aguerri, 2004; Barden et al., 2005; Trujillo & Pohlen, 2005).
4.2.2 Change in Size since = 1
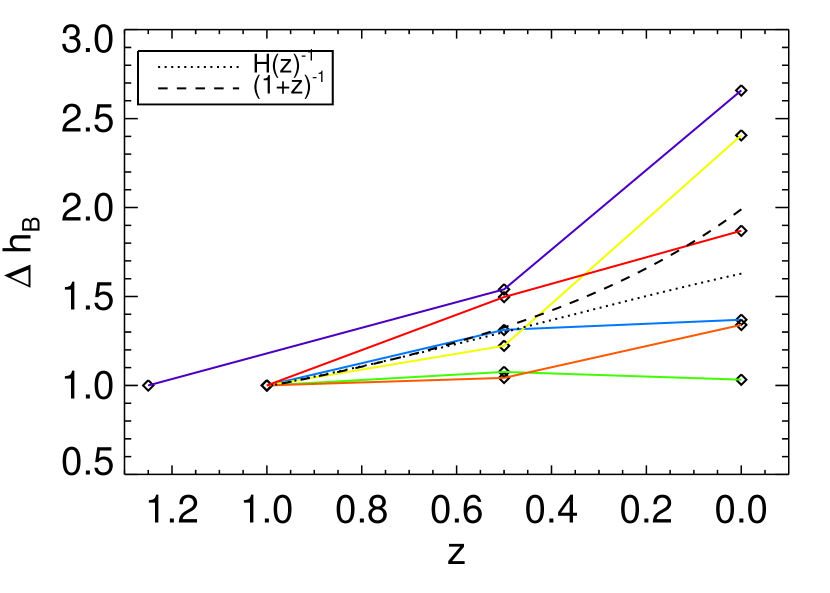
Our simulated disk galaxies as a population appear to match the observational results for the evolution in the size-magnitude plane very well (Fig. 5). Yet Fig. 7 demonstrates what the observations cannot witness: individual galaxies are growing with time, so that the evolution in the magnitude – size plane cannot be due to dimming alone. Disk scale length evolution for each galaxy is plotted in Fig. 8, normalized to their size at =1. These values are also quantified in Table 3. Only a few of these galaxies show negligible size evolution, with the two lowest mass galaxies undergoing the smallest size changes. The remaining galaxies show clear growth, and about half evolve by the amount predicted by the simple SIS model, (nearly a factor of two back to =1), or more. The dotted line in Fig. 8 shows the growth predicted for the simple SIS model (Mo et al., 1998), while the dashed line shows the growth determined by Mao et al. (1998) using 16 galaxies at =1.
However, it is not necessarily expected that any given galaxy should follow the analytic growth predicted by the SIS model. Somerville et al. (2008) demonstrated that more sophisticated models adopting NFW profiles could bring the observations and theory closer in line. The prediction that sizes scale with is based on the assumption that
| (2) |
where is the circular velocity of the halo and is the radius at which the mean density is equal to 200 times the critical density. Then
| (3) |
where is the dimensionless spin parameter (Peebles, 1969). If the disk size follows , both and must stay roughly constant with time. While does stay roughly constant back to =1 in these galaxies, does not. It is known that may vary for individual halos due to mergers or smooth accretion (Gardner, 2001; Maller et al., 2002; Vitvitska et al., 2002; Peirani et al., 2004; Hetznecker & Burkert, 2006; D’Onghia & Navarro, 2007). The previous work of analytic models do not require to stay constant, as they simply use a snapshot in time and the spin values of halos at that snapshot. That is, they study a population of galaxies at a given time, and make no attempt to follow an individual galaxy with time as we do here. Hence, it is not surprising that some of the simulated galaxies presented here deviate from growing precisely as .
A better question, if we want to compare our disk sizes to analytic models, is to ask if the scale lengths measured based on our light profiles are similar to those predicted by analytic models. For an NFW density distribution, the disk scale length, Rd is
| (4) |
where measures the halo concentration, and is NFW the scale radius. uses to determine the energy of the NFW halo compared to the SIS model, and is a factor that accounts for the gravitational effect of the disk (adiabatic contraction). and are the fraction of disk angular momentum and mass, respectively, to the total halo. For sizes to scale as , it is assumed that = 1. This is likely to not be true, though, as demonstrated by Sales et al. (2009).
We have determined the values of , , , and for each of our galaxy halos at =0, directly from the simulation results. We compared the expected from these quantities, as derived by equation 4, to the band scale lengths listed in Table 2. The results agree to within 10% for only the two lowest mass galaxies. For the more massive galaxies, the predicted NFW is consistently shorter than that found for the band, and for four of the six massive galaxies, the measured band results are a factor of 2-4 larger than the NFW prediction.
The main source of this discrepancy appears to be in the value obtained for the spin value, , for the entire halo. If the spin of the gas, , within the halo is used instead, the discrepancy shrinks so that six of the eight galaxies have NFW and band results within 10% of each other.444We note that the two that remain discrepant both show evidence for a downward “break” in the exponential light profile at large radii. As listed in Table 1, the values of are generally lower than for all halos except the two lowest mass galaxies. This trend for to be larger than has been seen previously in simulations (Sharma & Steinmetz, 2005), and has been suggested as one reason why disks may have a smaller fraction of low angular momentum than their dark matter halos (Chen et al., 2003). Recently, Roškar et al. (2010) used a similar simulation run with Gasoline to show that gas that enters the virial radius of a halo and cools toward the disk is torqued by the hot halo gas, so that the angular momentum of the disk gas becomes aligned with the hot halo. This is true even for gas that is initially counter-rotating with the disk, and hence is a powerful method to remove negative and low angular momentum material from the disk. The lack of low angular momentum material for the disk gas will lead to larger values of compared to for the total halo. The disk stars, whose light we trace in the results of this paper, form from this cold gas with larger spin values, and thus will be a better predictor for the NFW than .
The result that the disk baryons are lacking a low angular momentum component compared to the DM is not trivial. This result needs to be examined in detail. However, this requires a full evaluation of the history of angular momentum in these halos, which is beyond the scope of the current paper. We reserve such a study for future work.
5. Growth of the Stellar Disk since = 1
As discussed above, numerous observational studies have found that there has been a decline in the surface brightness of disk galaxies, by a magnitude or more, since =1. Due to the fact that there is little evidence for a change in the size function of disk galaxies over this time period (e.g., Kanwar et al., 2008), the observations can only be interpreted as an upper limit to luminosity evolution. That is, if disks do not change in size, then all of the evolution must be in luminosity. However, due to the degeneracy in the magnitude – size plane, the option of possible growth is left open.
Barden et al. (2005) investigated this disk growth. After showing that they, too, agreed with 1 magnitude of surface brightness dimming back to =1, they then used galaxy colors to derive stellar masses and considered the stellar mass – size relation for their galaxies. They found that this relation, unlike the magnitude – size relation, showed little or no evolution back to to =1. Disk growth may still occur, but must occur in such a way that galaxies remain on the same stellar mass – size relation with time. They concluded that this was evidence for weak inside-out growth of galaxy disks, as did additional later studies (Trujillo & Pohlen, 2005; Trujillo et al., 2006; Dutton et al., 2010b).
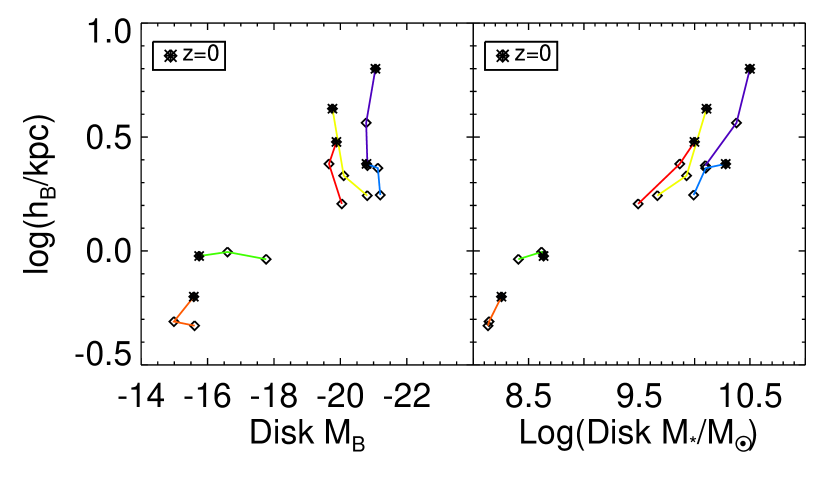
The right panel of Fig. 7 shows the evolution in the stellar mass – size plane for our simulated galaxies. In agreement with previous results (Barden et al., 2005; Brook et al., 2006; Firmani & Avila-Reese, 2009), these galaxies are growing along a path that keeps them on the same stellar mass – size relation with redshift.
The stellar mass shown in the right panel of Fig. 7 is for the disk only. To separate the disk growth from total stellar growth of these galaxies (i.e., from the bulge and halo spheroidal stellar components), a kinematic decomposition was done to identify disk stars at =0. To identify disk particles, the galaxies are first aligned so that the disk angular momentum vector lies along the z-axis. Jz/Jcirc is calculated for each star particle in the galaxy, where Jz is the angular momentum in the x-y plane, and Jcirc is the momentum that a particle would have in a circular orbit with the same orbital energy. Disk stars are identified as those having near circular orbits, so that Jz/Jcirc 0.8.555This criterion corresponds to an eccentricity 0.2, which matches the eccentricities observed in the Milky Way disk (Nordström et al., 2004). These =0 disk stars were then searched for in their most massive progenitor at =0.5 and =1 to find the mass of these stars that had formed at each step, with the results plotted in Fig. 7.
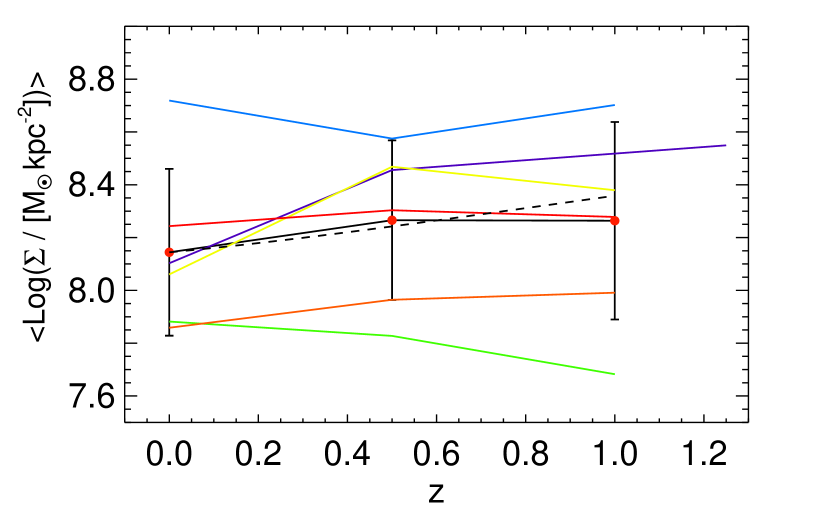
If galaxy disks are evolving approximately along the same stellar mass – size relation with time, then the surface mass density of disks should show little evolution back to =1 (Barden et al., 2005; Somerville et al., 2008). That is, a galaxy with stellar mass of 1010 M☉ at =1 is roughly the same size (though maybe just slightly smaller) as a galaxy at =0 with 1010 M☉, yielding roughly the same surface densities. Fig. 9 tentatively confirms this result, showing that the surface mass density of our population of disks evolves little with time, with surface mass density, defined as
| (5) |
The red points with error bars, connected by the solid black line, show the mean and standard deviation for the whole sample at = 0, 0.5, and 1. The colored lines are the results for individual simulated disks with time. We note, however, that the dashed line shows the prediction for the surface mass density evolution for the simple SIS model (Mo et al., 1998). The standard deviation within our small sample is large, so that the simulated galaxies are fully consistent with the predicted growth. While our sample is clearly too small to derive statistical results, the change in the mean surface density of the population between =1 and =0 is only 0.1 dex, half of the evolution predicted by the SIS model. We note that an updated model by Somerville et al. (2008) that incorporates the evolution of NFW halos derived in N-Body simulations predicts only 0.2 dex change in the stellar surface mass density back to =1. This small evolution in surface mass density is due to evolution along a stellar mass – size relation that changes little with time.
5.1. The SFR – Mass Relation
Due to the fact that the stellar mass – size relation shows little change with time, examining the evolution of galaxy disks at a fixed stellar mass is similar to examining the evolution at a fixed size. However, because galaxies are growing with time, a galaxy that is, e.g., 3 kpc in size and 1010 M☉ in stellar mass at =1 has increased in mass and size by =0 and another galaxy has moved from a lower mass and smaller size into the same bin. Observations, and the results presented here, tell us that these two galaxies of same size at =1 and =0 have a different luminosity: a galaxy at =1 with similar stellar mass and size to a =0 galaxy will be brighter. Note that this is not equivalent to saying that an individual galaxy was brighter in the past. Instead, galaxies at fixed stellar mass were brighter in the past. Because they are the same stellar mass, the brighter =1 galaxy must then be forming more stars.
Two of our galaxies can be compared in this way. Galaxy h603 has a stellar disk mass of 1.281010 M☉ at =0, while h258 has a stellar disk mass of 1.251010 M☉ at =1. The SFR within the last 100Myr for h258 at =1 is 3.1 M☉/yr, while it is 0.6 M☉/yr for h603 at =0. The lower SFR for h603 is due to the fact that it resides in a less massive halo than h258 (see Table 1). Even at =1, h603 had a lower SFR than h258, of 2.1 M☉/yr. This is because these galaxies follow a SFR – stellar mass relation (which also leads to their reproduction of the observed stellar mass – metallicity relation, Brooks et al., 2007).
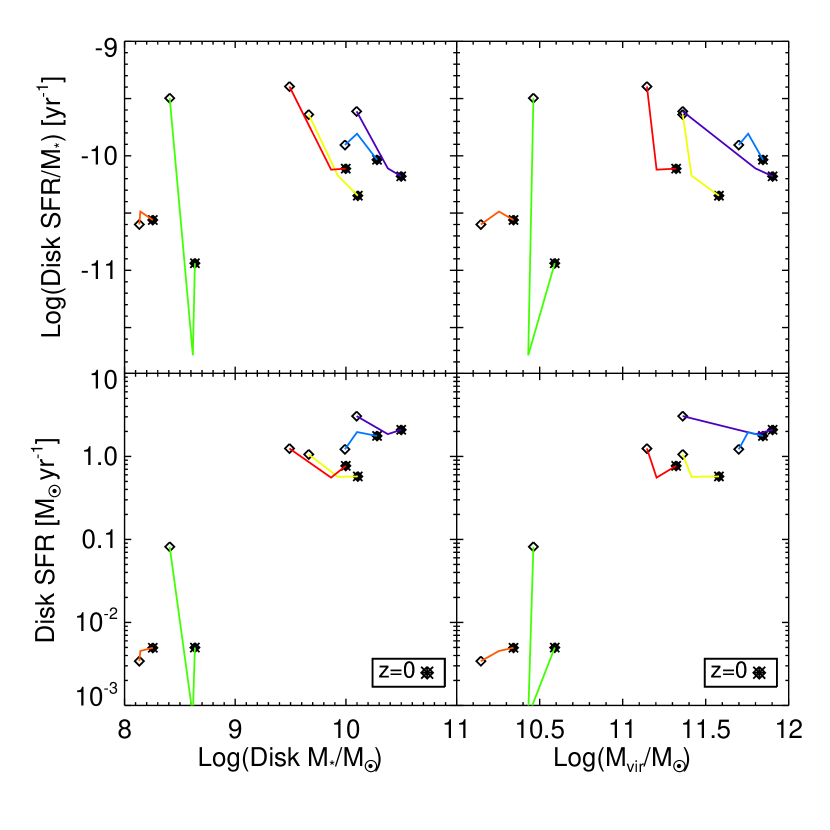
Fig. 10 shows the SFR – stellar mass and specific SFR (sSFR) – stellar mass relations for our simulated disks. The left panels of Fig. 10 shows the sSFR (top) and SFR within the last 100 Myr (bottom) versus stellar disk mass. These left panels confirm the values listed in the paragraph above. The dwarf galaxies are included in this plot for full disclosure, but lie outside of the mass range observable at high , unlike the higher mass galaxies. Two trends among the higher mass galaxies are noteworthy. First, the SFR of any individual galaxy tends to decrease slightly with time, but second, the entire population as a whole can be observed to shift to lower SFRs and sSFRs (Guo & White, 2008; Dutton et al., 2010a; Bouche et al., 2009). The decline in SFR and sSFR in has been observed extensively in populations of galaxies (Gavazzi & Scodeggio, 1996; Boselli et al., 2001; Kauffmann et al., 2003; Brinchmann et al., 2004; Feulner et al., 2005; Erb et al., 2006; Salim et al., 2007; Noeske et al., 2007b, a; Elbaz et al., 2007; Daddi et al., 2007; Schiminovich et al., 2007; Cowie & Barger, 2008; Pannella et al., 2009; Damen et al., 2009b, a; Dunne et al., 2009; Rodighiero et al., 2010; Oliver et al., 2010; Mannucci et al., 2010; Lara-López et al., 2010), and is one form of “downsizing” in galaxy evolution.
The right panels of Fig. 10 also show SFR and sSFR for the simulated galaxy disks, but now as a function of total halo mass. This is included to demonstrate that although, e.g., h603 at =0 and h258 at =1 have similar disk stellar masses, this does not correspond to similar virial masses for those redshifts (colors yellow and purple in the figures, respectively). The deeper potential well of the more massive galaxy (h258) leads to a higher SFR.666Note that although these two galaxies appear to have the same virial mass at the initial step, the properties of h258 have actually been measured at =1.25 due to the fact that it is undergoing a merger at =1. Galaxy h258 is 50% more massive than h603 at =1.
In conclusion, attempting to compare galaxies that are a similar stellar mass at =1 and =0 (and by the tight stellar mass – size relation, similar size) leads to inherently comparing galaxies of two different virial masses. This then leads to the observed difference in luminosity for galaxies of a similar size at =1 and =0, caused by the SFR – stellar mass relation, and the corresponding stellar mass – halo mass relation (Guo et al., 2010; Moster et al., 2010b).
5.2. Comparison to Observed Relations
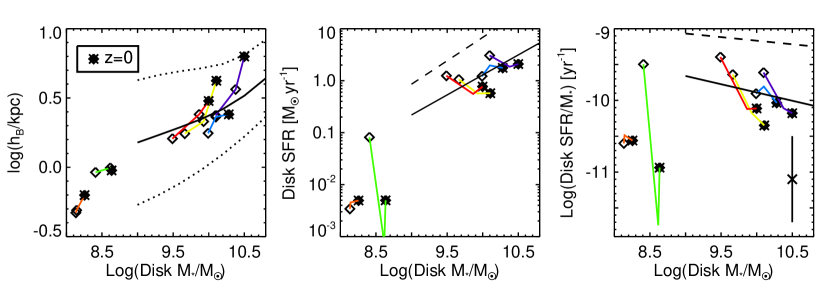
In Fig. 11 we reproduce some of the simulated scaling relations, this time with observed scaling relations directly overplotted for comparison. The left panel of Fig. 11 shows the low redshift relations for SDSS galaxies (solid line, with 2 scatter in dotted lines) from Dutton et al. (2010b). It is worth noting that Dutton et al. (2010b) performed bulge/disk decompositions with the SDSS data, so that the sizes plotted are fits to purely exponential disk scale lengths (converted from the half light radius presented in their paper). Dutton et al. (2010b) also use higher data from the DEEP2 survey to measure the change in size since =0, finding 0.1 dex of size evolution at a fixed mass back to =1. In the mass range of overlap (M∗ 109 M☉), our simulated galaxies are entirely consistent with observed galaxies within the scatter.
The central panel of Fig. 11 reproduces the stellar mass – SFR relation, now with observational data from Elbaz et al. (2007) plotted for =0 (solid line) and =1 (dashed line), corrected from a Salpeter IMF to a Kroupa IMF. At both redshifts, the minimum mass observed is roughly 109 M☉. The right panel shows the same data, but now for the sSFR. The data point with error bars in the lower right corner of the right panel provides an estimate of the typical scatter in the Elbaz et al. (2007) data. While our galaxies are certainly consistent with the data within the scatter, and the general slope at each is consistent with the observations, there is overall a tendency for the simulated galaxies to be more massive than the observations. We believe the discrepancy is in stellar mass rather than SFR, because these simulated galaxies have both =1 and =0 disk SFRs in good agreement with observed galaxies in the same halo mass range (Conroy & Wechsler, 2009; Boissier et al., 2010). We note that the Elbaz et al. (2007) data is for total stellar mass, while our simulated results are for the disk only (bulge excluded). However, including the bulge mass will only exacerbate the discrepancy. For the massive galaxies, the discrepancy is probably due to the fact that these simulations are known to form too many stars (Guo et al., 2010; Moster et al., 2010b).
We can learn something about when this overproduction of stars occurs in the simulations by also examining the stellar mass – sSFR plot (right panel of Fig. 11). While within the observed scatter, is appears that the sSFRs of the simulated disks are consistently lower than observational results at both =1 and =0 (Elbaz et al., 2007; Noeske et al., 2007b; Salim et al., 2007). These plots demonstrate that these simulated galaxies must be forming too many stars at early times, at redshifts higher than plotted here ( 1). Because the SFRs of the galaxies are in good agreement with observed galaxies in the same halo mass range at both =1 and =0 (Conroy & Wechsler, 2009), the fact that the sSFRs are lower than observed values requires that the stellar mass of these disks be too large by =1.
The story is slightly different for the two dwarf disk simulations. These two dwarf galaxies have been published previously in Governato et al. (2010), where it was demonstrated that their properties are a good match to observed dwarf disk galaxies (see also Sánchez-Janssen et al., 2010), including stellar mass (van den Bosch et al., 2001). However, the observed sSFRs of low mass galaxies is on average higher than that of massive galaxies (Salim et al., 2007), indicating that low mass galaxies have been very inefficient in the past at turning gas into stars. Clearly, that is not the case with our two simulated dwarf disk galaxies, which have too low sSFRs compared to most observed dwarf galaxies due to the fact that they form the bulk of their stars prior to =1. Hence, while approximately the correct mass in stars is formed, the star formation is biased toward 1. We have verified that these two simulations, when run with stronger SN feedback, have burstier SF histories with their SF spread out more evenly down to the present time. This leads to approximately the same mass in stars formed by =0, but with a more uniform SF history. This means that the stronger feedback dwarf runs have higher sSFRs than currently presented here, and sSFR values larger than the massive galaxy simulations shown here. Future work will include these new dwarf disks, which show similar stellar masses, rotational velocities, and sizes to those presented in this paper.
Thus, in all of the simulated galaxies the star formation history is biased toward too much star formation at high . By =0, though, the dwarf galaxies have formed approximately the observed amount of stars for their halo mass, while the more massive galaxies have overproduced the total amount of stars. It is suspected that this overproduction of stars in the massive galaxy disks may be the result of the adopted low SF density threshold, which allows for most of the disk to be capable of SF at any given time, unlike the high density threshold which limits SF only to rare density peaks. However, as discussed in Section 2.1, it is currently computationally expensive to generate the more massive galaxies with the force resolution required to resolve high density peaks where SF occurs, and no simulations of sufficiently high resolution are currently available to test this hypothesis. The adopted SF threshold is a compromise that allows stars to form at radii observed in real galaxy disks, and we have demonstrated that it leads to scale lengths in good agreement with observed galaxies. However, we note that even if our massive galaxies are forming too many stars, it is by roughly a factor of 3 at most, and at early times. This means that the more massive galaxies may shift up to 0.5 dex to lower stellar masses in the stellar mass – size plane, but will still grow along the stellar mass – size relation, so that our conclusions are unaffected. Likewise, the band magnitudes we present here are unlikely to be affected, as the bulk of overproduced stars must occur at 1. Since band light is dominated by young stars, and our low SFRs are in good agreement with observed galaxies in the same halo mass range, the magnitude – size relations presented in Figs. 4 and 5 are unlikely to change. Hence, the conclusions presented here about the origin of the evolution in the size – luminosity relation remain valid.
6. Conclusions
For the first time, a sample of very high resolution galaxy disks simulated within a fully cosmological context have been used to determine the evolution of the galaxy disk size – magnitude relation. Unlike previous simulations, we determine disk scale lengths and magnitudes by fitting the stellar light profile rather than decomposing our simulations based on kinematics (and hence mass). We generate artificial surface brightness images using Sunrise (Jonsson, 2006; Jonsson et al., 2010), in order to derive disk properties using methods used by observers. Exponential disk scale lengths were derived using Galfit (Peng et al., 2002) with redshifted, surface brightness dimmed band images at =1 and 0.5, and rest frame band images at =0. This allows for a direct comparison between simulated and observational results in the size – magnitude plane.
Fig. 4 demonstrates that these galaxies overcome past inabilities for cosmological disk simulations to retain angular momentum. Artificial loss of angular momentum is minimized due to high resolution and a physically motivated SN feedback recipe, and hence we produce disks with realistic sizes compared to observed disks. Fig. 5 shows that the sizes are in agreement with observed disk sizes back to =1. This success, and our previous successes in matching the observed stellar mass – metallicity relation with time (Brooks et al., 2007), and the Tully-Fisher relationship (Governato et al., 2009), indicate that these simulated disks reproduce the fundamental scaling relations for disk galaxies. Having established this, we can now use these simulated disks to investigate and interpret observational findings.
We use the simulated disk properties to investigate the evolution in the magnitude – size relation with time. Observations have generally concluded that there has been 1 to 1.5 magnitudes of surface brightness dimming since =1 (Schade et al., 1996; Roche et al., 1998; Lilly et al., 1998; Bouwens & Silk, 2002; Ravindranath et al., 2004; Trujillo & Pohlen, 2005; Barden et al., 2005; Melbourne et al., 2007; Kanwar et al., 2008). We find similar evolution for our galaxies (see Fig. 6). Combined with a lack of evidence for an evolving size function for galaxy disks (Lilly et al., 1998; Ravindranath et al., 2004; Kanwar et al., 2008), and little to no growth in galaxy disks sizes back to =1 (Barden et al., 2005; Trujillo & Pohlen, 2005), the observed surface brightness evolution can only be interpreted as an upper limit to luminosity evolution if there has been no change in galaxy disk sizes.
We have shown that we 1) are in good agreement with the observed magnitude – size relation with time and the evolution in surface brightness, but 2) a number of the simulated disks are clearly undergoing a large change in size (Figs. 7 and 8). Our ability to follow individual galaxies with time, unlike the observations, allows us to interpret the evolution in the magnitude – size plane. We find that the evolution is dependent on mass, with our massive galaxies undergoing larger changes in size than magnitude.
Our dwarf galaxies undergo the least change in size, though there is no immediate theoretical expectation that this should be the case. Recent results (Fakhouri et al., 2010) show that the rate of growth of halos has little dependence on mass, and thus low mass galaxies should grow just as much in size as their more massive counterparts. We conclude that a larger sample is needed to study if low mass galaxies truly grow less than more massive galaxies. On the other hand, the evolution in magnitude for dwarf disk galaxies is dependent on their bursty SF history, but an individual dwarf can undergo significant dimming of at least 2 magnitudes. A dichotomy of evolution with mass has been seen in observations, with low mass galaxies exhibiting significantly more dimming since =1 than more massive galaxies (e.g., Melbourne et al., 2007; Kanwar et al., 2008).
The halo properties for these galaxies () predict a scale length that is generally shorter than the scale lengths derived from the simulated light profiles. Fig. 3 demonstrates that the light and mass distributions yield scale lengths in good agreement, so the discrepancy between predicted for NFW halos and from our light profiles cannot be due to a discrepancy between light and mass profiles. Rather, using , the spin of the gas in the halo, brings the predicted and measured scale lengths into decent agreement. Thus, the angular momentum distribution of the gas from which the stars are forming has been modified from that of the dark matter (see also Sharma & Steinmetz, 2005; Chen et al., 2003). Roškar et al. (2010) have demonstrated that accreted gas is torqued by the hot halo after entering the virial radius, potentially preventing counter-rotating and low angular momentum gas from reaching the disk. A full examination of how this process occurs is beyond the scope of this paper and left for future work.
Having determined that these galaxies are growing in size with time, we can investigate this growth in stellar mass. Like previous theoretical models (Brook et al., 2006; Somerville et al., 2008; Firmani & Avila-Reese, 2009; Dutton et al., 2010b), we find that these galaxies grow in such a way as to stay along approximately the same stellar mass – size relation with time. Hence, at a fixed stellar mass, there is little change back to =1 in the size of galaxies.
Due to the fact that our larger galaxies have grown since =1, we do not have the ability to directly compare results at a fixed size. In particular, we do not have a population of simulated disks at =1 with scale length greater than 3 kpc, though these larger disks do exist observationally. Presumably we might generate these larger disks if we simulate higher mass halos. However, it is not clear from this study how these larger disks would evolve to =0. Observationally, the number density of disk galaxies shows no evidence for change back to =1 (Lilly et al., 1998; Ravindranath et al., 2004; Sargent et al., 2007; Kanwar et al., 2008). In conjunction with the apparent lack of evolution in the size function of disks, this fact has been interpreted to mean that either galaxies are done growing by =1, or that the rate of destruction of galaxies at given size must be equally matched by the rate of growth of galaxies into that size. The fact that our galaxies are growing, while still matching the size-magnitude evolution, suggests that galaxies are moving into and out of a given bin in size during this time interval. It is beyond the scope of this work to answer what happens to these larger galaxies, though we may speculate. There are two possibilities that arise due to mergers; perhaps the larger disks undergo mergers and become early type galaxies (Bell et al., 2007), or perhaps mergers cause them to become bulge dominated disks. As the majority of size-magnitude evolution studies have focused on pure disks or disks with small bulges, this would remove them from the sample being considered (Sargent et al., 2007).
Finally, we demonstrate that the simulated galaxy disks follow SFR – mass and sSFR – mass relations similar to observations. While the growth of dark matter halos is nearly self-similar with mass, observations demonstrate that some process must break this self-similarity in the baryons (e.g., Benson et al., 2003; Conroy & Wechsler, 2009; Schaye et al., 2010). In the mass range of galaxy halos presented here, SN feedback is the process that regulates SF as a function of halo mass, and likely drives gas outflows that vary as a function of mass (though outflow rates are left for future work). The regulation of SF as a function of mass leads to the reproduction of the observed stellar mass – metallicity relationship (Brooks et al., 2007), and the SFR – mass relation shown here that is responsible for the reproduction of the size – luminosity relation back to =1. A galaxy at a fixed M∗ at =1 will have a higher SFR than a =0 counterpart, and thus a higher luminosity as well. In conjunction with the weak evolution of the stellar mass – size relation, this tells us that the difference in luminosity observed at a fixed size between =1 and =0 is due to the fact that the =1 galaxy has a higher SFR and luminosity.
References
- Abadi et al. (2003) Abadi, M. G., Navarro, J. F., Steinmetz, M., & Eke, V. R. 2003, ApJ, 597, 21
- Barden et al. (2005) Barden, M. et al. 2005, ApJ, 635, 959
- Barnes & Efstathiou (1987) Barnes, J., & Efstathiou, G. 1987, ApJ, 319, 575
- Bell et al. (2007) Bell, E. F., Zheng, X. Z., Papovich, C., Borch, A., Wolf, C., & Meisenheimer, K. 2007, ApJ, 663, 834
- Benson et al. (2003) Benson, A. J., Bower, R. G., Frenk, C. S., Lacey, C. G., Baugh, C. M., & Cole, S. 2003, ApJ, 599, 38
- Blanton & Roweis (2007) Blanton, M. R., & Roweis, S. 2007, AJ, 133, 734
- Boissier et al. (2010) Boissier, S., Buat, V., & Ilbert, O. 2010, ArXiv e-prints
- Booth et al. (2007) Booth, C. M., Theuns, T., & Okamoto, T. 2007, MNRAS, 376, 1588
- Boselli et al. (2001) Boselli, A., Gavazzi, G., Donas, J., & Scodeggio, M. 2001, AJ, 121, 753
- Bouche et al. (2009) Bouche, N. et al. 2009, ArXiv e-prints
- Bouwens & Silk (2002) Bouwens, R., & Silk, J. 2002, ApJ, 568, 522
- Brinchmann et al. (2004) Brinchmann, J., Charlot, S., White, S. D. M., Tremonti, C., Kauffmann, G., Heckman, T., & Brinkmann, J. 2004, MNRAS, 351, 1151
- Brook et al. (2006) Brook, C. B., Kawata, D., Martel, H., Gibson, B. K., & Bailin, J. 2006, ApJ, 639, 126
- Brooks (2010) Brooks, A. 2010, ArXiv e-prints, 1003.3882
- Brooks et al. (2007) Brooks, A. M., Governato, F., Booth, C. M., Willman, B., Gardner, J. P., Wadsley, J., Stinson, G., & Quinn, T. 2007, ApJ, 655, L17
- Brooks et al. (2009) Brooks, A. M., Governato, F., Quinn, T., Brook, C. B., & Wadsley, J. 2009, ApJ, 694, 396
- Bullock et al. (2001) Bullock, J. S., Dekel, A., Kolatt, T. S., Kravtsov, A. V., Klypin, A. A., Porciani, C., & Primack, J. R. 2001, ApJ, 555, 240
- Calzetti (2001) Calzetti, D. 2001, PASP, 113, 1449
- Ceverino & Klypin (2009) Ceverino, D., & Klypin, A. 2009, ApJ, 695, 292
- Chen et al. (2003) Chen, D. N., Jing, Y. P., & Yoshikaw, K. 2003, ApJ, 597, 35
- Conroy & Wechsler (2009) Conroy, C., & Wechsler, R. H. 2009, ApJ, 696, 620
- Courteau et al. (2007) Courteau, S., Dutton, A. A., van den Bosch, F. C., MacArthur, L. A., Dekel, A., McIntosh, D. H., & Dale, D. A. 2007, ApJ, 671, 203
- Cowie & Barger (2008) Cowie, L. L., & Barger, A. J. 2008, ApJ, 686, 72
- Daddi et al. (2007) Daddi, E. et al. 2007, ApJ, 670, 156
- Damen et al. (2009a) Damen, M., Förster Schreiber, N. M., Franx, M., Labbé, I., Toft, S., van Dokkum, P. G., & Wuyts, S. 2009a, ApJ, 705, 617
- Damen et al. (2009b) Damen, M., Labbé, I., Franx, M., van Dokkum, P. G., Taylor, E. N., & Gawiser, E. J. 2009b, ApJ, 690, 937
- de Blok et al. (2008) de Blok, W. J. G., Walter, F., Brinks, E., Trachternach, C., Oh, S., & Kennicutt, R. C. 2008, AJ, 136, 2648
- de Jong (1996a) de Jong, R. S. 1996a, A&A, 313, 45
- de Jong (1996b) —. 1996b, A&A, 313, 377
- Dekel & Silk (1986) Dekel, A., & Silk, J. 1986, ApJ, 303, 39
- D’Onghia & Burkert (2004) D’Onghia, E., & Burkert, A. 2004, ApJ, 612, L13
- D’Onghia et al. (2006) D’Onghia, E., Burkert, A., Murante, G., & Khochfar, S. 2006, MNRAS, 372, 1525
- D’Onghia & Navarro (2007) D’Onghia, E., & Navarro, J. F. 2007, MNRAS, 380, L58
- Driver et al. (2008) Driver, S. P., Popescu, C. C., Tuffs, R. J., Graham, A. W., Liske, J., & Baldry, I. 2008, ApJ, 678, L101
- Dunne et al. (2009) Dunne, L. et al. 2009, MNRAS, 394, 3
- Dutton (2009) Dutton, A. A. 2009, MNRAS, 396, 121
- Dutton et al. (2010a) Dutton, A. A., van den Bosch, F. C., & Dekel, A. 2010a, MNRAS, 405, 1690
- Dutton et al. (2010b) Dutton, A. A. et al. 2010b, ArXiv e-prints
- Efstathiou et al. (1982) Efstathiou, G., Lake, G., & Negroponte, J. 1982, MNRAS, 199, 1069
- Eke et al. (2001) Eke, V. R., Navarro, J. F., & Steinmetz, M. 2001, ApJ, 554, 114
- Elbaz et al. (2007) Elbaz, D. et al. 2007, A&A, 468, 33
- Elmegreen et al. (2005) Elmegreen, B. G., Elmegreen, D. M., Vollbach, D. R., Foster, E. R., & Ferguson, T. E. 2005, ApJ, 634, 101
- Elmegreen et al. (2007) Elmegreen, D. M., Elmegreen, B. G., Ravindranath, S., & Coe, D. A. 2007, ApJ, 658, 763
- Erb et al. (2006) Erb, D. K., Shapley, A. E., Pettini, M., Steidel, C. C., Reddy, N. A., & Adelberger, K. L. 2006, ApJ, 644, 813
- Fakhouri et al. (2010) Fakhouri, O., Ma, C., & Boylan-Kolchin, M. 2010, MNRAS, 857
- Fall & Efstathiou (1980) Fall, S. M., & Efstathiou, G. 1980, MNRAS, 193, 189
- Fathi et al. (2010) Fathi, K., Allen, M., Boch, T., Hatziminaoglou, E., & Peletier, R. F. 2010, MNRAS, 822
- Ferguson et al. (2004) Ferguson, H. C. et al. 2004, ApJ, 600, L107
- Feulner et al. (2005) Feulner, G., Goranova, Y., Drory, N., Hopp, U., & Bender, R. 2005, MNRAS, 358, L1
- Firmani & Avila-Reese (2009) Firmani, C., & Avila-Reese, V. 2009, MNRAS, 396, 1675
- Förster Schreiber et al. (2006) Förster Schreiber, N. M. et al. 2006, ApJ, 645, 1062
- Gardner (2001) Gardner, J. P. 2001, ApJ, 557, 616
- Gavazzi & Scodeggio (1996) Gavazzi, G., & Scodeggio, M. 1996, A&A, 312, L29
- Geha et al. (2006) Geha, M., Blanton, M. R., Masjedi, M., & West, A. A. 2006, astro-ph/0608295
- Giavalisco et al. (2004) Giavalisco, M. et al. 2004, ApJ, 600, L93
- Gnedin et al. (2007) Gnedin, O. Y., Weinberg, D. H., Pizagno, J., Prada, F., & Rix, H. 2007, ApJ, 671, 1115
- Governato et al. (2010) Governato, F. et al. 2010, Nature, 463, 203
- Governato et al. (2009) —. 2009, MNRAS, 398, 312
- Governato et al. (2008) Governato, F., Mayer, L., & Brook, C. 2008, ArXiv e-prints, 801
- Governato et al. (2004) Governato, F. et al. 2004, ApJ, 607, 688
- Governato et al. (2007) Governato, F., Willman, B., Mayer, L., Brooks, A., Stinson, G., Valenzuela, O., Wadsley, J., & Quinn, T. 2007, MNRAS, 374, 1479
- Graham & Worley (2008) Graham, A. W., & Worley, C. C. 2008, MNRAS, 388, 1708
- Guo et al. (2010) Guo, Q., White, S., Li, C., & Boylan-Kolchin, M. 2010, MNRAS, 404, 1111
- Guo & White (2008) Guo, Q., & White, S. D. M. 2008, MNRAS, 384, 2
- Haardt & Madau (1996) Haardt, F., & Madau, P. 1996, ApJ, 461, 20
- Harfst et al. (2006) Harfst, S., Theis, C., & Hensler, G. 2006, A&A, 449, 509
- Hetznecker & Burkert (2006) Hetznecker, H., & Burkert, A. 2006, MNRAS, 370, 1905
- Hopkins et al. (2009) Hopkins, P. F., Cox, T. J., Younger, J. D., & Hernquist, L. 2009, ApJ, 691, 1168
- Hultman & Pharasyn (1999) Hultman, J., & Pharasyn, A. 1999, A&A, 347, 769
- Jones et al. (2009) Jones, T., Swinbank, M., Ellis, R., Richard, J., & Stark, D. 2009, ArXiv e-prints
- Jonsson (2006) Jonsson, P. 2006, MNRAS, 372, 2
- Jonsson et al. (2010) Jonsson, P., Groves, B. A., & Cox, T. J. 2010, MNRAS, 403, 17
- Kanwar et al. (2008) Kanwar, A., Simard, L., Schade, D., & Gwyn, S. D. J. 2008, ApJ, 682, 907
- Katz (1992) Katz, N. 1992, ApJ, 391, 502
- Katz et al. (1994) Katz, N., Quinn, T., Bertschinger, E., & Gelb, J. M. 1994, MNRAS, 270, L71+
- Katz & White (1993) Katz, N., & White, S. D. M. 1993, ApJ, 412, 455
- Kauffmann et al. (2003) Kauffmann, G. et al. 2003, MNRAS, 341, 54
- Kaufmann et al. (2007) Kaufmann, T., Mayer, L., Wadsley, J., Stadel, J., & Moore, B. 2007, MNRAS, 375, 53
- Kennicutt et al. (2003) Kennicutt, Jr., R. C. et al. 2003, PASP, 115, 928
- Kereš et al. (2009) Kereš, D., Katz, N., Fardal, M., Davé, R., & Weinberg, D. H. 2009, MNRAS, 395, 160
- Komatsu et al. (2008) Komatsu, E. et al. 2008, ArXiv e-prints, 803
- Komatsu et al. (2010) —. 2010, ArXiv e-prints
- Kroupa et al. (1993) Kroupa, P., Tout, C. A., & Gilmore, G. 1993, MNRAS, 262, 545
- Labbé et al. (2003) Labbé, I. et al. 2003, ApJ, 591, L95
- Lara-López et al. (2010) Lara-López, M. A. et al. 2010, ArXiv e-prints
- Leitherer et al. (1999) Leitherer, C. et al. 1999, ApJS, 123, 3
- Lilly et al. (1998) Lilly, S. et al. 1998, ApJ, 500, 75
- MacArthur et al. (2003) MacArthur, L. A., Courteau, S., & Holtzman, J. A. 2003, ApJ, 582, 689
- MacArthur et al. (2008) MacArthur, L. A., Ellis, R. S., Treu, T., U, V., Bundy, K., & Moran, S. 2008, ApJ, 680, 70
- Maiolino et al. (2008) Maiolino, R. et al. 2008, A&A, 488, 463
- Maller & Dekel (2002) Maller, A. H., & Dekel, A. 2002, MNRAS, 335, 487
- Maller et al. (2002) Maller, A. H., Dekel, A., & Somerville, R. 2002, MNRAS, 329, 423
- Mannucci et al. (2010) Mannucci, F., Cresci, G., Maiolino, R., Marconi, A., & Gnerucci, A. 2010, ArXiv e-prints
- Mao et al. (1998) Mao, S., Mo, H. J., & White, S. D. M. 1998, MNRAS, 297, L71
- Marri & White (2003) Marri, S., & White, S. D. M. 2003, MNRAS, 345, 561
- Mayer et al. (2008) Mayer, L., Governato, F., & Kaufmann, T. 2008, ArXiv e-prints, 801
- McKee & Ostriker (1977) McKee, C. F., & Ostriker, J. P. 1977, ApJ, 218, 148
- Melbourne et al. (2007) Melbourne, J., Phillips, A. C., Harker, J., Novak, G., Koo, D. C., & Faber, S. M. 2007, ApJ, 660, 81
- Mo et al. (1998) Mo, H. J., Mao, S., & White, S. D. M. 1998, MNRAS, 295, 319
- Moster et al. (2010a) Moster, B. P., Macciò, A. V., Somerville, R. S., Johansson, P. H., & Naab, T. 2010a, MNRAS, 403, 1009
- Moster et al. (2010b) Moster, B. P., Somerville, R. S., Maulbetsch, C., van den Bosch, F. C., Macciò, A. V., Naab, T., & Oser, L. 2010b, ApJ, 710, 903
- Naab et al. (2007) Naab, T., Johansson, P. H., Ostriker, J. P., & Efstathiou, G. 2007, ApJ, 658, 710
- Navarro & Benz (1991) Navarro, J. F., & Benz, W. 1991, ApJ, 380, 320
- Navarro & Steinmetz (2000) Navarro, J. F., & Steinmetz, M. 2000, ApJ, 538, 477
- Navarro & White (1994) Navarro, J. F., & White, S. D. M. 1994, MNRAS, 267, 401
- Noeske et al. (2007a) Noeske, K. G. et al. 2007a, ApJ, 660, L47
- Noeske et al. (2007b) —. 2007b, ApJ, 660, L43
- Nordström et al. (2004) Nordström, B. et al. 2004, A&A, 418, 989
- Okamoto et al. (2005) Okamoto, T., Eke, V. R., Frenk, C. S., & Jenkins, A. 2005, MNRAS, 363, 1299
- Oliver et al. (2010) Oliver, S. et al. 2010, MNRAS, 588
- Pannella et al. (2009) Pannella, M. et al. 2009, ApJ, 698, L116
- Peebles (1969) Peebles, P. J. E. 1969, ApJ, 155, 393
- Peirani et al. (2004) Peirani, S., Mohayaee, R., & de Freitas Pacheco, J. A. 2004, MNRAS, 348, 921
- Peng et al. (2002) Peng, C. Y., Ho, L. C., Impey, C. D., & Rix, H. 2002, AJ, 124, 266
- Piontek & Steinmetz (2009) Piontek, F., & Steinmetz, M. 2009, ArXiv e-prints
- Pizagno et al. (2005) Pizagno, J. et al. 2005, ApJ, 633, 844
- Pontzen et al. (2010) Pontzen, A. et al. 2010, MNRAS, 402, 1523
- Pontzen et al. (2008) —. 2008, MNRAS, 390, 1349
- Ravindranath et al. (2004) Ravindranath, S. et al. 2004, ApJ, 604, L9
- Reshetnikov et al. (2003) Reshetnikov, V. P., Dettmar, R., & Combes, F. 2003, A&A, 399, 879
- Rix et al. (2004) Rix, H. et al. 2004, ApJS, 152, 163
- Robertson et al. (2004) Robertson, B., Yoshida, N., Springel, V., & Hernquist, L. 2004, ApJ, 606, 32
- Robertson & Kravtsov (2008) Robertson, B. E., & Kravtsov, A. V. 2008, ApJ, 680, 1083
- Roche et al. (1998) Roche, N., Ratnatunga, K., Griffiths, R. E., Im, M., & Naim, A. 1998, MNRAS, 293, 157
- Rodighiero et al. (2010) Rodighiero, G. et al. 2010, ArXiv e-prints
- Roškar et al. (2010) Roškar, R., Debattista, V. P., Brooks, A. M., Quinn, T. R., Brook, C. B., Governato, F., Dalcanton, J. J., & Wadsley, J. 2010, MNRAS, 408, 783
- Saitoh et al. (2008) Saitoh, T. R., Daisaka, H., Kokubo, E., Makino, J., Okamoto, T., Tomisaka, K., Wada, K., & Yoshida, N. 2008, PASJ, 60, 667
- Sales et al. (2010) Sales, L. V., Navarro, J. F., Schaye, J., Dalla Vecchia, C., Springel, V., & Booth, C. M. 2010, ArXiv e-prints
- Sales et al. (2009) Sales, L. V., Navarro, J. F., Schaye, J., Dalla Vecchia, C., Springel, V., Haas, M. R., & Helmi, A. 2009, MNRAS, 399, L64
- Salim et al. (2007) Salim, S. et al. 2007, ApJS, 173, 267
- Sánchez-Janssen et al. (2010) Sánchez-Janssen, R., Méndez-Abreu, J., & Aguerri, J. A. L. 2010, MNRAS, 406, L65
- Sargent et al. (2007) Sargent, M. T. et al. 2007, ApJS, 172, 434
- Scannapieco et al. (2010) Scannapieco, C., Gadotti, D. A., Jonsson, P., & White, S. D. M. 2010, MNRAS, L99+
- Scannapieco et al. (2006) Scannapieco, C., Tissera, P. B., White, S. D. M., & Springel, V. 2006, MNRAS, 371, 1125
- Scannapieco et al. (2008) —. 2008, MNRAS, 389, 1137
- Scannapieco et al. (2009) Scannapieco, C., White, S. D. M., Springel, V., & Tissera, P. B. 2009, MNRAS, 396, 696
- Schade et al. (1996) Schade, D., Carlberg, R. G., Yee, H. K. C., Lopez-Cruz, O., & Ellingson, E. 1996, ApJ, 465, L103+
- Schaye et al. (2010) Schaye, J. et al. 2010, MNRAS, 402, 1536
- Schiminovich et al. (2007) Schiminovich, D. et al. 2007, ApJS, 173, 315
- Schombert (2006) Schombert, J. M. 2006, AJ, 131, 296
- Scoville et al. (2007) Scoville, N. et al. 2007, ApJS, 172, 1
- Shapiro et al. (2008) Shapiro, K. L. et al. 2008, ApJ, 682, 231
- Sharma & Steinmetz (2005) Sharma, S., & Steinmetz, M. 2005, ApJ, 628, 21
- Shen et al. (2003) Shen, S., Mo, H. J., White, S. D. M., Blanton, M. R., Kauffmann, G., Voges, W., Brinkmann, J., & Csabai, I. 2003, MNRAS, 343, 978
- Simard et al. (1999) Simard, L. et al. 1999, ApJ, 519, 563
- Somerville et al. (2008) Somerville, R. S. et al. 2008, ApJ, 672, 776
- Sommer-Larsen et al. (1999) Sommer-Larsen, J., Gelato, S., & Vedel, H. 1999, ApJ, 519, 501
- Sommer-Larsen et al. (2003) Sommer-Larsen, J., Götz, M., & Portinari, L. 2003, ApJ, 596, 47
- Springel & Hernquist (2003) Springel, V., & Hernquist, L. 2003, MNRAS, 339, 289
- Stadel (2001) Stadel, J. G. 2001, PhD thesis, AA(UNIVERSITY OF WASHINGTON)
- Stark et al. (2008) Stark, D. P., Swinbank, A. M., Ellis, R. S., Dye, S., Smail, I. R., & Richard, J. 2008, Nature, 455, 775
- Steinmetz & Navarro (1999) Steinmetz, M., & Navarro, J. F. 1999, ApJ, 513, 555
- Steinmetz & White (1997) Steinmetz, M., & White, S. D. M. 1997, MNRAS, 288, 545
- Stinson et al. (2006) Stinson, G., Seth, A., Katz, N., Wadsley, J., Governato, F., & Quinn, T. 2006, MNRAS, 373, 1074
- Tasker & Bryan (2008) Tasker, E. J., & Bryan, G. L. 2008, ApJ, 673, 810
- Thacker & Couchman (2000) Thacker, R. J., & Couchman, H. M. P. 2000, ApJ, 545, 728
- Thacker & Couchman (2001) —. 2001, ApJ, 555, L17
- Trujillo & Aguerri (2004) Trujillo, I., & Aguerri, J. A. L. 2004, MNRAS, 355, 82
- Trujillo et al. (2006) Trujillo, I. et al. 2006, ApJ, 650, 18
- Trujillo & Pohlen (2005) Trujillo, I., & Pohlen, M. 2005, ApJ, 630, L17
- van den Bosch (1998) van den Bosch, F. C. 1998, ApJ, 507, 601
- van den Bosch et al. (2002) van den Bosch, F. C., Abel, T., Croft, R. A. C., Hernquist, L., & White, S. D. M. 2002, ApJ, 576, 21
- van den Bosch et al. (2003) van den Bosch, F. C., Abel, T., & Hernquist, L. 2003, MNRAS, 346, 177
- van den Bosch et al. (2001) van den Bosch, F. C., Burkert, A., & Swaters, R. A. 2001, MNRAS, 326, 1205
- van Zee (2000) van Zee, L. 2000, AJ, 119, 2757
- Vázquez & Leitherer (2005) Vázquez, G. A., & Leitherer, C. 2005, ApJ, 621, 695
- Vitvitska et al. (2002) Vitvitska, M., Klypin, A. A., Kravtsov, A. V., Wechsler, R. H., Primack, J. R., & Bullock, J. S. 2002, ApJ, 581, 799
- Vogt et al. (1996) Vogt, N. P., Forbes, D. A., Phillips, A. C., Gronwall, C., Faber, S. M., Illingworth, G. D., & Koo, D. C. 1996, ApJ, 465, L15+
- Wadsley et al. (2004) Wadsley, J. W., Stadel, J., & Quinn, T. 2004, New Astronomy, 9, 137
- White (1984) White, S. D. M. 1984, ApJ, 286, 38
- White & Rees (1978) White, S. D. M., & Rees, M. J. 1978, MNRAS, 183, 341
- Wright et al. (2009) Wright, S. A., Larkin, J. E., Law, D. R., Steidel, C. C., Shapley, A. E., & Erb, D. K. 2009, ApJ, 699, 421
- York et al. (2000) York, D. G. et al. 2000, AJ, 120, 1579
- Zavala et al. (2008) Zavala, J., Okamoto, T., & Frenk, C. S. 2008, MNRAS, 387, 364