Identification of H2CCC as a diffuse interstellar band carrier
Abstract
We present strong evidence that the broad, diffuse interstellar bands (DIBs) at 4881 and 5450 Å are caused by the B1 A1 transition of H2CCC (-C3H2). The large widths of the bands are due to the short lifetime of the B1 electronic state. The bands are predicted from absorption measurements in a neon matrix and observed by cavity ring-down in the gas phase and show exact matches to the profiles and wavelengths of the two broad DIBs. The strength of the 5450 Å DIB leads to a -C3H2 column density of 51014 cm-2 towards HD 183143 and 21014 cm-2 to HD 206267. Despite similar values of (), the 4881 and 5450 Å DIBs in HD 204827 are less than one third their strength in HD 183143, while the column density of interstellar C3 is unusually high for HD 204827 but undetectable for HD 183143. This can be understood if C3 has been depleted by hydrogenation to species such as -C3H2 towards HD 183143. There are also three rotationally resolved sets of triplets of -C3H2 in the 61506330 Å region. Simulations, based on the derived spectroscopic constants and convolved with the expected instrumental and interstellar line broadening, show credible coincidences with sharp, weak DIBs for the two observable sets of triplets. The region of the third set is too obscured by the -band of telluric O2.
1 Introduction
Diffuse absorption features were first noted in the spectra of ‘red’ B stars some 90 years ago, but only recognized as arising from the interstellar medium in the 1930s. Initially, broad bands some tens of Å wide were identified, but with improved instrumentation many hundreds were subsequently found—mostly in the yellow/red with each being only a few Å wide. Although the strength of the diffuse interstellar bands (DIBs) is correlated roughly with colour excess, none shows the characteristics expected for absorption within the dust grains themselves. Rather, they are presumed to arise from gaseous molecules. Their characteristics have been summarised (Snow & McCall, 2006). Several hypotheses have been put forward for their origin; most prominent being carbon chains and polycyclic hydrocarbon cations (Herbig, 2000). Advances in laboratory techniques over the last decade have enabled the measurement of a number of such electronic spectra in the gas phase. These include some bare carbon chains (Maier et al., 2004), those containing one hydrogen, nitrogen and their ions (Motylewski et al., 2000), and a few aromatic cations (Biennier et al., 2003). Individual coincidences of three very weak DIBs with the gas-phase absorptions of naphthalene cation (Iglesias-Groth et al., 2008) and, recently, for one band of diacetylene cation (Krełowski et al., 2010) have been reported.
A number of di- and triatomics are known to be present in the diffuse clouds: CH, CH+, CN as well as H and C3 (see Snow & McCall, 2006 for references therein). In addition, mm-wave observations indicate the presence of more complex carbon containing molecules, e.g. -C3H2 (Cox et al., 1988), C4H (Liszt & Lucas, 2000).
Recently, a match between a broad DIB, at 5450 Å with 10 Å FWHM, and the absorption of an unknown species produced in a plasma discharge of acetylene was reported (Linnartz et al., 2010). The available experimental data pointed to a molecule containing only carbon and hydrogen. Here, we present evidence that the molecule responsible is propadienylidene, H2CCC—linear three carbon atoms with two hydrogens off-axis on the terminal carbon; henceforth and usually designated as -C3H2. The molecule has two other broad absorption bands at around 4890 and 5170 Å, close to known DIBs, as well as rotationally resolved bands at wavelengths above 6000 Å. Narrow DIBs of the expected strength are also found at the positions of two of the triplet systems predicted to be centred near 6159 and 6252 Å. The spectral region for the third system, weaker than the other two, is too confused by strong telluric oxygen features. All of this is evidence for an identification for a carrier molecule which gives rise to a series of DIBs.
The recognition that the broad band seen in the lab which coincided with the 5450 Å DIB was due to absorption by -C3H2 became evident from a number of previous studies, followed by the ones reported here. In its electronic ground state A1, -C3H2 (C2v symmetry) has been well characterized by mm-wave spectroscopy in the laboratory (Vrtilek et al., 1990) and identified by this signature in dense interstellar clouds (Cernicharo et al., 1991), and in the diffuse medium (Cernicharo et al., 1999). It is an isomer of the ubiquitous cyclic C3H2 (Madden et al., 1989). The electronic absorption spectrum of -C3H2 was first observed in a neon matrix at 6 K (Hodges et al., 2000). In the visible region it shows two electronic systems; a weak dipole forbidden A2 A1 transition which becomes partly allowed by vibronic effects with the near lying B1 electronic state. Then it shows an intense B1 A1 transition in the 40005500 Å range. The spectrum has now been re-recorded following mass-selected deposition of C3H cations followed by neutralization; the earlier measured spectrum was obtained by photolysis of a chemical precursor in the matrix. The spectra are by and large identical, except that the present recording (Fig. 1) shows better resolution of the bands and there are wavelength errors for some of the reported absorptions. Due to matrix-gas shifts, a direct comparison with DIB data is inconclusive.
Thus a goal a number of years ago was to observe the B1 A1 system of -C3H2 in the gas phase. Three techniques were employed: absorption measurements in a supersonic jet expansion through which a discharge runs and detection with cavity ring-down (CRD) either with pulsed- or continuous lasers, as well as resonance enhanced multi-photon ionisation. The experiments were unsuccessful (Achkasova et al., 2006), from which it was concluded that the B1 excited electronic state has a lifetime less than a picosecond, causing individual line broadening of over 10 cm-1. However, at the same time, three rotationally resolved bands lying in the 60006600 Å region were observed (Achkasova et al., 2006; Birza et al., 2005). In the latter two articles, the rotational analyses proved that these belong to -C3H2, corresponding to transitions from the =0 level of the ground A1 state to vibronic levels in the A2 state, lying near the origin of the B1 electronic state. The bands in the dipole forbidden A2 A1 transition gain intensity by vibronic mixing with the B1 levels. The rotational analysis is unambiguous. These bands, lying around 6159, 6252 and 6319 Å in the gas phase show a complex structure characteristic of an asymmetric top.
2 Laboratory Observations
2.1 Techniques
The two laboratory techniques used were absorption measurements in a neon matrix and CRD in the gas phase. For the former C3H was produced from allene in an electron impact ion source. The mass-selected /=38 ions were then co-deposited with excess of neon onto a sapphire surface at 6 K to form the matrix (Freivogel et al., 1994). This took a few hours using nA ion currents to produce a matrix of 150 m thickness, spread over a few cm2. The ions were subsequently neutralized by UV irradiation of the matrix, releasing electrons from the counter ions present. The absorption spectra were measured by passing light through the thin side of the matrix over a path length of 2 cm, dispersion of the transmitted light by a grating and detection with a CCD camera. Another absorption spectrum was obtained using allene as precursor in the matrix followed by xenon lamp VUV (1470 Å) photolysis. The mass-selected measurements on -C3D2 were achieved with dideutero-acetylene in the ion source.
In the gas phase -C3H2 was produced in a supersonic free-jet expansion discharge. As precursor, 0.51 allene in argon, or acetylene and diacetylene in helium, was used. The CRD set up is as described (Linnartz et al., 1998). The discharge was operated at 10 Hz while the laser was fired every 20 Hz. The CRD signal, which is not background-free, could then be corrected for baseline. It was found that the strongest signals were observed with allene, but at the same time the vibrational and rotational temperatures attained were a bit higher than with diacetylene. Furthermore, allene produced other species causing broad absorptions in the range of interest (e.g. -C3H). Dideutero-acetylene in helium was used in the discharge expansion for the measurements on -C3D2.
2.2 Laboratory Results
We focused on whether the 5450 Å absorption band coinciding with the DIB at this wavelength (Linnartz et al., 2010) could be the B1 A1 transition of -C3H2, i.e. corresponding to the most intense band in the 6 K neon matrix spectrum at 5417 Å (Fig. 1). The middle trace was obtained using C3H mass selection followed by neutralization. That this is the absorption of linear C3H2 has been proven (Hodges et al., 2000). Our spectrum is the same, but with a better resolution; for example the site-structured bands show two components and the correct calibration of the 5445/5417 Å band is given in Table 1. The spectrum below 4700 Å is not shown, because overlapping bands are present there due to -C3H (Ding et al., 2001), produced as a result of H loss during the deposition of C3H.
The top trace is the spectrum obtained via a traditional matrix approach: allene was embedded in neon and following photolysis using a low-pressure xenon lamp the system appears. This spectrum is identical to the one published (Hodges et al., 2000), though produced by a different chemical scheme and irradiation. It is included because the intensity ratio of the respective bands is more reliable than in the mass-selected spectrum where the absorption involves much smaller concentrations and thus background correction is not so reliable. The doublet at 5445/5417 Å is not resolved but is indicated from the asymmetry of the band. The structure of the 5417 Å band is due to matrix site effect, because the same asymmetric pattern is seen for the other bands (5143, 4856 and 4633 Å).
Bottom trace in Fig. 1 shows the spectrum measured after deposition and neutralization of C3D ions into a neon matrix. The site structure is not present for the prominent band at 5412 Å; such an effect is often seen on isotopic substitution in matrices. The band at 5412 Å is shifted by 17 cm-1 towards higher energy in comparison to the 5417 Å band of -C3H2.
The assignment of the bands to vibrational excitation in the upper electronic state of -C3H2 is established (Hodges et al., 2000). All the transitions originate from the =0 level of the A1 ground state because the temperature of the neon matrix is 6 K. The strongest 5417 Å band corresponds to the excitation of the totally symmetric (C=C stretching) mode in the B1 state (2 transition). Other strong bands in the spectrum of C3H2 are due to its overtone (2 at 4856 Å) and combination with the mode (2 4 at 5143 Å) as indicated in Fig. 1. The origin band of the B1 A1 transition is weaker and is influenced by vibronic interaction of B1 with the nearby lying A2 state. It is located somewhere within the group of weak bands above 6000 Å (between a and c in Fig. 1). This has been considered theoretically (Hodges et al., 2000) and also discussed in the analysis of the rotationally resolved spectra in the gas phase in this region (Achkasova et al., 2006).
CRD is a sensitive detection method; however, the lack of mass selection is a drawback. Therefore, the matrix spectra of the mass-selected C3H2 and C3D2 serve for the identification of the bands in the gas-phase CRD experiments. Though the wavelength shift going from neon matrix to the gas phase can be 1050 Å for electronic transitions, the separation of vibrational peaks rarely differ by more than a few Å within one state (Jacox, 1994). Thus, by knowing the wavelength of the 2 transition in the gas phase, the positions of other bands (e.g. 2 or 2 4) can be predicted from the separation of the peaks in the neon spectrum (Fig. 1). However, this procedure cannot be applied for the 2 band of -C3H2 itself because the separation from the origin to the 2 peak is not known.
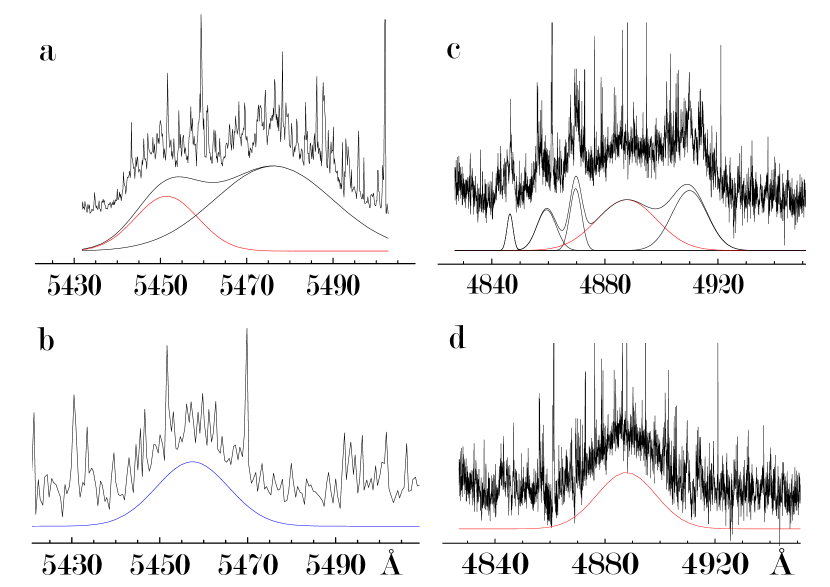
The aim was therefore to detect the gas-phase band of -C3H2 that corresponds to the 2 transition in the neon matrix at 5417 Å. The known rotationally resolved bands of -C3H2 above 6000 Å were first detected using acetylene, diacetylene or allene seeded in argon in the discharge. The strongest signal was observed with allene. The spectrum was then measured in the 542050 Å range as indicated by the 2 absorption in neon. Broad absorptions were detected with all the precursors and under the same discharge conditions as for the rotationally resolved 6000 Å bands of -C3H2. The spectrum obtained with allene precursor is shown in Fig. 2 a. It consists of two broad absorptions, whose relative intensities vary with the precursor proving that they originate from two different molecules. The intensity of the band at lower wavelength (5450 Å) correlates with the identified absorptions of -C3H2 in the range above 6000 Å, but the one around 5480 Å does not.
The absorptions in Fig. 2 a have been deconvoluted using the two Gaussians shown. The central wavelength of the first peak is 5450 Å (FWHM 1317 Å), whereas the other is centered at 54735476 Å (FWHM 3242 Å). The prominent C2 absorption lines have been partially removed from the spectrum by taking a wavelength window of ten points, finding the minimum and then repeating the procedure at the following position of the spectrum. By this means the broad underlying absorption is retained, and fitted by a Gaussian. Fig. 2 a shows the superposition of the two Gaussians and the quality of the fit.
Gas-phase measurements on -C3D2 were also carried out. In the spectral window of interest only one broad band (central wavelength at 5458(3) Å and FWHM 1924 Å) has been detected using dideutero-acetylene as the precursor (Fig. 2 b). The FWHM does not differ much from that of the 5450 Å band. The position of this band is shifted 27 cm-1 to the lower energy relative to the 5450 Å band, similar to the neon matrix change (17 cm-1).
Comparison of the neon matrix spectra of -C3H2 and -C3D2 (Fig. 1) with the CRD spectra (Fig. 2) leads to the conclusion that the 5417 Å band in the neon matrix and that at 5450 Å in the gas phase originate from the same molecule, namely -C3H2. Also the fact that the intensity of the band at 5450 Å observed in the gas phase, correlates with the intensity of other, already identified bands of -C3H2 in the range above 6000 Å, substantiates this conclusion.
From the position of the 2 band of -C3H2 in the gas phase (5450 Å) the wavelengths of the 2 and 2 4 transitions in the gas phase can be predicted using the separation of the peaks in the neon spectrum. For this the most intense peaks are taken (5417, 5143 and 4856 Å), because the lowest energy site is not resolved (though its presence is indicated by the asymmetry of the peak). The difference between the 2 and 2 band maxima is 2130 cm-1 and this leads to a gas phase prediction of 4883 Å for the 2 transition; the uncertainty is difficult to guess because of broadening mechanisms in the matrix. The 2 4 band is located 984 cm-1 above the transition in the neon matrix and in the gas phase it is then in the 5173 Å wavelength region.
In the region around 4883 Å predicted for the 2 band, broad absorptions are detected (Fig. 2 c) with narrower components imposed on them. The four bands at 4913, 4870, 4856 and 4844 Å belong to -C3H because they have been identified in earlier mass-selected studies in the gas phase (Ding et al., 2001). After subtraction of the -C3H absorptions (the 4 Gaussians shown in Fig. 2 c) from the laboratory recording, the residual broad band is obtained (Fig. 2 d). The Gaussian fit is centered at 4887(3) Å with FWHM of 25 Å. Its position matches the 4883 Å wavelength predicted from the neon matrix spectrum of -C3H2. The FWHM of this band is somewhat larger than that of the 2 band at 5450 Å probably due to a shorter lifetime in the =2 vibrational state of B1. These arguments, together with the fact that the 5450 and 4887 Å bands were observed under the same experimental conditions as the rotationally resolved transitions of -C3H2 above 6000 Å provide the evidence that these absorptions originate from the -C3H2 molecule.
The detection of the band around 5173 Å, corresponding to the 2 4 transition of -C3H2, was not successful. This is because this transition is a factor of three weaker than 2 and its intensity is below the detection limit of the CRD set-up.
It was already established (Linnartz et al., 2010) that the 5450 Å gas-phase absorption coincides with a DIB at this wavelength. This band is now assigned to the 2 B1 A1 transition of -C3H2. A DIB corresponding to the 2 band in the gas-phase observations is present (see Section 4).
3 Simulation of Band Profiles
3.1 Bands Above 6000 Å
Three systems in the 61506330 Å region have been subject to two earlier high-resolution, gas-phase studies (Achkasova et al., 2006; Birza et al., 2005). The rotational analysis is unambiguous and proves that the absorptions belong to -C3H2.
-C3H2 has a near prolate top structure with symmetry. The rotational constants in the A1 ground state are =9.6451, =0.3533 and =0.3404 cm-1. The =1 =0 and =2 =0 separations are 10 and 40 cm-1 respectively. Thus at very low temperatures only the =0,1 levels are populated. According to the selection rules only transitions with =1 are observed.
In Fig. 3, left, are shown the simulations of the bands of -C3H2 above 6000 Å, using the derived spectroscopic constants and a Lorentzian profile of 0.15 Å width, corresponding to the resolving power 40,000 used in astronomical measurements, for each individual line. The pattern is shown for temperatures of 5, 20 and 60 K. Three components, =21, =10 and =01 would be observed. At 5 K the population becomes concentrated in the =0 level of the A1 electronic ground state and thus the middle peak dominates. As the temperature rises the outer two peaks gain intensity because the population of the =1 level increases.
Though the resolving power in many astronomical measurements is around 40,000, observations such as toward HD 206267 sample several clouds as the profiles of K and Ca lines show (Pan et al., 2004) and this leads to broadenings of 1020 km s-1, i.e. 0.20.4 Å in this wavelength region. Thus the absorption pattern of -C3H2 in such clouds would look like that shown in Fig. 3, right, where a 0.4 Å width (Lorentzian) is used in the simulation.
3.2 5450 Å Band
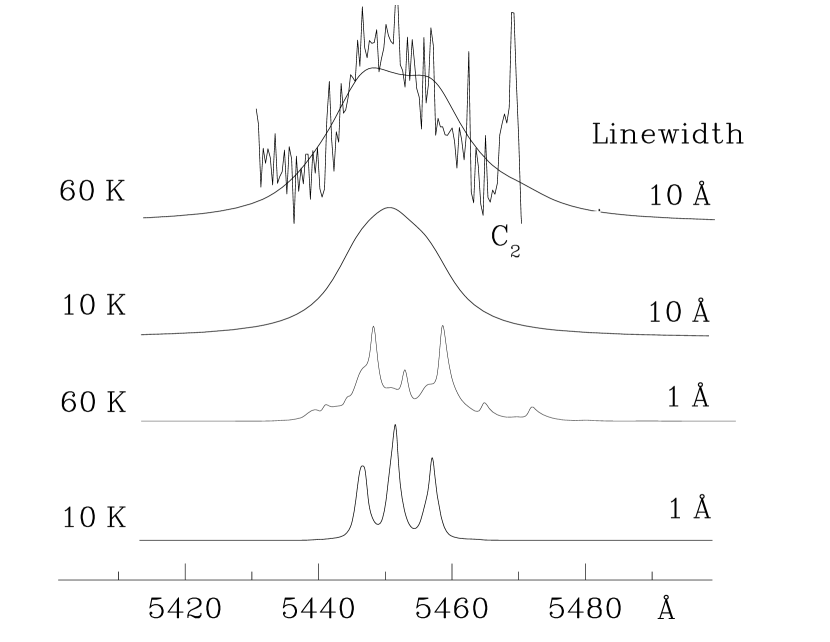
The 5450 and 4887 Å absorption bands of -C3H2 are broad, without any rotational structure. This arises due to the short lifetime of the B1 electronic state as a result of fast intramolecular relaxation process to the nearby lying A2 state. The profiles of the broad 5450 and 4887 Å bands can be predicted by simulating the 2 and 2 B1 A1 transitions with the known rotational constants for the bands above 6000 Å (Achkasova et al., 2006). Due to the broadness of the features, the precise value of the rotational constants has little influence on the overall contour. The bottom trace in Fig. 4 shows the case with a 1 Å linewidth corresponding to 1 ps lifetime and temperature of 10 K. Three components in the profile of this band would still be seen.
The best fit to the observed 5450 Å profile was obtained with a 10 Å linewidth and 60 K temperature (top trace in Fig. 4). The temperature of 60 K is chosen because the rotationally resolved bands of -C3H2 measured above 6000 Å fit to 5070 K. The linewidth of 10 Å corresponds to a 100 fs lifetime, which is often encountered in the excited electronic states of polyatomic molecules subject to conical intersections. In fact in the case of -C3H2 the next higher lying A1 electronic state, with onset near 2500 Å, has been shown experimentally to have a lifetime of 70 fs (Noller et al., 2009), so the inferred value of 100 fs is not unreasonable.
4 Astronomical Observations
4.1 Broad Bands
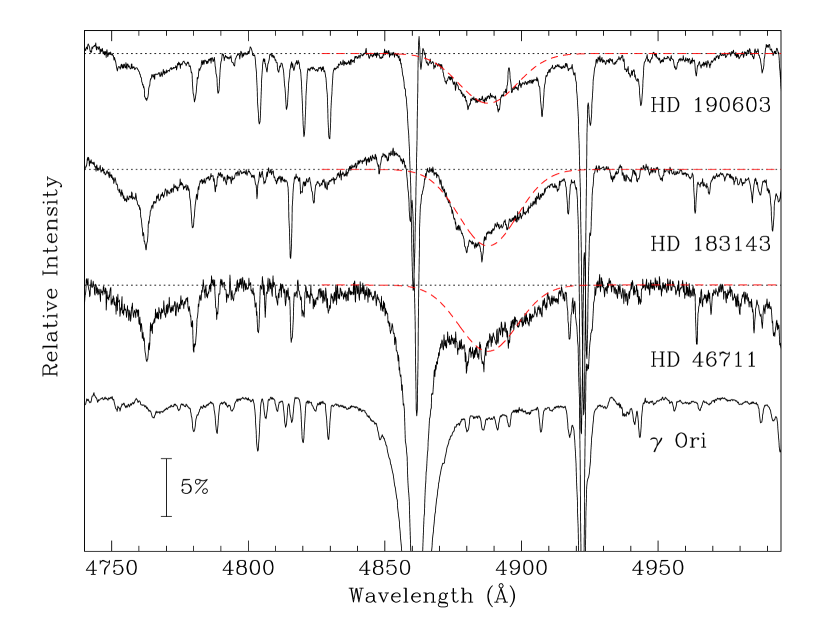
Broad absorptions are observed in the lab at 4887 and 5450 Å in the gas phase and one predicted in the 51655185 Å range but expected to be only one half to one third the strength of the 5450 Å absorption. The absorption spectrum in Fig. 1 is a linear measurement and thus predicts that any corresponding DIBs should have comparable EWs, and FWHM. There is a strong, broad DIB at 4881 Å with twice the FWHM (25Å), but similar central depth to the 5450 Å DIB. It is listed in many DIB compilations (Jenniskens & Désert, 1994; Hobbs et al., 2008; Herbig, 1995) and was recorded anew as part of this study. Unfortunately, stellar H (4861 Å) contaminates its short-wavelength wing.
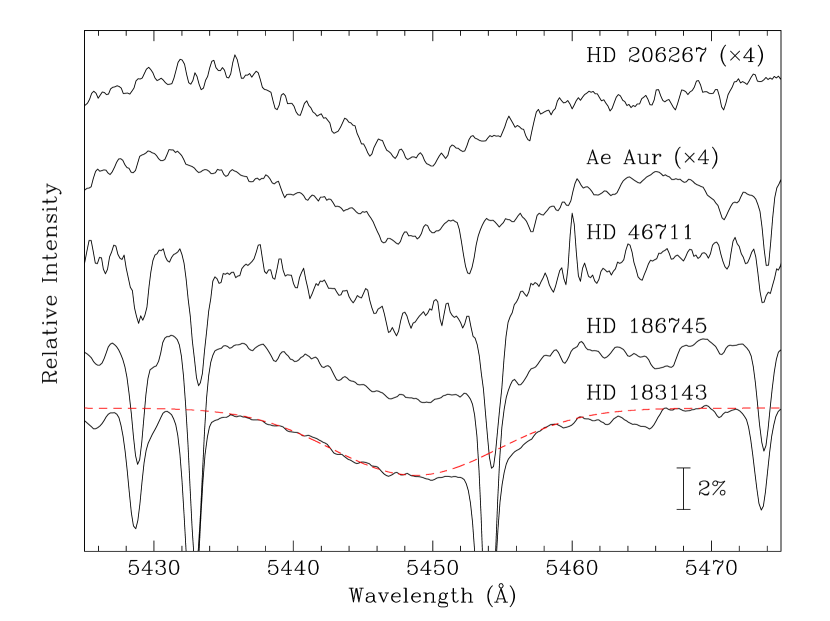
Spectra were acquired in the regions of these DIBs at the Dominion Astrophysical Observatory with the 1.2 and 1.8 m telescopes at a resolution of =18,000 in early 2010. The reddened target stars are listed in Table 2 and the spectra displayed in Figs. 5 and 6 for the 4881 and 5450 Å regions, respectively, together with those of unreddened stars. The spectra for individual stars were aligned to the mean rest wavelength of the interstellar K I line in each case.
The coincidence of the lab and DIB profiles in the case of the 5450 Å band has already been discussed (Linnartz et al., 2010). The Gaussian (25 Å FWHM) obtained from the CRD lab measurement of the 4887 Å absorption (Section 2.2) is superimposed on the DIB spectra in Fig. 5. The agreement is again excellent. The wings of the strong stellar H line at 4861 Å makes that part of the DIB hard to define for HD 46711. For the supergiant, HD 183143, there might also be a broad emission component.
The case for a FWHM20 Å DIB in the 51655185 Å range is complicated by the presence of a previously known, and well defined, broad DIB centred at 5160 Å. Unfortunately, the presence of strong stellar lines near 5173 Å in all of our target stars made it impossible to say anything about an interstellar absorption feature in that region.
4.2 Narrow Triplets Above 6000 Å
The triplets offer quite a different challenge from the broad bands when it comes to unambiguous detection. An exact wavelength match was less critical for the broad bands. There are many fewer broad DIBs known than sharp ones making chance coincidence less likely. Also, the broad DIBs can be matched in width without significant distortion from spectral resolution and blurring by the velocity dispersion in the interstellar clouds. For the 4881 and 5450 Å regions there is little contamination by telluric lines and stellar lines are easily distinguished. By contrast, the spectra of the late-type B giants are full of stellar lines which are hard to distinguish from sharp DIBs. The highest density of sharp DIBs is in the 6000 Å region, one every few Å, which makes the chance of coincidence likely. There are also many telluric lines. It should also be noted that the sharp DIBs of interest have central intensities of 1 %.
As a result of these obstacles, we were restricted to reddened early B or O stars and spectra with a resolution 40,000 and S/N of several thousand per Å. We drew on CFHT archival spectra and others were especially acquired of HD 179406 with the CFHT ESPaDONs spectrograph in June 2010. The stars are listed in Table 3 where ‘Gec’ corresponds to Gecko with a median resolution of 120,000 and ‘Esp’ is ESPaDONs with 80,000. Both are bench spectrographs at the CFHT. It should be emphasized that the archival spectra were optimized for other programs. Low order polynomials have been applied to remove residual undulations in the final spectra.
All of the target stars are seen through multiple interstellar clouds with some differential velocity ranges 10 km s-1 as can be seen in Fig. 7 where the interstellar K I line profiles are plotted and aligned on their strongest components. This alignment was applied to the individual stellar spectra and the corresponding interstellar velocities are listed in Table 3.
Figs. 8 and 9 display the spectra of the reddened stars for two sets of the predicted -C3H2 triplets together with model absorption profiles for 10 K and a 0.15 Å FWHM, the latter to account for instrumental and interstellar broadening. There are clearly DIBs within the limits of the model profiles at 6159, 6166, 6244, 6251 and 6259 Å. The line predicted at 6152 Å was expected to be significantly weaker than those at 6159 and 6166 Å so the absence of a DIB at that wavelength is not necessarily a contradiction. The DIBs at 6244 and 6251 Å appear to be double with the stronger component corresponding quite closely to the predicted absorption maximum. The comparison between the lab and interstellar wavelengths together with the EW of the individual astronomical DIB for each of the target stars are given in Table 4.
For the triplets predicted near 6320 Å, the region is heavily obscured by the telluric -band of O2 which, coupled with velocity corrections to the barycentre and alignment to the interstellar K I velocities, makes it impossible to detect any DIB which might coincide with the predictions.
In none of the coincidences do the predicted profiles correspond well to those of the DIBs, suggesting that the intrinsic broadening is probably greater than the 0.15 Å assumed for the model. While the coincidences between DIBs and the model profiles are not unequivocal given the high density of sharp DIBs in this spectral region, their absence would have cast some doubt on the case -C3H2 as a DIB carrier.
5 Discussion and Conclusions
The choice of a rotational temperature for -C3H2 in diffuse clouds has a consequence for the comparison with the laboratory data, as the simulations in Figs. 3 and 4 show. -C3H2 has a large dipole moment (around 4 D) and may cool efficiently, in much the same way as do the diatomics CH, CH+ and CN, which attain 2.7 K in the diffuse medium. On the other hand, the temperature inferred for other polar polyatomics detected in the diffuse medium are often higher, for example around 50 K for ammonia by mm-wave spectroscopy (Liszt et al., 2006) and H by IR measurements (McCall et al., 2002). Due to the broadness of the 5450 Å DIB the interstellar temperature of -C3H2 can not be clearly determined; anything in the range 1060 K would fit as the two simulated profiles with 10 Å linewidth in Fig. 4 show.
As a follow up to the identification of -C3H2 as a DIB carrier, one can make an estimate for the column density on the basis of the broad 5450 Å DIB. There are two calculations (Mebel et al., 1998) of the overall oscillator strength, , of the B1 A1 electronic transition, 0.016 and 0.009. The former value was obtained with a higher level method and is used for the evaluation.
The value for the 2 transition (5450 Å band) within this system is estimated from the calculation of the FranckCondon factors; these are shown in Fig. 5 of (Mebel et al., 1998). This gives (2)/(=0.016) = 0.2. Using the expression:
yields for =5450 Å, (2)=0.003, EW=0.4 Å towards HD 183143: (-C3H2)51014 cm-2.
Towards HD 183143 the column density of H has been determined to be 1014 cm-2 (McCall et al., 2002) and (C2)1014 cm-2 (Oka et al., 2003). Thus the value estimated for -C3H2 is not unreasonable.
An obvious question is the role of -C3H2. Radioastronomy has established that this cyclic isomer is ubiquitous in dense and diffuse interstellar media. But -C3H2 does not have an allowed electronic transition in the DIB region. Its absorption has been observed in the laboratory, in a neon matrix with onset around 2700 Å (Seburg et al., 1997). Apart from -C3H2, also -C3H has many absorption bands in the DIB region (Ding et al., 2001). Some of the peaks are actually observed in the CRD spectra measured, nearby to the broad bands of -C3H2. However, as has already been pointed out, due to the small oscillator strength of such individual transitions the DIB absorptions would have EW of mÅ or less. Nevertheless, chemically the presence of -C3H in addition to the here proven -C3H2 could be investigated with high S/N DIB measurements because the gas-phase data are available. Another related aspect concerns an earlier discussion on the possible presence of -C3H in the diffuse medium (Guethe et al., 2001). It was pointed out that -C3H formation could be significant via associate electron attachment to -C3H2.
As the 4881 and 5450 Å DIBs correspond to the two broad absorptions of -C3H2, a further aspect has to be considered, namely the estimate of the expected EW for the narrow b, c bands around 6251 Å and 6159 Å with the triplet structure in the DIB observations as discussed in Section 4.2. The matrix absorption spectrum (Fig. 1 and Table 1) indicates from the peak areas that the b band should have 1/10 intensity of the 5450 Å band. The intensity in the gas phase is distributed between the three components (Fig. 3). It has to be decided what is the appropriate rotational temperature. As is seen in Fig. 3, at 5 K the middle peak, =10 component, will be the most intense; at 20 K the outer two (=21 and 01) already become stronger. This will thus influence a comparison of the DIB EW with laboratory data.
The column density of -C3H2, 51014 cm-2—inferred in the previous section, was for the 5450 Å DIB towards HD 183143. For the observation towards HD 206267 (Section 4.1) the EW=0.13 Å is lower and hence (-C3H2)21014 cm-2. We can now use this value to estimate the EW of the 6250 Å band system (Fig. 3). The oscillator strength of b is taken as =0.0003, guessed by comparison with the corresponding absorption bands in the neon matrix. An uncertainty arises because of variation in phonon broadening and site structure (Fig. 1). Then at 6250 Å this leads to an EW of around 10 mÅ. Thus below 5 K only the =10 peak would be seen and have EW of this order of magnitude. At a higher temperature, 1030 K, this would be distributed between the three components =21, =10, =01, each with EW of a few mÅ.
An interesting inference concerns the anti-correlation with C3 abundance in diffuse clouds. From our measurements of the 4881 and 5450 Å DIBs in four stars covering a large range in reddening and supplemented by measurements of HD 204827 from Hobbs et al. (2008), we find that these two DIBs correlate much more closely with each other than with (). This implies a common carrier. Hobbs et al. (2008) specifically observed HD 204827 because of its exceptionally high column density of interstellar C3. They could detect none towards HD 183143. By contrast, from their spectra, the 4881 and 5450 Å DIBs in HD 204827 are less than one third their strength in HD 183143. There is a similar, negative trend between the line of sight abundance of interstellar C3 (Oka et al., 2003) and the strengths of the 4881 and 5450 Å DIBs for the stars in our sample. The inference seems clear, hydrogenation of C3 to species such as -C3H2 leads to depletion of C3 with a consequent enhancement of the 4881 and 5450 Å DIBs. This is in contrast to the family of enhanced DIBs found by Thorburn et al. (2003) for HD 204827 which correlates closely with (C2).
The present study provides laboratory and astronomical evidence for -C3H2 in the diffuse interstellar clouds and its identification as a DIB carrier.
References
- Achkasova et al. (2006) Achkasova, E., Araki, M., Denisov, A. and Maier, J. P. 2006, J. Mol. Spectrosc., 237, 70
- Biennier et al. (2003) Biennier, L., Salama, F., Allamandola, L. J. and Scherer, J. J. 2003, J. Chem. Phys., 118, 7863
- Birza et al. (2005) Birza, P., Chirakolava, A., Araki, M., Kolek, P. and Maier, J. P. 2005, J. Mol. Spectrosc., 229, 276
- Cernicharo et al. (1991) Cernicharo, J., Gottlieb, C. A., Guélin, M., Killian, T. C., Paubert, G., Thaddeus, P. and Vrtilek, J. 1991, ApJ, 368, L39
- Cernicharo et al. (1999) Cernicharo, J., Cox, P., Fossé, D. and Güsten, R. 1999, A&A, 351, 341
- Cox et al. (1988) Cox, P., Güsten, R. and Henkel, C. 1988, A&A, 206, 108
- Ding et al. (2001) Ding, H., Pino, T., Güthe, F. and Maier, J. P. 2001, J. Chem. Phys., 115, 6913
- Freivogel et al. (1994) Freivogel, P., Fulara, J., Lessen, D., Forney, D. and Maier, J. P. 1994, Chem. Phys., 189, 335
- Guethe et al. (2001) Guethe, F., Tulej, M., Pachkov, M. V. and Maier, J. P. 2001, ApJ, 555, 466
- Herbig (1995) Herbig, G. H. 1995, ARA&A, 33, 19
- Herbig (2000) Herbig, G. H. 2000, ApJ, 542, 334 and references therein
- Hobbs et al. (2008) Hobbs, L. M., York, D. G., Snow, T. P., Oka, T., Thorburn, J. A., Bishof, M., Friedman, S. D., McCall, B. J., Rachford, B., Sonnentrucker, P. and Welty, D. E. 2008, ApJ, 680, 1256
- Hodges et al. (2000) Hodges, J. A., McMahon, R. J., Sattelmeyer, K. W. and Stanton, J. F. 2000, ApJ, 544, 838
- Iglesias-Groth et al. (2008) Iglesias-Groth, S., Manchado, A., García-Hernández, D. A., González Hernández, J. I. and Lambert, D. L. 2008, ApJ, 685, L55
- Jacox (1994) Jacox, M. E. 1994, J. Phys. Chem. Ref. Data, 3, 1
- Jenniskens & Désert (1994) Jenniskens, P. and Désert, F.X. 1994, A&AS, 106, 39
- Krełowski et al. (2010) Krełowski, J., Beletsky, Y., Galazutdinov, G. A., Kołos, R., Gronowski, M. and LoCurto, G. 2010, ApJ, 714, L64
- Linnartz et al. (1998) Linnartz, H., Motylewski, T. and Maier, J. P. 1998, J. Chem. Phys., 109, 3819
- Linnartz et al. (2010) Linnartz, H., Wehres, N., Van Winckel, H., Walker, G. A. H., Bohlender, D. A., Tielens, A. G. G. M., Motylewski, T. and Maier, J. P. 2010, A&A, 511, L3
- Liszt & Lucas (2000) Liszt, R. and Lucas, R. 2000, A&A, 358, 1069
- Liszt et al. (2006) Liszt, H. S., Lucas, R. and Pety, J. 2006, A&A, 448, 253
- Madden et al. (1989) Madden, S. C., Irvine, W. M., Mattheus, H. E., Friberg, P. and Swade, D. A. 1989, ApJ, 97, 1403
- Maier et al. (2004) Maier, J. P., Walker, G. A. H. and Bohlender, D. A. 2004, ApJ, 602, 286
- McCall et al. (2002) McCall, B. J., Hinkle, K. H., Geballe, T. R., Moriarty-Chieven, G. H., Evans, N. J., Kawaguchi, K., Tanako, S., Smith, V. V. and Oka, T. 2002, ApJ, 567, 391
- Mebel et al. (1998) Mebel, A. M., Jackson, W. M., Chang, A. H. H. and Lin, S. H. 1998, J. Am. Chem. Soc., 120, 5751
- Motylewski et al. (2000) Motylewski, T., Linnartz, H., Vaizert, O., Maier, J. P., Galazutdinov, G. A., Musaev, F. A., Krełowski, J., Walker, G. A. H. and Bohlender, D. A. 2000, ApJ, 531, 312
- Noller et al. (2009) Noller, B., Margraf, M., Schr ter, C., Schultz, T. and Fischer, I. 2009, Phys. Chem. Chem. Phys., 11, 5353
- Oka et al. (2003) Oka, T., Thorburn, J. A., McCall, B. J., Friedman, S. D., Hobbs, L. M., Sonnentrucker, P., Welty, D. E. and York, D. G. 2003, ApJ, 582, 823
- Pan et al. (2004) Pan, K., Federman, S. R., Cunha, K., Smith, V. V. and Welthy, D. E. 2004, ApJS, 151, 313
- Seburg et al. (1997) Seburg, R. A., Patterson, E. V., Stanton, J. F. and McMahon, R. J. 1997, J. Am. Chem. Soc., 119, 5847
- Snow & McCall (2006) Snow, T. P. and McCall, B. J. 2006, ARA&A, 44, 367
- Thorburn et al. (2003) Thorburn, J. A., Hobbs, L. M., McCall, B. J., Oka, T., Welty, D. E., Friedman, S. D., Snow, T. P., Sonnentrucker, P. and York, D. G. 2003, ApJ, 584, 339
- Vrtilek et al. (1990) Vrtilek, J. M., Gottlieb, C. A., Gottlieb, E. W., Killian, T. C. and Thaddeus, P. A. 1990, ApJ, 364, L53


| Neon Matrix | Gas Phase | Transition | Band | |||||
|---|---|---|---|---|---|---|---|---|
| (-C3H2) | (-C3D2) | (-C3H2) | (-C3D2) | |||||
| 6284 | 0.2 | 6260 | 0.4 | 6318.9 | A2 A1 | a | ||
| 6219 | 0.3 | 6130 | 1.4 | 6251.7 | ′′ | b | ||
| 6122 | 0.9 | 6093 | 1.5 | 6159.2 | ′′ | c | ||
| 5445/541711most intense site | 10 | 5412 | 10 | 5450(3) | 5458(3) | B1 A1 | 2 | |
| 5143 | 3 | 5160 | 3.5 | 5165518522extrapolated values based on neon/gas shifts of the 2 band | ′′ | 2 4 | ||
| 4856 | 9 | 4857 | 12 | 4887(3) | ′′ | 2 | ||
| 4633 | 4.4 | 4645466522extrapolated values based on neon/gas shifts of the 2 band | ′′ | 2 4 | ||||
| 4412 | 4.7 | 4425444522extrapolated values based on neon/gas shifts of the 2 band | ′′ | 2 | ||||
| Star | Sp | () | 4881 | 5450 | |||
|---|---|---|---|---|---|---|---|
| % | EW11based on the measured % central depth and a FWHM of 25 Å | % | EW22based on the measured % central depth and a FWHM of 13 Å | ||||
| HD 46711 | B3 II | 1.05 | 5.7 | 1425 | 3.0 | 390 | |
| 183143 | B7 Ia | 1.28 | 6.6 | 1650 | 3.0 | 390 | |
| 186745 | B8 Ia | 0.78 | 2.6 | 338 | |||
| 190603 | B1.5 Ia+ | 0.70 | 4.3 | 1075 | |||
| AE Aur | O9 V | 0.48 | 0.8 | 104 | |||
| 206267 | O6 | 0.53 | 1.0 | 130 | |||
| Star | Sp | () | IS K I11for strongest component—see Fig. 8 | Spectrograph | |
|---|---|---|---|---|---|
| km s-1 | 6150 | 6250 | |||
| Oph | O9.5 V | 0.30 | 14.53 | Esp22ESPaDONs =80,000 | Gec33Gecko =120,000 |
| HD 179406 | B3 V | 0.27 | 12.53 | Esp | |
| 204827 | B0 V | 1.11 | 17.0 | Esp | Esp |
| 206267 | O6 e | 0.53 | 17.0 | Gec | |
| Source | EW | EW | EW | EW | EW | |||||||
|---|---|---|---|---|---|---|---|---|---|---|---|---|
| lab | 6152.8 | 6159.0 | 6165.8 | 6244.4 | 6251.6 | 6259.0 | ||||||
| HD 179406 | 6244.4 | 2.4 | 6251.0 | 1.6 | 6259.5 | 2.2 | ||||||
| 6245.3 | 1.5 | 6252.5 | 1.0 | |||||||||
| HD 206267 | 6244.5 | 2.3 | 6251.0 | 1.2 | 6259.5 | 1.1 | ||||||
| 6245.3 | 1.5 | 6252.2 | 0.4 | |||||||||
| HD 204827 | 6158.5 | 8.0 | 6165.8 | 3.0 | 6244.6 | 5.0 | 6251.0 | 4.3 | 6259.4 | 3.0 | ||
| 6245.2 | 1.5 | 6252.2 | 2.6 | |||||||||
| Oph | 6158.5 | 1.4 | 6165.8 | 1.6 | 6244.5 | 0.5 | 6251.0 | 0.6 | 6258.4 | 0.2 | ||
| 6245.3 | 0.3 | 6252.2 | 0.3 | 6259.6 | 0.5 |