Upsilon polarization measurement at CDF
Abstract:
Measurements of production cross sections and polarizations are essential inputs for a theoretical understanding of heavy vector meson production. In this article the CDF measurement of the polarization in the kinematic range and [GeV] using a data sample of fb-1 is described. Compared to the CDF Run I measurement, with which it agrees, it extends the covered range, allowing for a better comparison to predictions in the perturbative regime. The observed trend towards longitudinal polarization at high transverse momentum disagrees with predictions based on non-relativistic QCD.
1 Introduction
The understanding of heavy vector meson production at hadron colliders and colliders has evolved in the past several years. While the Color Singlet Model [2], describing the transition for the heavy quark anti-quark pair produced in the hard scattering process to the bound state by the emission of hard gluons, failed to reproduce the cross section measured at the Tevatron [3], the addition of soft gluon emission in the Color Octet Model [4] could solve this issue. The theoretical framework usually applied here is non-relativistic QCD (NRQCD) [5]. It factorizes the quarkonium creation into a hard process to produce the pair, and a long-distance matrix element for the meson formation. As the non-perturbative matrix elements are believed to be universal, they can be measured in experiments and then applied in theoretical predictions.
One of the predictions of NRQCD is that the polarization of heavy vector mesons should be transverse at large transverse momenta. Recent CDF measurements of the polarization [6] disagree with this expectation. A possible explanation for this discrepancy is that the charm quark is too light for perturbative calculations. Fortunately, the Tevatron provides the possibility to test the predicted trend towards transverse polarization for the much heavier states [1].
2 Spin Alignment Measurement
The polarization parameter is defined as where are the cross sections for the production of transverse and longitudinal polarized vector mesons, respectively. Thus the minimal and maximal values of and correspond to full longitudinal and transverse polarization, respectively. A value of indicates unpolarized production.
The measurement of the spin alignment of the vector meson requires the definition of a reference axis. In this measurement the reference axis is defined by the momentum in the lab frame. This definition, called s-channel helicity frame, is used by all polarization measurements at hadron colliders so far.
The polarization parameter can be determined experimentally by measuring the distribution of the decay angle of the positively charged muon from the decay in the rest frame with respect to the reference axis. The angular distribution is given by . Because enters only quadratically, the distribution is symmetric about . This consequence of parity conservation allows to perform the measurement as function of and thus to increase the statistics per bin in the angular distribution.
3 Data Sample
The analyzed data sample corresponds to an integrated luminosity of fb-1 of collisions at a center of mass energy of TeV recorded by the CDF II detector at the Tevatron collider. The events are triggered by a pair of oppositely charged muons with a transverse momentum of GeV. In the offline selection one muon is required in addition to have at least a transverse momentum of 4 GeV. Only muons in the central region of the detector, with a pseudorapidity , are used. Further selection criteria are applied to select well-reconstructed mesons. The kinematic range of mesons studied in this analysis covers the central rapitidy region, , and the transverse momentum range [GeV] .
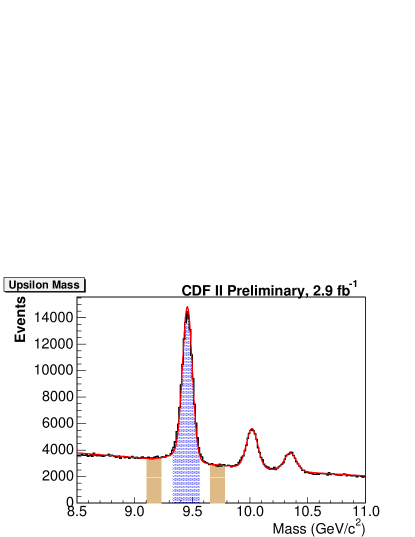
Figure 1 shows the invariant mass spectrum of the selected dimuon pairs together with a fit where the signal shapes are taken from simulation and the background is described by an exponential. A range of around the mass peak center is defined as signal region. The good mass resolution allows to define lower and upper mass sidebands close to the signal for the estimation of background events in the signal region based on the exponential background shape. The selected data sample contains about 80.000 mesons.
4 Analysis Method and Systematic Uncertainties
The same method to determine the polarization as used in Run I [7] and for the Run II polarization measurement [6] is applied here. The data sample is split into bins of and then the distribution in each bin is examined. A fit is performed to the distributions with 10 equidistant bins. The background contributions for all bins are free parameters in the fit and constrained by simultaneously fitting the mass sideband regions. The signal distribution is described by the weighted sum of two templates for transverse (T) and longitudinal (L) polarization. The relative weights of both contributions determine the polarization parameter .
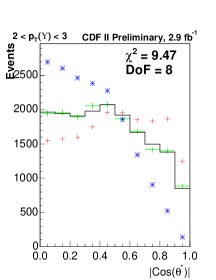
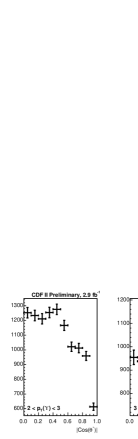
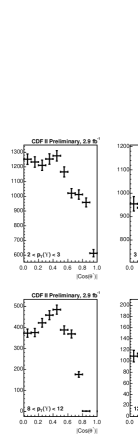
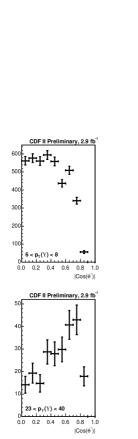
Because the signal templates are affected by acceptance and efficiency effects, they are determined from simulation. Fully-transverse and fully-longitudinal polarized samples were generated with the EvtGen package and simulated and reconstructed with the standard CDF software. Trigger efficiency effects were taken into account by applying efficiencies measured on data to the simulation. Since the acceptance causes the template distributions to be dependent on the transverse momentum of the , the simulated distribution is reweighted in an iterative procedure to match the one observed in data. Figure 2 shows the fit for one bin and the obtained background distributions for low, medium, and high . The background shows a strong dependence on the transverse momentum.
Several systematic effects that could alter the distributions were investigated. The uncertainty on the trigger efficiency measured on data leads to a systematic uncertainty of 0.007 on the polarization parameter. Other systematic uncertainties were found to be negligible. This includes variations of the mass shapes and the signal window definition, a change of the cut, and using an alternative reweighting. Although the chosen bin width is much larger than the resolution in , a check for a systematic effect was performed by using twice the number of bins. No effect beyond expected statistical fluctuations was found. It was also verified that there is no sizable migration between bins. Overall the systematic uncertainties are much smaller than the statistical ones.
5 Result
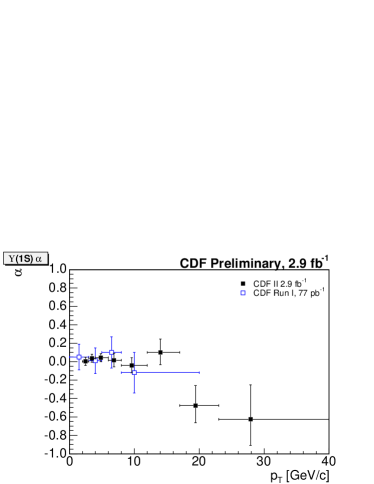
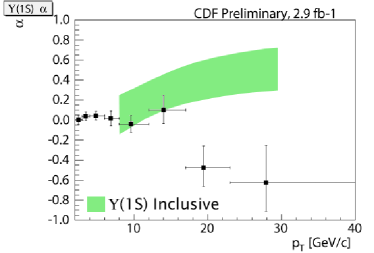
Figure 3 shows the measured polarization as a function of . It is compatible with zero polarization, with a trend towards longitudinal polarization at high . As can be seen in the left plot, the result is consistent with the CDF Run I measurement [7] and considerably extends its momentum range to higher . The right plot in Fig. 3 illustrates that the measurement contradicts the NRQCD prediction of transverse polarization at high .
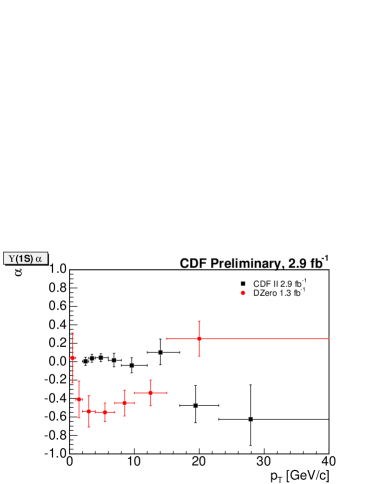
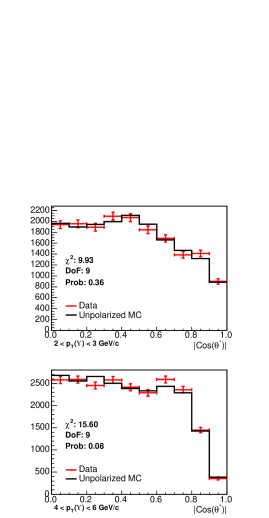
As shown in Fig. 4 the result disagrees with the D0 measurement [9]. Since the D0 measurement indicates a longitudinal polarization at low , the result in this region was cross-checked by comparing the measured distribution with the simulation of unpolarized events. Good agreement is observed as shown exemplarily for one bin in the right plot in Fig. 4, confirming the consistency with zero polarization.
A possible reason for the discrepancy between the CDF and D0 results is that the D0 measurement was performed in a larger kinematic range of . Another difference between both measurements is caused by the different track reconstruction precisions. Due to a worse mass resolution the signal shapes of , , and overlap in the D0 measurement, not allowing to define mass sidebands as close to the signal as in the CDF measurement.
6 Summary and Outlook
The polarization is measured by CDF up to GeV. It is consistent with zero and tends towards longitudinal polarization at high . The result is compatible with the CDF run I result and inconsistent with the D0 result. It also disagrees with NRQCD predictions.
Updated measurements with more data, having data with about three time the integrated luminosity already recorded, can be expected, including polarization measurements of the and . This, together with a separation of direct and feed-down contributions, may help to obtain a better theoretical understanding of heavy meson production.
References
- [1] CDF Collaboration, CDF public note 9966.
- [2] C. H. Chang, Nucl. Phys. B 172 (1980) 425; R. Baier and R. Ruckl, Phys. Lett. B 102 (1981) 364.
- [3] F. Abe et al. [CDF Collaboration], Phys. Rev. Lett. 79 (1997) 572.
- [4] M. 1. Kramer, Prog. Part. Nucl. Phys. 47 (2001) 141.
- [5] G. T. Bodwin, E. Braaten and G. P. Lepage, Phys. Rev. D 51 (1995) 1125 [Erratum-ibid. D 55 (1997) 5853].
- [6] A. Abulencia et al. [CDF Collaboration], Phys. Rev. Lett. 99 (2007) 132001.
- [7] D. E. Acosta et al. [CDF Collaboration], Phys. Rev. Lett. 88 (2002) 161802.
- [8] E. Braaten and J. Lee, Phys. Rev. D 63 (2001) 071501.
- [9] V. M. Abazov et al. [D0 Collaboration], Phys. Rev. Lett. 101 (2008) 182004.