Entropy-driven enhanced self-diffusion in confined reentrant supernematics
Abstract
We present a molecular dynamics study of reentrant nematic phases using the Gay-Berne-Kihara model of a liquid crystal in nanoconfinement. At densities above those characteristic of smectic A phases, reentrant nematic phases form that are characterized by a large value of the nematic order parameter . Along the nematic director these “supernematic” phases exhibit a remarkably high self-diffusivity which exceeds that for ordinary, lower-density nematic phases by an order of magnitude. Enhancement of self-diffusivity is attributed to a decrease of rotational configurational entropy in confinement. Recent developments in the pulsed field gradient NMR technique are shown to provide favorable conditions for an experimental confirmation of our simulations.
pacs:
61.30.Hn,66.10.C–,64.70.M–,61.30.GdIn the context of phase transitions “reentrancy” refers to a nonmonotonic variation of an order parameter with the thermodynamic field driving the transition. Reentrancy is ubiquitous in the physics of thermal many-particle systems. It arises under quite disparate physical conditions encountered, for example, in quantum gases kleinert04 , two-dimensional charged colloids bechinger00 , or relativistic scalar field models pinto05 . As far as soft matter is concerned reentrancy has been reported for self-assembled supramolecular structures osaka07 ; dudowicz09 , wetting phenomena at oleophilic surfaces ramos10 , and novel discotic and calamitic liquid crystals szydlowska08 . In fact, since the first observation of reentrant nematic (RN) phases in a seminal paper by Cladis cladis75 reentrancy in liquid crystals seems to have received most of the attention. This is most likely because of the abundance of phases exhibited by these materials. For example, reentrant phase transitions have been reported for the isotropic phase of mixtures of discotic liquid crystals lee89 , the ferroelectric transition in syn- and anticlinic smectic C phases pociecha01 , the cholesteric-to-blue phase transition in chiral liquid crystals heppke90 , and for nematic (N) phases sigaud81 .
Despite the variety of systems and thermodynamic conditions under which reentrancy in liquid-crystalline materials arises comparatively little attention has been paid to the dynamics of reentrant phase transitions. For example, distinct differences in the molecular dynamics in the N and RN phases can be concluded from corresponding changes in the nuclear magnetic relaxation times reported in Refs. dong8182, ; miyajima84, ; bharatam99, .
Whereas most earlier work on reentrancy of phase transitions in liquid crystals is experimental in nature comparatively little attention has been paid to this fascinating phenomenon from a theorist’s point of view. The most recent theoretical study employs isothermal-isobaric and canonical ensemble Monte Carlo (MC) simulations to investigate the nature of the smectic A(smA)-RN phase transition for a bulk system of hard ellipsoids with square-well attraction demiguel05 where earlier theoretical studies are briefly reviewed, too. Unfortunately, the model employed in Ref. demiguel05, is somewhat artificial in assuming that the ellipsodal molecules are always oriented in a perfectly parallel fashion such that all rotational degrees of freedom are always “frozen” irrespective of the thermodynamic conditions. Therefore, this study seems only of limited use to elucidate properties of RN phases at a molecular level. Moreover, the authors do not consider dynamic features of RN phases.
Therefore, we show here that the smA-RN phase transition causes a dramatic increase in the self-diffusion of the molecules in the direction of the nematic director . Our model system consists of soft spherocylinders interacting via the so-called Gay-Berne-Kihara pair potential martinez05 ; specifically, we use the GBK(6,5,2,1) version of the model in the notation of Ref. martinez05, . Data will be presented for a system of spherocylinders confined to a slit-pore with structureless walls, separated by a distance along the -axis. The fluid-solid interaction is described by the surface-averaged potential schoen07
| (1) |
In Eq. (1), determines the depth of the attractive well, is the areal density of a layer of substrate atoms, is the minimum distance of a spherocylinder from either substrate, and is the so-called “anchoring function” where the unit vector specifies the orientation of a molecule. The anchoring function is introduced to discriminate energetically specific orientations of molecules with respect to the substrate plane following a suggestion of Steuer et al. steuer04 . Here, such that an orientation parallel with the substrate plane is favored greschek10 ; throughout this work is used.
We employ both extensive isothermal-isobaric MC and microcanonical molecular dynamics (MD) simulations to locate the smA-RN phase transition and to study changes in mass transport accompanying that transition. The main purpose of employing MC is to provide suitably equilibrated starting configurations for subsequent MD simulations. In addition, MC is used to independently verify the correctness of the MD simulations through a comparison of equilibrium properties obtained in both types of simulations. In MC we use a standard algorithm schoen99 but allow the side lengths of the computational cell to vary independently to preserve the in-plane isotropy of the pressure tensor even in highly ordered confined phases; MD simulations are based on an implementation of the velocity Verlet algorithm ilnytskyi02 . We employ the customary dimensionless units of for length, for temperature , and for time , where is the spherocylinder mass. Values for and are taken from Ref. martinez05, . Our simulations comprise molecules of length . Interactions are truncated beyond a minimum distance . In MD the starting configuration is further equilibrated using a velocity rescaling scheme to the desired at constant volume. Throughout this work we employ a time step of to integrate the equations of motion.

To characterize the degree of nematic order we follow established protocols and compute the nematic order parameter as the ensemble average of the largest eigenvalue of the instantaneous alignment tensor maier59
| (2) |
where “” denotes the direct product and is the unit tensor. Hence, is real, symmetric, and traceless. Its eigenvector associated with the largest eigenvalue corresponds to . The layering characteristic of smA phases is quantitatively described through the function steuer04
| (3) |
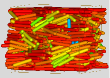
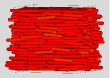
where is the spacing between layers and the smectic order parameter is defined as the maximum of in the interval where . Focusing on first, plots in Fig. 1 show that is rather small up to a number density indicating that the confined fluid is in its isotropic phase. Beyond , rises steeply assuming values characteristic of nematic phases () and levels off as increases. At the highest densities considered which reflects a nearly perfect orientation of molecules. Over the same range of densities, is very small up to values of , indicating that the confined fluid does not form any smectic layers. As the density increases further smectic layers are forming revealed by . Interestingly, as the density keeps increasing beyond , drops to a low value of about whereas increases further towards its maximum value of about . Hence, demarcates the formation of a RN phase. The structural characteristics of confined phases pertaining to the stable regime of N, smA, and RN phases is illustrated by “snapshots” of configurations generated in MD (see Fig. 2). Notice the presence of distinct molecular layers in the smA state which disappear once the RN state forms. Comparing snapshots for typical N and RN phases it is apparent from Fig. 2 that the latter exhibit much more orientational but roughly the same positional order compared with the former.
The key result of our study concerns the self-diffusion of molecules in the direction of their orientation. To that end we introduce the parallel mean-square displacement (MSD)
| (4) |
The angular brackets indicate an average over the molecules and a sufficiently large number of time origins referred to by subscript “”. In Fig. 3 we present plots of the MSD for typical N, smA, and RN phases where different time regimes can be identified. In the double-logarithmic representation short-time slopes of the MSD’s exceed their long-time counterparts on account of the initial ballistic motion of molecules in all three phases. As expected, the MSD’s are indistinguishable for . In the limit of large the time dependence of the MSD’s corresponds to diffusive motion, that is the MSD’s depend linearly on . The MSD for the smA phase exhibits a plateau at intermediate times which eventually gives way to diffusive motion at long times. The plateau reflects the presence of smectic layers that hinder molecular motion in the direction perpendicular to the plane of adjacent smectic layers (see Fig. 2). In the limit reliable values of can be extracted from the plots in Fig. 3 via the Einstein relation allen90 ; loewen99
| (5) |
A comparison of plots in Figs. 1 and 4 reveals that in the N phase, is small but nonzero. It attains a nearly vanishing value in the smectic phase on account of layer formation (see Fig. 2) which blocks mass transport efficiently in the direction of the layer normal allen90 . Most importantly, however, compared with the smA phases increases dramatically by several orders of magnitude when the RN phases become thermodynamically stable (i.e., for , see inset in Fig. 4). Because of the unusually large in conjunction with high nematic order (, see Fig. 1) we call these high-density nematic phases as “supernematic”. One also notices by comparing data for different in Fig. 4 that both data sets show a similar large increase of beyond a certain density threshold. However, the plot for exhibits nonzero values of over a density range where the corresponding curve for the lower drops to zero. This is due to the absence of smA phases at (see Fig. 1). Interestingly, the experimentally determined phase diagram presented by Guillon et al. also suggests absence of intermittent smA phases and a continuous transition from N to RN phases under suitable thermodynamic conditions guillon78 . Nevertheless, the increase in orientational order for and causes to increase equally strongly. Hence, at sufficiently high one may observe supernematic features without reentrancy.
The apparent dramatic increase of self-diffusivity in the RN phase can be attributed to a loss of rotational configurational entropy due to both increase in density and presence of solid surfaces. We rationalize this by assuming a characteristic time interval associated with the onset of diffusive motion in the direction of such that . For the probability that a molecule has traveled a distance from its origin at in the direction of should then also be inversely proportional to . Intuitively, one expects to be larger if the alignment of molecules with is more pronounced on average, that is the larger is. However, a larger value of implies a lower rotational configurational entropy such that using standard statistical-physical reasoning landau80 . This then suggests . We estimate via
| (6) |
where is the distribution of angles . Assuming to be Gaussian with a standard deviation of it is easy to verify that . A similar relation was obtained for the configurational entropy of a macromolecule in Ref. karplus81, assuming a Gaussian distribution of relevant internal degrees of freedom. Hence, the above line of arguments suggests which is supported by plots in Fig. 5.
In summary, we have shown for the first time that supernematic liquid-crystalline phases exhibit unusually large self-diffusivity which can be explained in terms of a substantially reduced . Here the suppression of is assisted by confinement to a nanoscopic slit-pore where the solid substrates favor a planar arrangement of the molecules with respect to the substrate plane. Because the solid surfaces of the slit-pore may be viewed as the representation of an external field superimposed onto the intermolecular interactions, we anticipate the results presented here to be generic in that they should persist in other fluids composed of anisometric molecules that are exposed to external fields (e.g., dipolar fluids in external magnetic fields). Hence, we believe our results to be important for a broad range of liquid-crystal applications ranging from lubricants in nanotribology carrion09 over nanosensors hussain09 to photonic juodkazis09 and organic electronic devices yang09 where the mobility of molecules plays a key role.
Though the experimental data so far communicated in the literature do not yet provide a rigorous confirmation of our theoretical predictions, some of these data are in reasonable qualitative agreement with our simulations. For example, extrapolating longitudinal relaxation rates reported in Ref. miyajima84, from the RN to the N phase yields values markedly below those in the N phase. If referred to the same these relaxation rates correspond to correlation times that are notably shorter in the RN compared with the N phase. However, this general interpretation of NMR data remains speculative as long as translational diffusion has not definitely be identified as the process governing the observed relaxation.
Direct evidence for the relation between translational diffusion and NMR data can be provided by the pulsed field gradient NMR (PFG NMR) technique valiullin09 which records molecular displacements typically over a m range. For example, PFG NMR has been applied to directly assess the diffusion tensor upon entering the N phase dvinskikh01 . In these studies diffusion in the direction of the molecules’ long axes was found to increase with increasing nematic order. By the same technique the diffusivity of n-alkanes in nanochannels was found to increase with increasing orientational order valiullin06 . These findings are in line with our data where enhanced molecular ordering is accompanied by increasing diffusivities in the direction of . The powerful combination of PFG NMR with magic angle spinning has recently enabled a notable increase in both observation times and gradient pulse intensities maas96 . As a consequence PFG NMR diffusion measurements became possible beyond the limits of measurability existing so far. This concerns in particular the first diffusion measurements with liquid crystals confined to nanopores romanova09 . To stimulate a direct experimental verification of our present predictions using these novel techniques is the primary purpose of this study.
Acknowledgements.
Financial support from the International Graduate Research Training Group 1524 is gratefully acknowledged.References
- (1) H. Kleinert et al., Phys. Rev. Lett. 93, 160402 (2004).
- (2) C. Bechinger et al., J. Phys.: Condens. Matter 12, A425 (2000).
- (3) M. Benghi Pinto et al., Phys. Rev. D 71, 123519 (2005).
- (4) N. Osaka et al., J. Chem. Phys. 127, 094905 (2007).
- (5) J. Dudowicz et al., J. Chem. Phys. 130, 164905 (2009).
- (6) S.M.M. Ramos et al., Langmuir 26, 5141 (2010).
- (7) J. Szydlowska et al., J. Mater. Chem. 18, 1108 (2008).
- (8) P.E. Cladis, Phys. Rev. Lett. 35, 48 (1975).
- (9) W.K. Lee et al., Liq. Cryst. 4, 87 (1989).
- (10) D. Pociecha et al., Phys. Rev. Lett. 86, 3048 (2001).
- (11) G. Heppke et al., Liq. Cryst. 8, 407 (1990).
- (12) G. Sigaud et al., Mol Cryst. Liq. Cryst. 69, 81 (1981).
- (13) R.Y. Dong, J. Chem. Phys. 75, 2621 (1981); ibid. 76, 5659 (1982).
- (14) S. Miyajima et al., Solid State Commun. 49, 675 (1984).
- (15) J. Bharatam and C.R. Bowers, J. Phys. Chem. B 103, 2510 (1999).
- (16) E. de Miguel and E. Martín del Río, Phys. Rev. Lett. 95, 217802 (2005).
- (17) B. Martínez-Haya et al., J. Chem. Phys. 122, 024908 (2005).
- (18) M. Schoen and S.H.L. Klapp, Nanoconfined fluids. Soft matter between two and three dimensions, (Wiley-VCH, New York, 2007).
- (19) H. Steuer et al., Phys. Rev. E 69, 031708 (2004).
- (20) M. Greschek et al., Soft Matter 6, 1898 (2010).
- (21) M. Schoen, Physica A 270, 353 (1999).
- (22) J.M. Ilnytskyi and M.R. Wilson, Comput. Phys. Commun. 148, 43 (2002).
- (23) W. Maier and A. Saupe, Z. Naturforsch. 14a, 882 (1959).
- (24) M.P. Allen, Phys. Rev. Lett. 65, 2881 (1990).
- (25) H. Löwen, Phys. Rev. E 59, 1989 (1999).
- (26) D. Guillon et al., Phys. Rev. Lett. 41, 1598 (1978).
- (27) L.D. Landau and E.M. Lifshitz, Statistical Physics, (Pergamon, London, 1980), Chap. 12.
- (28) M. Karplus and J.N. Kushick, Macromolecules 14, 325 (1981).
- (29) F.J. Carrion et al., J. Mol. Sci. 10, 4102 (2009).
- (30) A. Hussain et al., Biosens. Bioelectron. 25, 1 (2009).
- (31) S. Juodkazis et al., J. Appl. Phys. 106, 051101 (2009).
- (32) S.H. Yang and C.S. Hsu, J. Polym. Sci. Part A 47, 2713 (2009).
- (33) R. Valiullin et al., Phys. Chem. Chem. Phys. 11, 2833 (2009).
- (34) S.V. Dvinskikh and I. Furo, J. Chem. Phys. 115, 1946 (2001).
- (35) R. Valiullin and A. Khokhlov, Phys Rev. E 73, 051605 (2006).
- (36) W.E. Maas et al., J. Am. Chem. Soc. 118, 13085 (1996).
- (37) E.E. Romanova et al., J. Magn. Reson. 196, 110 (2009).