Note and calculations concerning elastic dilatancy in 2D glass-glass liquid foams
Abstract
When deformed, liquid foams tend to raise their liquid contents like immersed granular materials, a phenomenon called dilatancy. We have aready described a geometrical interpretation of elastic dilatancy in 3D foams and in very dry foams squeezed between two solid plates (2D GG foams). Here, we complement this work in the regime of less dry 2D GG foams. In particular, we highlight the relatively strong dilatancy effects expected in the regime where we have predicted rapid Plateau border variations.
pacs:
47.20.Dr, 83.80.Iz, 47.57.Bc, 68.03.CdI Dilatancy in foams
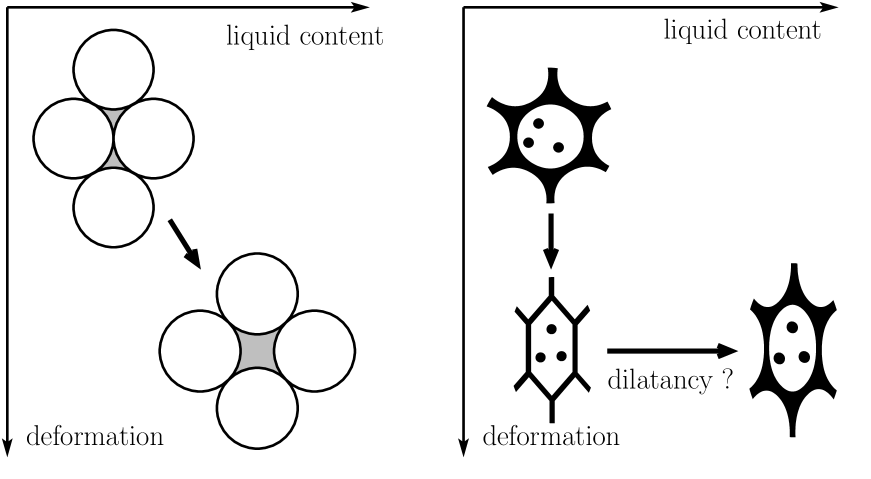
Liquid foams Weaire and Hutzler (1999); Cantat et al. (2010) and granular materials both exhibit “dilatancy”, described by Reynolds Reynolds (1985) in the context of granular materials: upon deformation, because grains are forced to move while avoiding each other, the medium swells to some extent. In other words, the fluid volume fraction is increased (see Fig. 1). This effect can remain unnoticed in air. By contrast, a spectacular absorption of liquid Bagnold (1941) is obtained upon deformation of an immersed granular sample.
Because bubbles can deform individually, a foam might deform substantially without altering its liquid fraction (see Fig. 1). Hence, there is a priori no reason why a foam should display dilatancy. In fact, dilatancy does exist in foams. This has been shown both experimentally Marze et al. (2005) in the case of “dynamic” dilatancy (caused by a continuous foam deformation) and theoretically Weaire and Hutzler (2003); Rioual et al. (2005); Rognon et al. (2010a) in the case of “elastic” dilatancy (caused by a constant deformation of the foam).
Dilatancy can be defined Weaire and Hutzler (2003) in terms of the osmotic pressure of a foam confined in a container, which corresponds to the force that must be applied externally to one of the confining walls if the latter is permeable to the liquid but not to the bubbles. The static dilatancy coefficient reflects the fact that the foam osmotic pressure varies with the deformation when the fluid volume fraction is kept constant:
| (1) |
Surprisingly, this coefficient can be either positive like in granular materials or negative Weaire and Hutzler (2003). In the case of a negative dilatancy coefficient, deforming the foam results in a tendency to expell liquid and make the foam dryer.
We have shown that the origin of this change in sign can be traced back to two different physical contributions Rognon et al. (2010a). On the one hand, deforming the foam implies an increase in the total of all Plateau border lengths in the sample (in the case of a 2D GG foam Vaz and Cox (2005), these are the pseudo Plateau borders, i.e., those along the solid plates). As a result of this increase in length, when the total amount of liquid is kept constant, the Plateau borders shrink, which raises the pressure difference between the gas and the liquid, resulting in an increase of the osmotic pressure, hence a positive contribution to dilatancy. On the other hand, deforming the foam also implies an increase in the total surface area of the gas-liquid interfaces. Because the interfaces contribute negatively to the stress tensor in the foam (tensile contribution), this has a negative contribution to the osmotic pressure, and hence, to dilatancy. Because the increase in total interfacial energy is directly related to the elasticity of the foam, this negative contribution to dilatancy coefficient is proportional to the elastic modulus, as shown by Weaire and Hutzler Weaire and Hutzler (2003),
In the present work, with this geometrical interpretation in mind, we conduct the explicit calculation of the elastic dilatancy of not too dry 2D GG foams (regimes A, B, C and D). In particular, we highlight the relatively strong dilatancy effects expected in the regime where we have predicted rapid Plateau border variations.
II Geometry of 2D GG foams: floor tile versus pancake regime
Let us first choose notations Rognon et al. (2010a, b) to describe the geometry of two-dimensional foams squeezed between two glass plates, called “GG” foams.
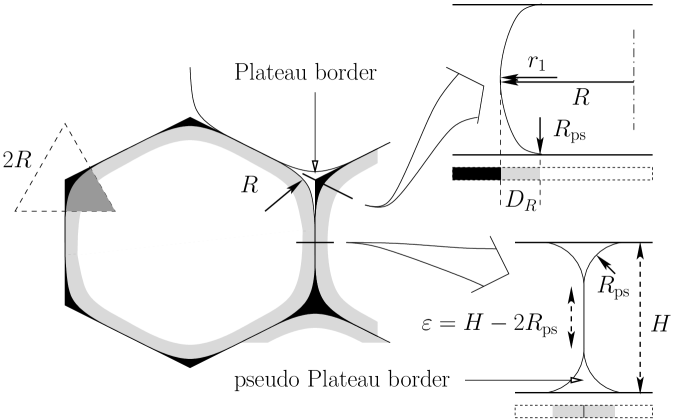
We call the perimeter of the bubble, defined as the perimeter of the rounded polygon that constitutes the bubble, as seen from above, and the corresponding radius of curvature of the Plateau border (see Fig. 2, left). We call the distance between both solid plates, and the radius of curvature of the pseudo Plateau borders (see Fig. 2, bottom right). We also call the average bubble volume, and the average volume of liquid per bubble. The liquid volume fraction thus verifies:
| (2) |
We assume that remains constant: the applied stresses are not sufficient to compress the gas phase significantly unless the bubble size is on the order of a micron.
| A | - | |||
| - | B | |||
| C | - | |||
| - | D | pancake | ||
| floor tile | E | 2D | ||
| stretched 2D | F | - | ||
| - | G |
The main contributions to the quantity of liquid per bubble are pictured on Fig. 2 and can be calculated from simple geometrical arguments:
| (3) |
The first term corresponds to the pseudo Plateau borders, which make the junction between the interbubble films and the solid plates. As seen from above, they correspond to the light grey regions in Fig. 2. Each portion of their interfaces has the shape of a quarter of a circular cylinder (see Fig. 2, bottom right). The second term in Eq. (3) corresponds to the genuine Plateau borders (black regions in Fig. 2), whose three contours span an angle each.
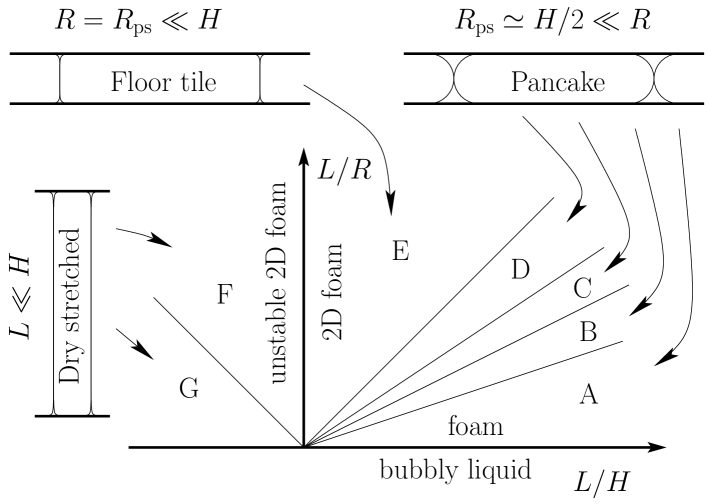
Eq. (3) indicates that the squeezed 2D foam can be found in two main regimes depending on volume fraction and geometry. They are pictured on Fig. 3.
-
1.
When the Plateau border radius is much larger than the sample thickness (regimes A-D of Fig. 3), each bubble takes the form of a thick “pancake”, and its edge is like a half cylinder with radius .
-
2.
In the reverse limit, the bubbles are shaped more like “floor tile”, with sharp edges (regime E of Fig. 3): this time, the Plateau borders are like fine threads pinned on both solid plates, and each pseudo Plateau borders resembles a stretched, fine thread, glued on one of the solid plate and joining the attachment points of two Plateau borders.
In Fig. 3, we have also pictured regimes F and G: they are useful to obtain the limit of ideal 2D foams, for which the solid plates are so far apart that the volume of the pseudo Plateau borders can be entirely neglected. Regime G is useful in particular for dilatancy Rognon et al. (2010a) as it reproduces the negative dilatancy result obtained in the very dry limit Weaire and Hutzler (2003). Note that as shown by Cox, Weaire and Vaz both analytically and numerically Cox et al. (2002), any bubbles with less than six neighbours will tend to gather on one of the solid plates for large separations, thus turning the foam into a three-dimensional rather than two-dimensional foam. As a result, in the case where all bubbles inside the foam have exactly six or more (hence exactly six) neighbours, the plates can be separated indefinitely without triggering any rearrangements.
In the pancake regime (A-D), one has . Taking into account the elliptical shape of the Plateau border cross-section taken perpendicularly to the plates (see Ref. Rognon et al. (2010b) for details), the volume of liquid per bubble can be expressed as:
| (4) |
In regimes A and B, the Plateau border contribution dominates: . Conversely, in regimes C and D, the pseudo Plateau borders contain most of the liquid: .
In all three regimes E-G (, floor tile regime), the radius of curvature of the pseudo Plateau borders is equal to that of the Plateau borders and Eq. (3) reduces to:
| (5) |
III Dilatancy in the CD regime
In this Section, we focus on regimes C and D, see Fig.3 They are defined by the following conditions:
| C | ||
| D |
Indeed, we have shown that in these regimes, the size of the Plateau borders change in a particularly rapid manner Rognon et al. (2010b) as a function of volume fraction , inter-plate distance or bubble size . We thus expect stronger dilatancy effects in these two regimes. We will demonstrate below that it is indeed the case.
In order to conduct the corresponding calculation, our first aim is to obtain an expression relating the variation of the liquid volume fraction, the variation of the osmotic pressure and the variation of the perimeter (related to the foam deformation ).
Eliminating between the equations for and , we obtain:
| (11) |
| (12) |
As shown in Ref. Rognon et al. (2010a), the variation of the perimeter is related to the foam deformation in the following way, see Appendix B:
| (13) |
Then, using
| (14) |
| (15) |
and
| (16) |
we get:
| (17) |
| (18) |
Setting , we obtain the dilatancy coefficients defined by Eq. (1), which characterize the immediate change in osmotic pressure due to the foam deformation:
| (19) |
| (20) |
Conversely, setting , we obtain the eventual change in liquid fraction that results from a deformation :
| (21) |
Using
| (22) |
we get the relative change in liquide volume fraction:
| (23) |
| Quantity | Eqs. | Value | Regimes |
| pseudo Plateau | ABCD | ||
| border radius | Ref. Rognon et al. (2010b) | EFG | |
| volume | ABFG | ||
| of liquid | CD | ||
| per bubble | (4, 5) | E | |
| liquid | ABFG | ||
| volume fraction | CD | ||
| () | (24-27) | E | |
| AB | |||
| specific | CD | ||
| surface area | Ref. Rognon et al. (2010b) | E | |
| FG | |||
| normal | ABCD | ||
| osmotic pressure | (70, 72) | EFG | |
| in-plane | ABCD | ||
| osmotic pressure | (71, 73) | EFG | |
| shear | ABCD | ||
| modulus | (90-91) | EFG |
| Quantity | Eqs. | Value | Regimes |
| Plateau | ABC | ||
| border | D | ||
| variation | (81, 83) | E | |
| FG | |||
| A | |||
| Normal | BC | ||
| elongational | D | ||
| dilatancy | (96, 98) | E | |
| F | |||
| G | |||
| A | |||
| In-plane | BC | ||
| elongational | D | ||
| dilatancy | (97, 99) | E | |
| F | |||
| G | |||
| Liq. fraction | A | ||
| variation | B | ||
| at constant | CDE | ||
| normal | (111, 113) | F | |
| G | |||
| Liq. fraction | A | ||
| variation | B | ||
| at constant | CDE | ||
| in-plane | (112, 114) | F | |
| G |
IV Conclusion
In the present follow-up to References Rognon et al. (2010a, b), we derived detailed mechanical properties of two-dimensional foams squeezed between parallel solid surfaces.
The main geometrical and mechanical properties of such foams are summarized in Tables 2 and 3 and in the corresponding equations indicated therein.
After recalling our geometrical interpretation of elastic dilatancy in very dry 2D GG and 3D foams Rognon et al. (2010a), we derived the expected magnitude of such effects for less dry 2D GG foams.
It must be recalled, at this stage, that the calculations were carried out in some asymptotic limits defined by Table 1. Some of these regimes (particularly A-D) are rather narrow: for comparison with a real situation, it will be more advisable to use the full equations cited in Table 3 than each asymptotic expression listed within the table. To get more accurate results, in particular in regimes C and D, Surface Evolver simulations would be required as in Refs. Cox and Janiaud (2008); Rognon et al. (2010b).
Concerning dilatancy, the main result of our calculations is that the expected effect is positive in most regimes (B-F): deforming the foam will induce an increase in the osmotic pressure if the volume is kept constant, or conversely it will induce an increase in the liquid volume fraction if the osmotic pressure is kept constant. Only regimes A and G display negative dilatancy Weaire and Hutzler (2003): in these regimes, among both contributions to the osmotic pressure discussed in Ref. Rognon et al. (2010a) and recalled in the Introduction, the effect of the increase in total surface area dominates over the effect of the increase in total pseudo Plateau border length.
As we mentioned in the Introduction, the Plateau borders vary rapidly in size in regimes C and D Rognon et al. (2010b). Let us now discuss how that affects dilatancy.
As can be seen in Table 3, the relative change in volume fraction at constant in-plane osmotic pressure , divided by the square of the deformation, (see Appendix B), is of order unity in regimes , and . It can be checked, using Table 1, that the same quantity is much smaller in neighbouring asymptotic regimes and . The same observation holds at constant normal osmotic pressure .
Regarding both the in-plane and the normal dilatancy coefficients and , the same is true. Indeed, taking their expressions in regime as a reference, , one can check, again using Table 1, that they become bigger in regimes and and smaller in and .
We believe that regimes and should therefore a priori constitute the more promising target for experimental investigations.
Acknowledgements
We gratefully acknowledge fruitful discussions with Benjamin Dollet and with participants of the GDR 2352 Mousses (CNRS) and of the Informal Workshop on Foam mechanics (Grenoble 2008). P.R. was supported by the Agence Nationale de la Recherche (ANR05).
Appendix A Liquid volume fraction
From Eqs. (4) and (5), we derive the liquid volume fraction in the foam, both in the pancake regime and in the floor tile regime:
| (24) | |||||
| (25) |
The corresponding values of in all sub-regimes are indicated in Table 2. Because the total volume of the bubble and liquid, , is not constant, it is useful to express the liquid fraction in terms of the volume of the bubble itself. Using , the above equations become:
| (26) | |||||
| (27) |
Appendix B Bubble perimeter in a crystalline 2D foam
Let us consider a crystalline foam subjected to an arbitrary elastic, homogeneous deformation. Up to a global rotation, it can be expressed as an elongation:
| (28) |
The perimeter of such a hexagonal foam increases upon deformation in the following way 111Surprisingly, the increase in bubble perimeter does not depend on the crystal orientation with respect to the direction of elongation. :
| (29) | |||||
| (30) |

To show it, we consider a crystalline, two-dimensional foam in the dry limit, and derive the total interface contour length in the foam as a function of the applied deformation.
Let us start with an undeformed foam. The initial bubble edges , and meet at angle according to Plateau’s rule, and they have identical lengths (hence, ), see Fig. 4a. The center-to-center vectors
| (31) | |||
| (32) | |||
| (33) |
which coincide with the principal crystalline axes, then also meet at angle . When the foam is deformed (transformation ), these vectors are deformed according to:
| (34) | |||||
| (35) | |||||
| (36) |
Correspondingly, the bubble edges , and reorganize so as to not only verify
| (37) | |||
| (38) | |||
| (39) |
but also maintain the angle condition. This generally implies evolving towards unequal lengths (see Fig. 4b).
For simplicity, we restrict ourselves to a deformation that conserves the bubble volume (i.e., surface area as seen from above):
| (40) | |||||
where , and are the new edge lengths. Such a deformation consists in an elongation by a factor in one direction and by a factor in the perpendicular direction. If we fix the direction of vectors and as on Fig. 4 for convenience, the most general such transformation can be represented by a matrix of the form:
| (41) |
where and are two rotation matrices.
From Eqs. (34) to (36) and (41), the center-to-center version Graner et al. (2008) of the texture tensor Aubouy et al. (2003); Asipauskas et al. (2003) can be expressed in matrix form:
| (43) | |||||
| (44) |
From Eq. (44), we obtain:
| (45) |
From Eq. (43) and Eqs. (37-39), using the fact that vectors , and meet at angle , we obtain another expression for :
| (46) |
where is the bubble perimeter and where the last term is proportional to the (fixed) bubble surface area , see Eq. (40).
These two expressions for yield Eq. (29) for the bubble perimeter in terms of its initial value .
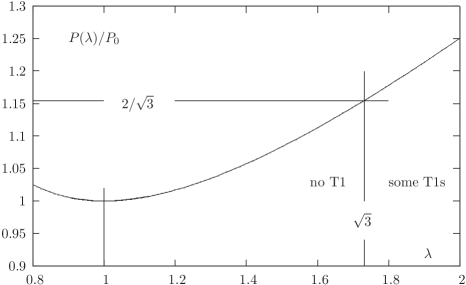
The maximum elongation is for a few, specific orientations of the crystalline network with respect to the direction of elongation (it is larger for all other orientations), and this value decreases as the foam becomes wetter as described already long ago Weaire and Hutzler (1999).
Appendix C Calculation of the asmotic pressure
In the present paragraph, we will calculate the osmotic pressure of a 2D GG foam. As mentioned in the Introduction, it will later be useful to estimate the foam dilatancy.
When the foam is confined in a container, the osmotic pressure corresponds to the force that must be applied externally to one of the confining walls if the latter is permeable to the liquid but not to the bubbles. The osmotic pressure (which is in fact a symmetric tensor and not just a scalar quantity Weaire and Hutzler (2003); Rioual et al. (2005)) is thus the difference between the stress in the foam and the pressure applied by the pure liquid on the other side of the semi-permeable wall:
| (47) |
(where tensile stresses and pressures are both counted positively). The stress in the foam includes a pressure contribution from the liquid () and from the gas (), as well as a tensile contribution from the interfaces:
| (48) |
Hence,
| (49) | |||||
C.1 Stress due to the interfaces
Together with the liquid and gas pressures, the interfaces in a foam contribute to the stress in the foam, as they carry surface tension. In the present appendix, we derive a simple expression for this contribution in the situation of interest.
Each element of interface in the foam, whose normal is oriented along some vector , has a stress contribution that is in the plane perpendicular to , hence it is proportional to .
In general terms, let us decompose the specific surface area in the foam (surface area per unit volume) according to its orientation:
| (50) |
where represents an element of solid angle. The stress contribution from the interfaces can then be expressed as:
| (51) |
where is the surface tension.
This implies, in particular, that the orientational average of the interface stress contribution is simply related to the specific surface:
| (52) | |||||
as already mentioned through Eq. (63).
We restrict our calculation to the vertical component and to the in-plane averaged component of the interfacial stress.
Consider a surface element whose normal makes an angle with the vertical direction. If , the surface element is horizontal and it contributes towards and zero towards By contrast, if , the surface element is vertical and it contributes towards (where the factor comes from the in-plane orientation average) and towards . More generally, it contributes towards and towards .
The contribution from the top and the bottom of a bubble to the in-plane component is:
Making the approximation in the Plateau border region Rognon et al. (2010b) and using , this becomes:
| (53) |
The contribution from the vertical films towards is:
| (54) |
Their contribution to is twice as less due to the orientation average.
The contribution to from the menisci, considered as circular quarter cylinders with radius , can be written as:
| (55) |
Their contribution to is very similar:
| (56) |
The in-plane interface stress component thus includes contributions from Eqs. (53), (54) and (56):
| (57) | |||||
As for the vertical interface stress component, it includes contributions from Eqs. (54) and (55):
| (58) | |||||
From these two equations, we obtain the final results both in the pancake regime where (see Ref. Rognon et al. (2010a)) and where (regimes A-D of Fig. 3) and in the floor tile regime where (E-G):
| (59) | |||||
| (60) | |||||
| (61) | |||||
| (62) | |||||
Note that as expected from the discussion at the beginning of the present Appendix and as can be checked from the corresponding expressions of the specific surface area Rognon et al. (2010b), the average of all three components is simply related to the total specific surface area :
| (63) |
where the numerical factor simply reflects the fact that each surface element contributes tensile stress in two out of three directions of space.
C.2 Expression of the osmotic pressure
The interfacial contribution to the stress is calculated in Appendix C.1 with the same geometrical approximations as the liquid volume given by Eq. (4). The value is averaged over the sample thickness. For simplicity, we also average in-plane contributions over their orientations. We thus have one value for the vertical component and one value for the in-plane averaged component. The vertical films in the foam contribute plainly to the vertical component and partly (due to the orientation average) to the in-plane component. The interface in the Plateau and pseudo Plateau borders make an angle with the vertical direction: they contribute partly to both components. As for the top and bottom interfaces of the bubbles, they contribute plainly to the in-plane components.
The results from Appendix C.1 are as follows:
| (64) | |||||
| (65) | |||||
| (66) | |||||
| (67) | |||||
In regimes A-D, the first term in Eq. (49) can be written as:
| (68) |
In regimes E-G, it reduces to:
| (69) |
Appendix D Calculation of the dilatancy and change in volume fraction
D.1 Remark on the calculations
In the following paragraphs, in order to derive such quantities as the elastic modulus, the dilatancy coefficient or the change in volume fraction upon deformation, we will need to differentiate several equations such as Eqs. (26-27) and (70-73) and the expressions for the specific surface area Rognon et al. (2010b).
When conducting such calculations, we consider that the gas volume as well as the distance between the solid plates remain constant.
Once the differentiation is performed, we determine the relative orders of magnitudes of the different terms by using such estimates as:
| (74) | |||||
| (75) | |||||
| (76) | |||||
| (77) |
and simplify the results accordingly. Performing such simplifications prior to differentiation would erroneously suppress some relevant terms.
We also assimilate the true perimeter of the bubble and the “dry” perimeter used to derive Eqs. (29) and (30). The former is the perimeter of the light grey region in Fig. 2, while the latter is the perimeter that includes the black regions. Because the Plateau border regions (medium grey sector in Fig. 2) correspond to an angle , they are related through:
| (79) |
Hence, their relative difference is of order , which is small in all regimes A-G ().
D.2 Change in the Plateau border radius
The foam deformation, which generates an increase in the bubble perimeter given by Eq. (30), causes a change in the radius of curvature of the Plateau borders.
D.3 Shear modulus
The average bubble surface area, and hence the foam interfacial energy, also change as a consequence of the increase in the bubble perimeter given by Eq. (30). When taken at constant liquid fraction (or equivalently at constant ), this change is directly related to the shear modulus of the foam. From the expressions of the specific surface area obtained in Ref. Rognon et al. (2010b), we obtain:
| (84) | |||||
| (85) | |||||
These equations, taken at constant volume fraction () and with , together with Eqs. (81) and (83), yield:
| (86) | |||||
| (87) |
where it turns out that Eq. (87) for regimes E-G results just from the change in perimeter, i.e., the term in Eq. (85). By contrast, for regimes A-D, the result of Eq. (86) depends partly on the reduction in Plateau border radius ( term) in Eq. (84) caused by the deformation.
Let us now derive the shear modulus from the above equations. In the case of a foam, the elastic energy per unit volume in the material is given by the change in specific surface area caused by some (small) shear strain , multiplied by surface tension:
| (88) |
Now, because shear causes both deformation and rotation, the effect of a strain on elongation is halved: . Hence, Eq. (30) yields:
| (89) |
Using Eqs. (88) and (89), the shear modulus in the pancake and in the floor tile regimes can now be derived from Eqs. (86) and (87):
| (90) | |||||
| (91) |
D.4 Change in osmotic pressure
The change in bubble perimeter also causes a change in osmotic pressure.
| (92) | |||||
| (93) | |||||
| (94) | |||||
| (95) | |||||
where some terms have been neglected as explained in Paragraph D.1.
At constant volume fraction () and with , the above equations now yield, using Eqs. (81) and (83):
| (96) | |||||
| (97) | |||||
| (98) | |||||
| (99) |
where, again, some terms have been neglected. These results are reported in Table 3 in each asymptotic regime, using the relations of Table 1. Note that both normal and in-plane dilatancy are negative not only in regime G as mentioned in ref. Rognon et al. (2010a), but also in regime A.
D.5 Elastic dilatancy in GG foams: shear or elongation, in-plane or normal
There are of course two versions of dilatancy, depending on whether the osmotic pressure is measured in the plane of deformation or in the normal direction. But the value of the coefficient defined by Eq. (1) depends on the deformation mode that is considered. Hence, for an elongation by a factor or for a shear strain , the variation of the osmotic pressure and the definition of the dilatancy coefficient will be:
| (100) | |||
| (101) |
The dilatancy coefficient can thus be expressed as:
| (102) | |||||
| (103) |
Now, for elongation, the usual definition of a deformation is that the material is elongated by a factor . Hence, Eq. (30) yields:
| (104) |
As a result of Eqs. (89) and (104), the dilatancy coefficients for elongation and shear deformation modes can be expressed as:
| (105) | |||||
| (106) |
D.6 Change in volume fraction
We shall now calculate the change in liquid volume fraction that results from the foam deformation (change in perimeter) under constant (normal or in-plane) osmotic pressure.
References
- Weaire and Hutzler (1999) D. Weaire and S. Hutzler, The Physics of Foams (Oxford University Press, 1999).
-
Cantat et al. (2010)
I. Cantat,
S. Cohen-Addad,
F. Elias,
F. Graner,
R. H
”ohler, O. Pitois, F. Rouyer, and A. Saint-Jalmes, Les mousses - structure et dynamique (Belin, Paris, 2010). - Reynolds (1985) O. Reynolds, Philos. Mag. 20, 469 (1985).
- Bagnold (1941) R. Bagnold, The physics of blown sand and desert dunes (Chapman and Hall, London, 1941).
- Marze et al. (2005) S. Marze, A. Saint-Jalmes, and D. Langevin, Colloids and Surface A 263, 121 (2005).
- Weaire and Hutzler (2003) D. Weaire and S. Hutzler, Phil. Mag. 83, 2747 (2003).
- Rioual et al. (2005) F. Rioual, S. Hutzler, and D. Weaire, Coll. Surf. A 263, 117 (2005).
- Rognon et al. (2010a) P. Rognon, F. Molino, and C. Gay, EPL (Europhysics Letters) 90, 38001 (2010a).
- Vaz and Cox (2005) M. Vaz and S. Cox, Philosophical Magazine Letters 85, 415 (2005).
- Rognon et al. (2010b) P. Rognon, C. Gay, D. Reinelt, and F. Molino, subm. to Eur. Phys. J. E (2010b), eprint http://hal.archives-ouvertes.fr/hal-00361004/fr/.
- Cox et al. (2002) S. Cox, D. Weaire, and M. Vaz, The European Physical Journal E: Soft Matter and Biological Physics 7, 311 (2002), ISSN 1292-8941, URL http://dx.doi.org/10.1140/epje/i2001-10099-1.
- Cox and Janiaud (2008) S. Cox and E. Janiaud, Philosophical Magazine Letters 88, 693 (2008).
- Graner et al. (2008) F. Graner, B. Dollet, C. Raufaste, and P. Marmottant, Eur. Phys. J. E 25, 349 (2008), eprint arXiv:0708.3193 [cond-mat.soft].
- Aubouy et al. (2003) M. Aubouy, Y. Jiang, J. Glazier, and F. Graner, Granular Matter 5, 67 (2003).
- Asipauskas et al. (2003) M. Asipauskas, M. Aubouy, J. Glazier, F. Graner, and Y. Jiang, Granular Matter 5, 71 (2003).