We derive a simple integral representation for the distribution of the maximum of Brownian motion minus a parabola, which can be used for computing the density and moments of the distribution, both for one-sided and two-sided Brownian motion.
1 Introduction
It is the purpose of this note to show how one can easily obtain information on properties of the distribution of the maximum of Brownian motion minus a parabola from [Groeneboom (1989)]. In fact, Corollary 3.1 in that paper gives the joint distribution of both the maximum and the location of the maximum. In the latter paper most attention is on the distribution of the location of the maximum, which is derived from this corollary. The reason for the emphasis on the distribution of the location of the maximum is that this distribution very often occurs as limit distribution in the context of isotonic regression; one could say that it is a kind of “normal distribution” in that context. But one can of course also derive the distribution of the maximum itself from this corollary and at the same time deduce numerical information, as will be shown below.
Numerical information on the density, quantiles and moments of the location of the maximum is given in [Groeneboom and Wellner (2001)], which in turn relies on section 4 of [Groeneboom (1985)].
2 Representations of the distribution of the maximum
Let be the distribution function of the maximum of where is one-sided Brownian motion (in standard
scale and without drift). Then, according to Theorem 3.1 of [Groeneboom (1989)], has the representation
(2.1)
where the function has Fourier transform
(2.2)
and where and . It follows that the corresponding density has the
representation
(2.3)
where has Fourier transform
(2.4)
The (symmetric) density of the maximum of , where is two-sided Brownian motion, originating from zero, therefore
has the representation
(2.5)
since the distribution function of is the maximum of the two maxima one gets to the right and to the left of zero.
Note that these two maxima are independent, since two-sided Brownian motion is started independently to the right and to the
left, starting at zero. It is also obvious that these two maxima have the same distribution. Interestingly, the situation is
more complicated for the location of the maximum!
Note that this gives the complete characterization of the distribution of the maximum of Brownian motion with parabolic drift. The purpose of this note, however, is to show how one can deduce useful numerical information from this.
The two fundamental solutions of the Airy differential equation are Ai and Bi which are unbounded on different regions of the complex plane. For the purpose of computing moments, etc., it is easier to only work with the solution Ai, so we want to get rid of Bi. To this end we simply use Cauchy’s formula.
We have the following lemma.
Lemma 2.1
Let be defined by
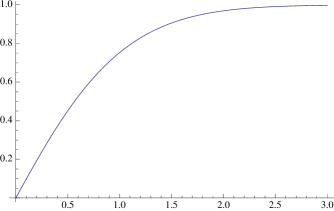
So is the maximum for the one-sided case. Then the distribution function of is given by:
One can use this representation to compute the distribution function in one line in, for example, Mathematica, and the result of this computation is shown below in Figure 1, where we take .
Figure 1: The distribution function , for .
Proof of Lemma 2.1.
After the change of variables we
get for the corresponding distribution function , still taking ,
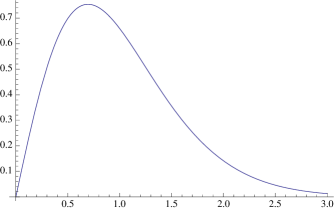
A picture of the density , for and two-sided Brownian motion, is given in Figure 3.
Figure 3: The density of the maximum for two-sided Brownian motion and .
3 Concluding remarks
The densities of the maximum and location of the maximum of Brownian motion minus a parabola were originally studied by solving partial differential equations. For example, if we denote the location of the maximum of two-sided Brownian motion minus the parabola by , then the density of is expressed in [Chernoff (1964)] in terms of the solution of the heat equation
for , under the boundary conditions
If is the (smooth) solution of this equation, the density of is given by
The original computations of this density were indeed based on numerically solving this partial differential equation (as I learned from personal communications by Herman Chernoff and Willem van Zwet). However, it is very hard to solve this equation numerically sufficiently accurately for negative values of , since we have, by (4.25) in [Groeneboom (1985)]:
where and .
At present the situation is drastically different, since we have much more analytical information about the solution and, moreover, can use advanced computer algebra packages. One only needs one line in Mathematica to compute the density , since, by (3.8) in [Groeneboom (1989)], is given by , where:
and where one can even allow the boundaries and in the numerical integration (in Mathematica).
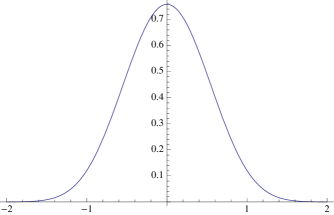
A picture of the density , obtained from just using this definition in Mathematica, is given in Figure
4.
However, if one wants to get very precise information about the tail behavior of the density or the behavior close to zero, it is better to use power series expansions or asymptotic expansions, which are different in a neighborhood of zero from the representation for large values of the argument. Details on this are given in [Groeneboom (1985)] and [Groeneboom and Wellner (2001)].
More details on the history of the subject are given in [Perman and Wellner (1996)] and [Janson, Louchard and Martin-Löf (2010)].
In the latter manuscript also more details on the distribution of the maximum of Brownian motion minus a parabola are given. Their results seem to be in complete agreement with some numerical computations, based on the representations given in section 2.
Figure 4: The density of the location of the maximum of .
Acknowledgement
I want to thank Neil O’Connell for inviting me to submit this note to the Electronic Journal of Probability.
References
Abramowitz and Stegun (1964)Abramowitz, M. and Stegun, I.E. (1964).
Handbook of Mathematical Functions.
National Bureau of Standards Applied Mathematics Series No. 55.
U.S. Government Printing Office, Washington, DC.
Chernoff (1964)Chernoff, H.E. (1964)
Estimation of the mode
Ann. Statist. Math.,
16, 85-99.
Daniels and Skyrme (1985)Daniels, H.E. and Skyrme, T.H.R. (1985)
The maximum of a random walk whose mean path has a maximum.
Adv. Appl. Probab.,
17, 85-99.
Groeneboom (1985)Groeneboom, P. (1985)
Estimating a monotone density.
In Proceedings of the Berkeley Conference in Honor of Jerzy
Neyman and Jack Kiefer, II. L. M Le Cam and R. A. Olshen,
editors, 535 - 555. Wadsworth, Belmont.
Groeneboom (1989)Groeneboom, P. (1989)
Brownian motion with a parabolic drift and Airy functions.
Probab. Theory Related Fields,
81, 31-41.
Groeneboom and Wellner (2001)Groeneboom, P. and Wellner, J.A. (2001)
Computing Chernoff’s distribution.
Journal of Computational and Graphical Statistics, 10, 388-400.
Janson, Louchard and Martin-Löf (2010)Janson, S., Louchard, G. and Martin-Löf, A. (2010).
The maximum of Brownian motion with a parabolic drift. Submitted.
Perman and Wellner (1996)Perman, M. and Wellner, J.A. (1996)
On the distribution of Brownian areas,
The Annals of Applied Probability, 6, 1091-1111.
Wolfram (2009)Wolfram, S. (2009).
Mathematica.
Wolfram Research, Champaign.