Development of a Compact Resonance Ionization Mass Spectrometer for Trace Element Analysis of Potassium
Japan Atomic Energy Agency, 4002 Narita, Oarai, Ibaraki 311-1393
1International Center for Elementary Particle Physics (ICEPP), University of Tokyo,
7-3-1 Hongo, Bunkyo, Tokyo 113-0033
2Department of Physics, School of Science, University of Tokyo, 7-3-1 Hongo, Bunkyo,
Tokyo 113-0033)
Abstract
A compact resonance ionization mass spectrometer is developed using two laser diodes and a quadrupole mass spectrometer to perform trace element analysis of potassium. With the help of a narrow linewidth of the laser diode, the isotope shifts of and of the 405 nm line with respect to , corresponding to the transition of S P, are measured to be MHz and MHz, respectively, by comparing them to the known hyperfine splitting widths of the ground state of each potassium isotope. The overall detection efficiency of an order of in our setup indicates the availability of RIMS to the analysis of the trace metal impurities on or in a certain material such as the contamination assessment of semiconductor wafers.
1 Introduction
Recent development in laser technology has brought remarkable progress in spectroscopy, analytical spectrochemistry and mass spectrometry [1]. As one of the promising techniques realized by improvement of laser performance, selective excitation and photoionization of a specific kind of atom can be achieved with resonant absorption of a photon (or photons) with corresponding wavelength. This resonance ionization spectroscopy (RIS) is combined with a conventional mass spectrometer such as a quadrupole mass spectrometer (QMS) or a time-of-flight mass spectrometer (TOF-MS) to form resonance ionization mass spectrometry (RIMS), which is now used in various fields including geochemistry [2] and nuclear engineering [3] for isotopic analysis of noble gas, and was once proposed for the detection of the double beta decay and the solar neutrino [4, 5]. Although RIMS has not relatively been a common analytical method yet, it is quite effective in terms of its insensitivity to unwanted atoms or molecules as well as the compact size of the apparatus compared to accelerator mass spectrometry (AMS), which is considered to be a method with the best detection limit but a lack of convenience [6].
The main characteristic of RIMS, insensitivity to unwanted atoms or molecules, leads to the suppression of background noise level to obtain high sensitivity to a certain element. As for the detection of trace isotopes, the effect of the tail of adjacent mass peak in a mass spectrometer has much impact on the discrimination of a specific isotope, along with high sensitivity of the apparatus.
Since the electronic state of an atom, dependent on each element, is also known to be slightly different among isotopes of the same element, this subtle difference can be discriminated by CW lasers with sufficiently narrow linewidth () and cannot by pulsed lasers with linewidth of typically . Besides the general isotope discrimination by mass spectrometers like TOF-MS or QMS, additional selectivity among isotopes can therefore be obtained by using CW lasers in the resonance ionization part.
In this paper, we report on measurement of isotope shifts of and of the 405 nm line with respect to by our compact resonance ionization mass spectrometer consisting of two laser diodes and a QMS. The overall detection efficiency of the spectrometer is improved compared to our previous setup [12], and we propose the application of RIMS to the analysis of the trace metal impurities on or in a certain material such as the contamination assessment of semiconductor wafers. Surface contamination, especially contamination of trace metals including potassium, can cause a critical issue as device features continue to shrink and gate dielectrics scale toward the atomic level [7]. During high-temperature processing steps, metals at the surface can diffuse into the silicon substrate and act as recombination centers, adding electronic states into the band gap of silicon and degrading minority carrier lifetimes. Surface metallic impurities can also adversely affect silicon oxidation rates and become incorporated in gate oxides, where they degrade gate oxide integrity by increasing leakage currents. Surface measurement of trace metal contamination is thus an important step in device manufacturing.
2 Hyperfine Splitting and Isotope Shifts of Potassium
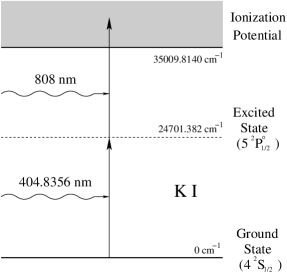
Among various kinds of resonance ionization schemes to achieve photoionization of potassium [8], the simplest two-photon RIS scheme, one-photon resonance excitation followed by one-photon ionization from the excited state performed by a single laser or two lasers, is employed for selective ionization of potassium, as shown in Fig. 1-(a), from a cost-effectiveness point of view. The resonant wavelength of 404.8356 nm in vacuum is specific to potassium atoms, though it differs slightly among different isotopes because of the existence of hyperfine splitting and isotope shifts.
2.1 Hyperfine splitting
Hyperfine splitting (HFS) is caused by the interaction of the electron spin induced magnetic dipole moment with the magnetic moment of the atomic nucleus, whose energy width , often divided by the Planck constant to be expressed in frequency unit, is given as follows [9]:
| (1) |
where and are the nuclear spin and the total electronic angular momentum, respectively, and
| (2) |
is the total angular momentum including nuclear spin and can take the following values:
| (3) |
The HFS parameters and in Eq. (1) are called the hyperfine structure interaction constants and correspond to the magnetic dipole and electric quadrupole constants, respectively. In a nonrelativistic treatment, and are written for the electron state of alkali atoms to be [10]:
| (6) | |||||
| (7) |
where and are the principal quantum number and the orbital angular momentum quantum number, and are the vacuum susceptibility and the Bohr magneton, is the nuclear factor, is the average over the wave function of the electron state, is the value of the Schdinger wave function at the nucleus position and the scalar quantity is conventionally taken as a measure of the nuclear quadrupole moment, respectively.
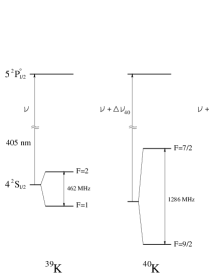
The quadrupole term cannot be observed if as in the case of the S1/2 ground state of each potassium isotope. The energy splitting width is therefore given by , and for 39K, 40K and 41K, respectively. Figure 1-(b) shows the hyperfine structure of the ground state of each potassium isotope [10]. The HFS widths of 462 MHz, 254 MHz and 1286 MHz for , and , respectively, are known with high accuracy, which are also shown in this figure.
2.2 Isotope shifts of 40K and 41K
The isotope shift is a slight difference of the transition frequency (wavelength) between the specific pair of the atomic states of two isotopes. This frequency shift is expressed as the sum of the normal mass shift (NMS), the specific mass shift (SMS) and the field shift (FS) as follows [11]:
| (8) |
The normal mass shift and the specific mass shift, collectively called the mass shift, are the reduced mass correction scaling with the transition frequency and the shift arising from the correlated motion of different pairs of atomic electrons, respectively. The field shift is produced by the different nuclear potentials coming from the different charge distributions. The value of the isotope shift of a specific isotope differs among different transitions.
Isotope shifts of the 405 nm line of and with respect to are denoted as and , respectively, in Fig. 1-(b). The measured value of is reported to be MHz using saturation spectroscopy [11]. This method is often used in the measurement of isotope shifts or hyperfine structures because of its Doppler-free nature, but it seems rather difficult to measure the signal with the isotope abundance of .
3 Experimental Setup
The experimental setup in this study is described here. The basic structure has already been published [12], and the laser system is newly upgraded mainly for the purpose of improving the photoionization efficiency as well as performing precise measurement of the S1/2 hyperfine structures and isotope shifts of the 405 nm line of potassium isotopes. A schematic view of the current experimental setup is shown in Fig. 2.
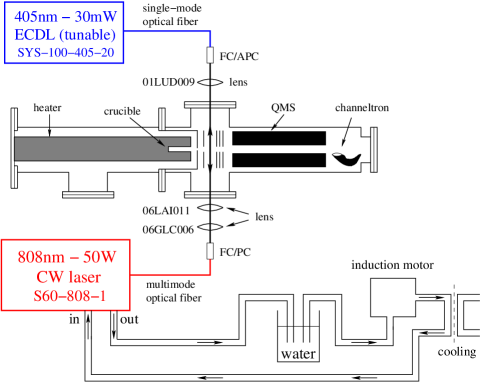
Resonance ionization of potassium gas atoms obtained from the decomposition of K2CO3 sample in the electrothermally-heated graphite crucible is accomplished by two commercially available laser diodes. One is a wavelength-tunable external cavity diode laser (ECDL; Sacher Lasertechnik SYS-100-405-20) for the resonant transition of S P. The wavelength is fine-tuned to nm in vacuum via the piezo actuator attached on the diffraction grating. An Elmos model AWG-50 waveform generator is newly prepared to scan the piezo voltage over V, corresponding to the laser frequency of GHz. The laser output of up to 20 mW in the ionization region is provided through a single-mode fiber.
The other is an Apollo Instruments model S60-808-1 water-cooled laser diode upgraded from an Amonics model ALD-808-3000-B-FC one to improve the photoionization efficiency. The laser output of up to 30 W in the ionization region is obtained through a multi-mode fiber.
The generated potassium ions are extracted, mass analyzed by a Pfeiffer Vacuum model QMS200 QMS, and finally detected as an amplified ion current by the off-axis channeltron detector.
4 Results and Discussion
4.1 Measurements of and isotope shifts
The isotope shifts of and of the 405 nm resonance excitation line with respect to , shown as and in Fig. 1-(b), are measured by comparing them to the known hyperfine splitting widths of the ground state of each potassium isotope. Scanning the laser frequency over 2 GHz via the piezo voltage , each isotope shift is shown as the relative position of the weighted average frequency of two hyperfine splitting peaks of the targeted isotope to that of .
An example of the experimental results is shown in Fig. 3 by scanning the piezo voltage in the range of . The crucible inner temperature was 1,020 K, the 405 nm laser power was mW, the 808 nm laser power was W and the applied channeltron voltage was 3 kV. The irrelevant peak seen at the relative frequency of around 1,300 MHz in the spectrum (Fig. 3-(b)) is due to the influence of the tail of the adjacent ( or ) mass peaks. Contribution of a specific mass peak to the adjacent mass number is then seen to be about 10 ppm around the mass number of 40.
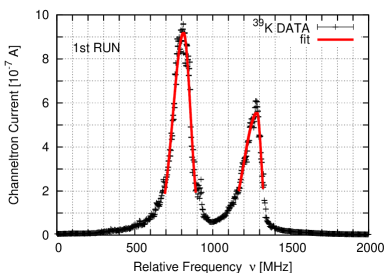
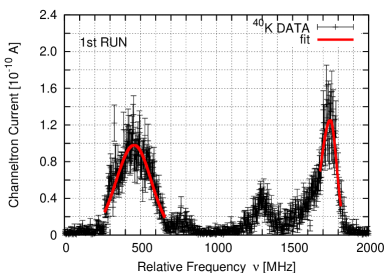

Fitted curves are also given in this figure, assuming that each absorption spectrum shows an asymmetric Gaussian profile around the resonant peak as expressed in Eq. (12). This asymmetry is probably caused by the misalignment of the mm orifice placed between the crucible and the ionization region.
| (12) |
A total of 10 runs were performed under the same conditions. During the total measurement time of about an hour through 10 runs, the frequency drift was observed as slight differences of the relative frequency position among the obtained spectra. The horizontal scale in Fig. 3 is expressed in laser frequency unit which is transformed from raw data using the experimentally obtained piezo response of [MHz/V]. This linearity was obtained from the fitted relation between the piezo voltage difference of the hyperfine splitting peaks and the known HFS widths of 462 MHz, 254 MHz and 1286 MHz for , and , respectively [10].
The isotope shifts of and with respect to are obtained as fitted averages of 10 experimental data to be MHz and MHz, the latter of which is consistent with the higher precision data by L. J. S. Halloran et al. using standard saturation spectroscopy [11]. There have been so far no reports on isotope shift of the 405 nm line. The quoted errors are statistical only. Additional systematic errors of 10% were estimated by comparison of the obtained average over 10 data of (HFS width) among each HFS width of , and described above. They are mainly caused by the laser frequency fluctuation and nonlinearity of the piezo response. Application of a confocal Fabry-Perot interferometer frequency locking system instead of the piezo voltage to control the laser frequency with an accuracy of better than MHz would help to perform more precise measurement [13, 14].
4.2 RIMS overall detection efficiency
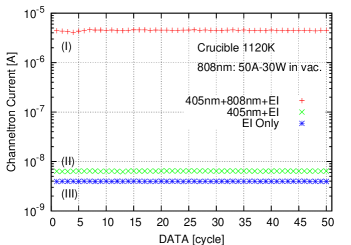
The overall detection efficiency is defined as the ratio of the number of potassium atoms detected by the QMS to that initially loaded in the crucible. Since it is hard to lock the laser frequency for a long time in our current setup, RIMS overall detection efficiency in this work was evaluated by the measurements of the ratio of the detection efficiency by RIMS to the detection efficiency by electron impact (EI) ionization. The absolute detection efficiency of EI ionization is estimated separately by switching the lasers off and filament for EI on. is then estimated to be . Estimation of the detection efficiency has already been measured in our previous work [12].
Measurement of the ratio of the detection efficiency by RIMS to the detection efficiency by EI ionization was performed using the upgraded laser system. The crucible heating current was set to 7.35 A in advance when the crucible inner temperature was 1,120 K. Resonance ionization signal could be observed at the 405 nm laser power output of mW in the ionization region and the applied piezo voltage of V. The laser current of the upgraded 808 nm LD was set to 50 A to obtain the power output of W in the ionization region. The channeltron voltage was set lower to 2 kV to avoid the saturation of channeltron currents observed at more than A.
Figure 4-(a) shows an experimental result of the channeltron current of atomic ions by RIMS and the channeltron current by EI ionization. The measurement time is 20 ms in each cycle. Throughout the measurement, the emission current of the thermal electron for EI ionization was kept to 0.1 mA, in other words, the channeltron current contributed by EI ionization remained constant. Data taken when both lasers, 405 nm ECDL and 808 nm LD, were ON and only the 405 nm ECDL was ON are denoted as (I) and (II), respectively in the figure. (III) indicates the data for EI ionization as a reference. The ratio of the detection efficiency by RIMS to EI can be obtained as the ratio of the measured channeltron current of (I) with (III) subtracted to (III), giving . Combined with , RIMS overall detection efficiency is estimated to be: , improved by about 13 times with the upgraded 808 nm laser diode.
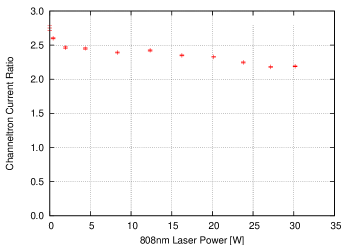
can be divided into the efficiency in the resonance ionization process and the transport efficiency in the QMS: . Figure 4-(b) shows the obtained ratios of the channeltron current without mass analysis to that with it for various 808 nm laser power settings. The crucible heating current was set lower to 6.00 A when the crucible inner temperature was 960 K and the channeltron voltage was set to 3 kV. The 405 nm laser power was unchanged. The transport efficiency in the current setup, inverse of the obtained ratio shown in Fig. 4-(b), was measured to be a bit lower than 0.5, and was almost independent of the 808 nm laser power output up to 30 W. The efficiency in the RIS part is then estimated to be .
5 Conclusion and Future Prospects
We have developed a simple and convenient resonance ionization mass spectrometer for trace analysis of potassium. An upgraded 808 nm laser diode and a waveform generator are newly used for improvement of the photoionization efficiency and precise measurement of the isotope shifts of potassium isotopes, respectively.
The obtained isotope shifts of and of the 405 nm line with respect to are MHz and MHz, the latter of which is consistent with the data by L. J. S. Halloran et al. using standard saturation spectroscopy [11]. There has been no reports on isotope shift of this line to the authors’ knowledge, probably because of the small isotope abundance of , and the lower resonance excitation cross section than that of other transition lines such as the 767 nm and 770 nm lines.
The obtained overall detection efficiency in our setup was , in which the efficiency for resonance ionization was estimated to be . In the case of trace potassium analysis without isotope discrimination, mass analysis by a QMS is not indispensable and rather reduces the detection efficiency. Therefore, the estimated 3 detection limit is obtained to be
| (13) |
where is the elementary charge and is the amplification gain of the channeltron. The background channeltron current is here conservatively overestimated to be A, and is taken to be hour as a typical measurement time. The expected detection limit shows the availability of RIMS to the commercial use like the analysis of the trace metal impurities on or in a certain material such as the contamination assessment of semiconductor wafers. For the other impurities, there might be available ECDL’s with suitable wavelengths. In case that there are no ECDL’s with matched wavelengths, wavelength-variable dye lasers or Optical Parametric Oscillation (OPO) lasers can be used instead at a higher cost. The technology of the contamination assessment is also useful for the development of niobium (Nb) superconducting cavities for the International Linear Collider (ILC) project [15].
Acknowledgments
This research is supported by a Grant-in-Aid for Exploratory Research from the Japan Society for Promotion of Science, by the Research Center for the Early Universe, School of Science, University of Tokyo, and also by the Global COE Program “the Physical Sciences Frontier” of the Ministry of Education, Culture, Sports, Science and Technology, Japan.
References
- [1] K. Wendt and N. Trautmann, Int. J. Mass Spectrom. 242 (2005) 161.
- [2] S. A. Crowther et al., J. Anal. At. Spectrom. 23 (2008) 938.
- [3] K. Watanabe et al., J. Nucl. Sci. Technol. 38 (2001) 844.
- [4] M. Miyajima, S. Sasaki, and H. Tawara, Hyperfine Interactions 74 (1992) 159.
- [5] H. J. Kluge et al., Fresenius J. Anal. Chem. 350 (1994) 323.
- [6] Dominic Lariviere et al., Spectrochim. Acta B 61 (2006) 877.
- [7] M. Beebe, “TXRF, VPD Techniques Improve Semiconductor Surface Measurement” Semiconductor International (2007) June.
- [8] E. B. Saloman, Spectrochim. Acta B 48 (1993) 1139.
- [9] D. B. Scharfe and M. A. Cappelli, “Optical Diagnostics Options for Bismuth Hall Thrusters” 40th AIAA/ASME/SAE/ASEE Joint Propulsion Conference and Exhibit (Fort Lauderdale, Florida, July 2004).
- [10] E. Arimondo, M. Inguscio, and P. Violino, Rev. Mod. Phys. 49 (1977) 31.
- [11] L. J. S. Halloran et al., Opt. Commun. 282 (2009) 554.
- [12] Yoshihiro Iwata, Yoshizumi Inoue, and Makoto Minowa, Jpn. J. Appl. Phys. 48 (2009) 076505.
- [13] B. A. Bushaw et al., Opt. Lett. 11 (1986) 422.
- [14] S. M. Jaffe, M. Rochon and W. M. Yen, Rev. Sci. Instrum. 64 (1993) 2475.
- [15] A. Yamamoto, “International Linear Collider Project and Applied Superconductivity” (in Japanese), FSST NEWS 101.