The momentum space electronic structure and the charge order of high temperature Ca2-xNaxCuO2Cl2 and Bi2Sr2CaCu2O8+δ superconductors
Abstract
We study the electronic structure of Ca2-xNaxCuO2Cl2 and Bi2Sr2CaCu2O8+δ samples in a wide range of doping, using angle-resolved photoemission spectroscopy, with emphasis on the Fermi surface (FS) in the near anti-nodal region. The “nesting wave vector,” i.e., the wave vector that connects two nearly flat pieces of the FS in the anti-nodal region, reveals a universal monotonic decrease in magnitude as a function of doping. Comparing our results to the charge order recently observed by scanning tunneling spectroscopy (STS), we conclude that the FS nesting and the charge order pattern seen in STS do not have a direct relationship. Therefore, the charge order likely arises due to strong correlation physics rather than FS nesting physics.
pacs:
74.25.Jb,71.18.+y,74.72.-h,79.60.-iThe origin of the “pseudo-gap” remains a central mystery in the physics of high-temperature superconductors. The pseudo-gap Ding1996 ; Timusk1999 means that the single-particle spectral function shows depleted spectral weight at the Fermi energy () in the metallic phase above the superconducting transition temperature, in stark contrast to a Landau quasi-particle peak at that is expected for a normal Fermi liquid. By now, the pseudo-gap is routinely observed by experimental tools that probe , the angle-resolved photoelectron spectroscopy (ARPES) or, its Fourier transform, the scanning tunneling spectroscopy (STS).
Recently, quite a few ARPES and STS studies KTanaka2006 ; TKondo2007 ; WSLee2007 ; KTerashima2007 ; TKondo2009 ; Boyer2007 ; Kohsaka2008 ; Hanaguri2007 have contributed to an emerging phenomenology of the pseudo-gap. In this emerging picture, the pseudo-gap is separate from the superconducting gap, is dominant in the “anti-nodal” region in the momentum space, and is characterized by a “checkerboard pattern” of charge order in the real space. In particular, this checkerboard pattern, representing an organization of the electron density with approximately four lattice constant periodicities along the or direction of the (nearly) tetragonal CuO2 lattice, is observed in all the samples of cuprates that have been found to be appropriate for STS studies, i.e., Bi2Sr2CaCu2O8+δ (Bi2212) compounds Hoffman2002A ; McElroy2005 ; Howald2003A ; Howald2003B ; YHLiu2007 ; Vershinin2004 , Bi2-yPbySr2-zLazCuO6+δ (Bi2201) compounds Wise2008 , and Ca2-xNaxCuO2Cl2 (Na-CCOC) compounds Hanaguri2004 ; Hanaguri2007 . This unique feature, while strong in the underdoped regime, is observed up to near-optimal doping McElroy2005 or optimal doping Hanaguri2007 , albeit with a diminished weight.
What is the underlying mechanism of the checkerboard pattern? Here we shall differentiate between two generic scenarios, a weak-correlation scenario and a strong-correlation scenario. In the first scenario, we associate the checkerboard pattern as reflecting the instability of the electron system due to a Fermi-surface (FS) nesting. Thus, here we are envisioning the standard Peierls-type charge-density-wave (CDW) phenomenon Peierls or the standard weak-coupling spin-density-wave (SDW) phenomenon Gruner . In the second scenario, we consider the checkerboard pattern as driven by large-energy scale physics, as opposed to the FS nesting physics. For instance, the checkerboard pattern has been attributed to an instability of the Hubbard model Seibold2007 , or to the formation of a Wigner solid of hole pairs embedded in a sea of -wave resonating valence bond (RVB) states Anderson2004 . The essential criterion by which we can distinguish the two mechanisms is the agreement between the Fermi-surface nesting wave vector and the checkerboard periodicity. Within the second scenario, this agreement is not a required primary feature but an optional feature. Within the first scenario, this agreement is an absolute requirement.
In our definition above, we take the weak-correlation FS-based scenario as the FS nesting scenario only, leaving out other, generally possible, one-electron-band mechanisms such as the van Hove singularity-induced CDW Rice-CDW . Note also that a FS object such as the “Fermi arc” Norman1998 may give rise to a high Lindhard susceptibility due to the high density of states at extremal points of the arc, causing a CDW. Such a Fermi-arc-based CDW scenario, e.g., as suggested in a recent STS work Kohsaka2008 , requires a fundamental modification of the FS to a Fermi arc with a strong correlation as a prerequisite and does not involve FS nesting. Thus, such a scenario should be considered as a strong-correlation scenario, not as a weak correlation scenario.
Thus, we pose the subsequent question: For high-temperature superconductors, is there a direct connection between the Fermi-surface nesting and the checkerboard pattern? A survey of the literature does not give a clear answer, which this paper now aims to provide. One does find in the literature, however, some initial attempts at such an answer. For example, a recent work on Bi2201 superconductors Wise2008 found that the periodicity of the charge order pattern is a strong function of the doping, ranging from 4.5 lattice constants in the underdoped region to 6.2 lattice constants at the optimal doping. Qualitatively, this trend is what one would expect for a weak-correlation scenario, as the authors of that work have indeed suggested. In addition, this conclusion appears to be supported by work on Na-CCOC compounds, where a good agreement between the Fermi-surface nesting vector in ARPES KMShen2005 and the checkerboard periodicity Hanaguri2004 has been noted. However, this study was limited to low doping values, and in view of more recent work Hanaguri2007 , a study covering a wider doping range including optimal doping is necessary to attain a firm conclusion.
In this paper, we report ARPES data on Na-CCOC samples and Bi2212 samples in view of these questions. We significantly widen the doping range of the Na-CCOC samples studied by ARPES in comparison to previous studies KMShen2005 ; Sasagawa2003 , and find that such an improvement is of essential importance. We compare our results on Na-CCOC and Bi2212 samples with their known checkerboard periodicity values. We re-examine the degree of agreement, or disagreement, between the Fermi-surface nesting and the checkerboard pattern for Na-CCOC samples, and, in addition, Bi2201 samples. We find that in all the cases examined, such an agreement is absent, or accidental at best. Thus, we find that a strong-correlation scenario is much more likely than a weak-correlation scenario for explaining the pseudo-gap.
The photoemission measurements were carried out at beam line 5-4 of the Stanford Synchrotron Radiation Lightsource (SSRL) and at beam line 10.0.1 of the Advanced Light Source (ALS) at Lawrence Berkeley National Laboratory, using a Scienta R4000 electron energy analyzer. The photon energy used was 25.5 eV for Na-CCOC and 25 eV for Bi2212, both with an energy resolution of 15-20 meV. The angular resolution is 0.2∘ (0.008 Å-1 in momentum). Na-CCOC samples, grown by a high-pressure flux method to unprecedented high doping values for this experiment, include underdoped samples ( K), optimally doped samples ( K), and overdoped samples ( K) KyungHee2006 . Bi2212 samples were grown by the traveling solvent floating-zone method, and include underdoped samples ( K), optimally doped samples ( K), and overdoped samples ( K). Hereafter, we will refer to the samples with the usual “Tc notation” such as UD74, OP91, and OD74, where UD, OP, and OD mean under-doping, optimal doping and overdoping, respectively. All samples were cleaved in situ and measured in an ultra-high vacuum with a base pressure of better than 4 10-11 mbar. For Na-CCOC samples measurements were made at 10 K, while for Bi2212 samples measurements were made at 200 K for UD74 and OP91 samples, and at 100 K for OD74 samples. It is worth noting that recent advances KyungHee2006 ; Hanaguri2007 in high-pressure sample growth resulted in the accessibility of the optimally doped and overdoped samples of the Na-CCOC samples, for which no ARPES data have been reported previously to our knowledge.
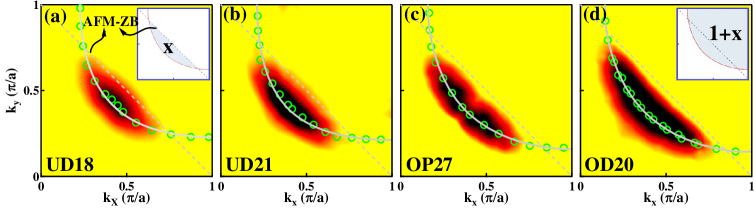
Figure 1 shows ARPES intensity maps at for Na-CCOC samples. While these data were taken at 10 K in the superconducting phase, the data will be discussed here only in terms of the Fermi arc Norman1998 and the pseudo-gap, with the more elusive and weaker feature of the superconductivity left for a possible future study KMShen2005 ; Hanaguri2007 ; gap .
This figure clearly shows that the high-intensity region of the map (“Fermi arc” Norman1998 ) increases its length as a function of doping, as expected. From our data, we define, operationally, the “Fermi surface” as the contour determined by the momentum distribution curve (MDC) peak positions (circle symbols). These Fermi surfaces in Figs. 1(a), and 1(b) are in good agreement with those published previously on the same compounds with similar doping values KMShen2005 .
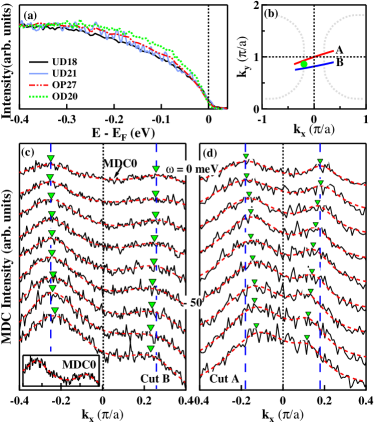
Figure 2(a) shows the energy distribution curves (EDCs) near the anti-nodal point, as a function of doping. It is seen that these EDCs are characterized by a large pseudo-gap, with the weight at strongly suppressed. This is quite reminiscent of a large pseudo-gap and the lack of a coherent peak, as reported by STS Hanaguri2007 .
Figure 2(c) shows the MDCs for a cut at the anti-nodal point for the UD21 sample, and Fig 2(d) for the OP27 sample. In Figs. 1(c) and 2(d), MDCs are fit with two Lorentzian curves (red dashed lines) and the positions of the two Lorentzian peaks are marked with triangle symbols. In agreement with a previous work KMShen2005 , the MDCs for the underdoped sample do not show appreciable dispersion up to a binding energy of meV. However, the MDCs for the optimally doped sample show clear dispersions at a binding energy of meV. This is consistent with the known qualitative behavior of the pseudo-gap as a function of doping Damascelli .
The Fermi surface as defined in Fig. 1 becomes flat as it crosses the Brillouin zone boundary. Thus the Fermi surface near the anti-nodal point is approximately nested, as observed previously KMShen2005 , and the nesting vector can be determined from our Fermi surfaces. This is shown in Fig. 3(a), which summarizes all of our Fermi surfaces of Fig. 1.
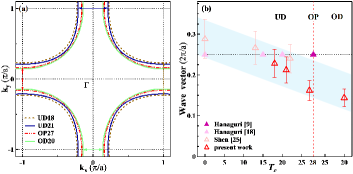
Figure 3(b) summarizes our nesting wave vectors, along with the wave vectors corresponding to the checkerboard patterns of STS Hanaguri2004 ; Hanaguri2007 . Also, included in the figure are the nesting wave vectors determined for underdoped samples of Na-CCOC by Shen et al. KMShen2005 . First of all, it can be easily noted that our data agree well with Shen et al.’s data for the overlapping doping region. Second, our data, now extended to optimal doping and overdoping, clearly indicate that the nesting vector is a decreasing function of doping. Third, in hindsight, the data by Shen et al. also show the same trend. Fourth, for the optimal doping, the FS nesting would imply a CDW periodicity that is too large () as compared with the checkerboard periodicity ().
Previously KMShen2005 the agreement between the ARPES nesting vector and the checkerboard wave vector was interpreted to be very important. Given our findings above, however, there emerges another possibility; The nesting wave vector and the checkerboard periodicity are independent, although they might coincide by accident. This is suggested by the striking disagreement found in the doping dependence and a similarly striking disagreement in the value at optimal doping, although the second can be considered as a mere consequence of the first.
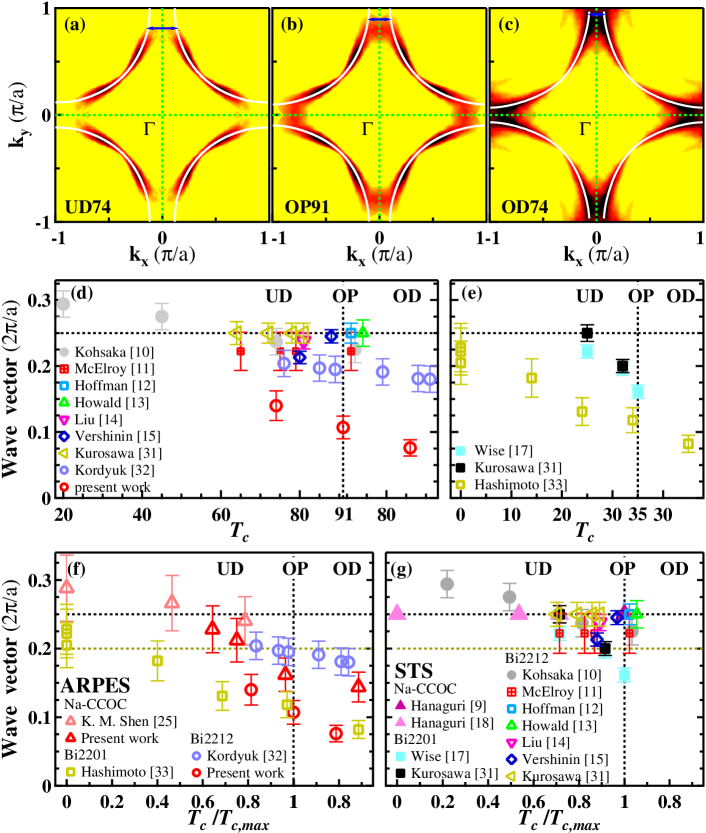
In order to help determine which case is more likely, we now discuss Bi2212 superconductors and Bi2201 superconductors. Fig. 4(a)-(c) show ARPES intensity maps for Bi2212 samples. Fig. 4(d) summarizes the comparison of STS data and ARPES data for Bi2212. The main feature is that the Fermi-surface nesting vector for Bi2212 is always too small in comparison with the checkerboard wave vectors. Our experimental data show the behavior of the anti-bonding band dispersion, while the data of Kordyuk et al. Kordyuk2002 , included in Fig. (d), emphasize the behavior of the bonding band dispersion, consistent with the well-known empirical band structure of Bi2212 Markiewicz2005 . The STS data on Bi2212 suggest that the checkerboard periodicity is 3.5 - 4.5 lattice constants, while the FS nesting would predict 5, or much greater, lattice constants. Clearly, Fig. 4(d) points out the difficulty of reconciling the ARPES data with the STS data in the presence of bilayer splitting, a point that has been already raised in a different context Markiewicz-PRB-2004 .
Figure 4(e) shows the comparison for Bi2201 superconductors. ARPES and STS disagree greatly here also. Furthermore, the disagreement becomes greater as doping decreases, i.e., as the pseudo-gap physics becomes more important. A related observation is as follows: While the doping dependence of the STS data is in qualitative agreement with that of the ARPES data, as pointed out previously Wise2008 , the slope of the STS data is actually times too large in magnitude, as Fig. 4(e) shows.
Finally, Fig. 4(f), and 4(g) present all the data of Fig. 3(b),4(d), and 4(e) in a different way. The wave vectors are plotted as a function of normalized ’s. Two main discrepancies between ARPES and STS are observed. First, ARPES data show a universal slope, while STS data do not. Second, STS wave vectors show a narrow distribution, with most values belonging in the range , while ARPES data show a wide and uniform distribution.
Putting aside this summary of discrepancies between ARPES and STS, one might ask “is there a way to understand the apparent complexity in the data of Bi2212 [Fig. 4(d)]?” The presence of bilayer splitting in the ARPES data and the mixed trends of the doping dependence in the STS data, the latter presumably being due to different conditions of STS experiments, contribute to this apparent complexity. Fig. 4(f), which shows good agreement between the bonding (anti-bonding) band data for Bi2212 with the data for Na-CCOC (Bi2201), might be viewed as suggesting a possible picture where the kinds of discrepancies observed in Na-CCOC [Fig. 3(b)] and Bi2201 [Fig. 4(e)] have a mixed presence in Bi2212, giving rise to the observed complexity.
To sum up, a weak-coupling CDW (or SDW) scenario is highly unlikely. Instead a strong-electron correlation is likely the driving force of the charge order. Note that this conclusion does not rule out the possibility of a cooperative or secondary effect of the FS nesting or a similar momentum-space mechanism Kohsaka2008 .
Our claim is corroborated by more evidence. First, if the FS nesting is the driving force, then it is difficult to explain why the underdoping region is preferred for the charge order. According to a previous study on Bi2212 Kordyuk2002 , the FS in the anti-nodal region becomes very flat, and thus more highly nesting, at overdoping. Second, the FS nesting scenario would require that the checkerboard pattern reverses the contrast as the sample bias voltage changes sign Mallet1999 . The STS data Hanaguri2007 show quite the opposite: The contrast is nonreversal.
The consideration of the so-called “Luttinger sum rule” Rice provides general additional support. The sum rule concerns , the hole doping per unit cell. In a strong correlation scenario, the sum rule is satisfied only by the combination of the Luttinger surface (LS) and the FS. We follow the theory of Ref. Rice , and take the LS to be the anti-ferromagnetic zone boundary (AFM-ZB) and the FS to be approximately the geometry formed by the Fermi arc and the AFM-ZB. As indicated in the inset of Fig. 1(a), in this scenario, the FS accounts for only . In a weak-correlation scenario, the FS is now large, and accounts for , as indicated in Fig. 1(d). Assuming the strong-correlation scenario, then, we obtain 0.11, 0.16, 0.21, and 0.23, respectively from UD18 through OD20. In the weak-correlation scenario, 0.00, 0.06, 0.15, and 0.19. So, while the latter scenario may be appropriate for optimal or over doping, it fails completely at underdoping. Our sum-rule analysis here agrees well with a similar analysis based on the STS data of Bi2212 Kohsaka2008 , where a connection between the modified FS in the strong correlation scenario and charge order was noted, as already discussed above, and also with a recent ARPES work on Bi2212 Johnson-Fermi-Arc .
To conclude, the electron correlation is of primary importance for the charge order and the pseudo-gap in cuprates. In electron-correlation-based scenarios, the checkerboard periodicity has been shown to be doping independent Seibold2007 , as in Na-CCOC, or an argument based on the domain size has been given Anderson2004 to explain the small doping dependence seen in Bi2212. In closing, we note that similar strong-correlation-based charge order scenarios have been proposed recently for quasi-one-dimensional cuprates Rusydi2010 and La-based superconductors Berg-FKT2009 , motivating further work.
G.H.G. acknowledges helpful discussions with S. A. Kivelson and D.-H. Lee. G.H.G. and J.Q.M thank K. M. Shen for helpful discussions. The work at UCSC was supported partially by a COR FRG grant. Portions of this research were carried out at the Stanford Synchrotron Radiation Lightsource (SSRL), a Directorate of SLAC National Accelerator Laboratory and an Office of Science User Facility operated for the U.S. Department of Energy Office of Science by Stanford University. The Advanced Light Source (ALS) is supported by the Director, Office of Science, Office of Basic Energy Sciences, of the U.S. Department of Energy under Contract No. DE-AC02-05CH11231. The work at the BNL was supported by DOE under Contract No. DE-AC02-98CH10886.
References
- (1) H. Ding, T. Yokoya, J. C. Campuzano, T. Takahashi, M. Randeria, M. R. Norman, T. Mochiku, K. Kadowaki, and J. Giapintzakis, Nature (London) 382, 51 (1996).
- (2) T. Timusk, and B. Statt, Rep. Prog. Phys. 62, 61(1999).
- (3) K. Tanaka, W. S. Lee, D. H. Lu, A. Fujimori, T. Fujii, Risdiana, I. Terasaki, D. J. Scalapino, T. P. Devereaux, Z. Hussain, and Z.-X. Shen, Science 314, 1910 (2006).
- (4) T. Kondo, T. Takeuchi, A. Kaminski, S. Tsuda, and S. Shin, Phys. Rev. Lett. 98, 267004 (2007).
- (5) W. S. Lee, I. M. Vishik, K. Tanaka, D. H. Lu, T. Sasagawa, N. Nagaosa, T. P. Devereaux, Z. Hussain, and Z.-X. Shen, Nature(London) 450, 81 (2007).
- (6) K. Terashima, H. Matsui, T. Sato, T. Takahashi, M. Kofu, and K. Hirota, Phys. Rev. Lett. 99, 017003 2007.
- (7) T. Kondo, R. Khasanov, T. Takeuchi, J. Schmalian, and A. Kaminski, Nature(London) 457, 296 (2009).
- (8) M. C. Boyer, W. D. Wise, K. Chatterjee, M. Yi, T. Kondo, T. Takeuchi, H. Ikuta and E. W. Hudson, Nat. Phys. 3, 802 (2007).
- (9) T. Hanaguri, Y. Kohsaka, J. C. Davis, C. Lupien, I. Yamada, M. Azuma, M. Takano, K. Ohishi, M. Ono, and H. Takagi, Nat. Phys. 3, 865 (2007).
- (10) Y. Kohsaka, C. Taylor, P. Wahl, A. Schmidt, Jhinhwan Lee, K. Fujita, J. W. Alldredge, K. McElroy, Jinho Lee, H. Eisaki, S. Uchida, D.-H. Lee, and J. C. Davis, Nature(London) 454, 1072 (2008).
- (11) K. McElroy, D.-H. Lee, J. E. Hoffman, K. M. Lang, J. Lee, E. W. Hudson, H. Eisaki, S. Uchida, and J. C. Davis, Phys. Rev. Lett. 94 197005 (2005).
- (12) J. E. Hoffman, E. W. Hudson, K. M. Lang, V. Madhavan, H. Eisaki, S. Uchida, and J. C. Davis, Science 295,466(2002).
- (13) C. Howald, H. Eisaki, N. Kaneko, M. Greven, and A. Kapitulnik, Phys. Rev. B 67, 014533 (2003).
- (14) Y. H. Liu, K. Takeyama, T. Kurosawa, N. Momono, M. Oda, and M. Ido, Phys. Rev. B 75, 212507 (2007).
- (15) M. Vershinin, S. Misra, S. Ono, Y. Abe, Yoichi Ando, and A. Yazdani, Science 303, 1995 (2004).
- (16) C. Howald, H. Eisaki, N. Kaneko, and A. Kapitulnik, Proc. Natl. Acad. Sci. (U.S.A) 100, 9705 (2003).
- (17) W. D. Wise, M. C. Boyer, K. Chatterjee, T. Kondo, T. Takeuchi, H. Ikuta, Yayu Wang, and E. W. Hudson, Nat. Phys. 4, 696 (2008).
- (18) T. Hanaguri, C. Lupien, Y. Kohsaka, D.-H. Lee, M. Azuma, M. Takano, H. Takagi, and J. C. Davis, Nature (London) 430, 1001 (2004).
- (19) R. E. Peierls, Quantum Theory of Solids (Oxford University. Press, New York, 1955), p. 108.
- (20) G. Grüner, Density Waves in Solids, (Addison-Wesley, Reading, MA, 1994).
- (21) G. Seibold, J. Lorenzana, and M. Grilli, Phys. Rev. B 75, 100505(R) (2007).
- (22) P. W. Anderson, cond-mat/0406038.
- (23) T.M. Rice and G.K. Scott, Phys. Rev. Lett. 35, 120 (1975).
- (24) M. R. Norman, H. Ding, M. Randeria, J. C. Campuzano, T. Yokoya, T. Takeuchik, T. Takahashi, T. Mochiku, K. Kadowaki, P. Guptasarma, and D. G. Hinks, Nature(London) 392, 157 (1998).
- (25) K. M. Shen, F. Ronning, D. H. Lu, F. Baumberger, N. J. C. Ingle, W. S. Lee, W. Meevasana, Y. Kohsaka, M. Azuma, M. Takano, H. Takagi, and Z.-X. Shen, Science 307, 901 (2005).
- (26) T. Sasagawa, F. Ronning, Y. Kohsaka, K. M. Shen, T. Yoshida, M. Azuma, M. Takano, Z.-X. Shen, and H. Takagi, Physica C 388-389, 307 (2003).
- (27) K.-H. Kim, H.-J Kim, J.-D Kim, and H.-G. Lee, Journal of the Korean Physical Society. 48, 1032 (2006).
- (28) R. S. Markiewicz, S. Sahrakorpi, M. Lindroos, Hsin Lin, and A. Bansil, Phys. Rev. B 72, 054519 (2005).
- (29) A possible feature in our data to be associated with the superconductivity is a few meV shift of the leading edge for the spectra within the Fermi arc. Given the energy window used in our experiment, this is a minor feature that needs further investigation.
- (30) A. Damascelli, Z. Hussain, and Z.-X. Shen, Rev. Mod. Phys. 75, 473 (2003).
- (31) T. Kurosawa, T. Yoneyama, Y. Takano, M. Hagiwara, R. Inoue, N. Hagiwara, K. Kurusu, K. Takeyama, N. Momono, M. Oda, and M. Ido, Phys. Rev. B 81, 094519 (2010); A. Hashimoto, N. Momono, M. Oda, and M. Ido, ibid 74, 064508 (2006).
- (32) A. A. Kordyuk, S. V. Borisenko, M. S. Golden, S. Legner, K. A. Nenkov, M. Knupfer, J. Fink, H. Berger, L. Forro, and R. Follath, Phys. Rev. B 66, 014502 (2002).
- (33) M. Hashimoto, T. Yoshida, H. Yagi, M. Takizawa, A. Fujimori, M. Kubota, K. Ono, K. Tanaka, D. H. Lu, Z.-X. Shen, S. Ono, and Yoichi Ando, Phys. Rev. B 77, 094516 (2008).
- (34) R. S. Markiewicz, Phys. Rev. B 69, 214517 (2004).
- (35) P. Mallet, K. M. Zimmermann, Ph. Chevalier, J. Marcus, J. Y. Veuillen, and J. M. Gomez Rodriguez, Phys. Rev. B 60, 2122 (1999).
- (36) Kai-Yu Yang, T. M. Rice, and Fu-Chun Zhang, Phys. Rev. B 73, 174501 (2006).
- (37) H.-B. Yang, J. D. Rameau, Z.-H. Pan, G. D. Gu, P. D. Johnson, H. Claus, D. G. Hinks, and T. E. Kidd, Phys. Rev. Lett. 107, 047003 (2011).
- (38) A. Rusydi, W. Ku, B. Schulz, R. Rauer, I. Mahns, D. Qi, X. Gao, A. T. S. Wee, P. Abbamonte, H. Eisaki, Y. Fujimaki, S. Uchida, and M. R bhausen, Phys. Rev. Lett. 105, 026402 (2010).
- (39) E. Berg, E. Fradkin, S. A Kivelson, and J. M Tranquada, New Journal of Physics 11, 115004 (2009).